SlideShare a Scribd company logo
1 of 8
Download to read offline
Industrial
Outlook
An in-depth look at the
Louisville industrial market.
Analysis includes leasing,
sales, construction and
employment.
Louisville | Q1 2019
JLL Research
© 2017 Jones Lang LaSalle IP, Inc. All rights reserved. All information contained herein is from sources deemed reliable; however, no representation or warranty is made to the accuracy thereof.
Q1 2019
Insight
Louisville Industrial Outlook
The year is off to a strong start as the pace of absorption in 2018 continued
into 2019 with over 2.1 million square feet absorbed. Two buildings totaling
nearly 868,000 square feet were leased in the Airport submarket. Ford
leased the remaining 302,000 square feet of the building at 10301 Air
Commerce Drive, after initially taking down 370,000 square feet last fall.
Hydra made the largest lease of the quarter, taking the 505,000-square-foot
Exeter building in River Ridge.
As expected, speculative construction completions slowed significantly to
start the year as development tapered off in mid- to-late 2018. However,
announcements have picked back up with Browning planning a 925,000-
squre-foot building in Bullitt County, Exeter planning a 561,600-square-foot
building in Southern Indiana, and Main Street Realty planning a 331,000-
square-foot building in the Airport submarket.
This quarter was also active on the investor side with 3208 E. Blue Lick Road
transferring to Dream Industrial REIT and 857 Park Loop Road transferring to
Colony Capital. Both acquisitions were part of larger portfolio packages.
Louisville remains a desirable location for institutional investors who have
been priced out of larger markets, with several buildings currently under
contract providing attractive returns for investors.
Outlook
The pace of absorption over the past 12-months has been historic for
Louisville with over 7.0 million square feet leased. The surge in absorption
has ignited interest in speculative development opportunities. Given the
current availabilities and development announcements, there continues to
be intriguing options for users evaluating the Louisville market.
Fundamentals Forecast
YTD net absorption 2,157,300 s.f. â–Ľ
QTD net absorption 2,157,300 s.f. â–Ľ
Under construction 3,470,640 s.f. â–Ľ
Total vacancy 7.02 % â–Ľ
Average asking rent (NNN) $3.95 p.s.f. â–˛
Tenant improvements Falling â–Ľ
0
4,000,000
8,000,000
2015 2016 2017 2018 2019
Supply and demand (s.f.) Net absorption
Deliveries
Absorption remains strong as vacancy continues to fall
5.7%
8.7%
11.7%
9.4%
7.0%
2015 2016 2017 2018 2019
Total vacancy
$3.20
$3.40
$3.60
$3.80
$4.00
2014 2015 2016 2017 2018 2019
Average asking rents ($/s.f.)
© 2019 Jones Lang LaSalle IP, Inc. All rights reserved. All information contained herein is from sources deemed reliable; however, no representation or warranty is made to the accuracy thereof.
Top trends and activity
• Dream Industrial REIT and Colony Capital entered the Louisville market
in Bullitt County, as part of separate portfolio packages.
• Two buildings totaling over 850,000 square feet in the Airport submarket
were leased.
• Modern bulk vacancy dipped to 7.02 percent, the lowest mark since
2015.
© 2017 Jones Lang LaSalle IP, Inc. All rights reserved. All information contained herein is from sources deemed reliable; however, no representation or warranty is made to the accuracy thereof.
Inventory
(s.f.)
YTD
total net
absorption
(s.f.)
YTD
total net
absorption
(% of inventory)
Total
Vacancy (%)
Average
total asking
rent
($ p.s.f.)
YTD
completions
(s.f.)
Under
construction
(s.f.)
Airport 24,121,751 1,289,500 5.3% 3.6% $4.11 129,000 468,000
Bullitt County 13,647,026 0 0.0% 10.2% $4.09 0 572,000
East 5,850,720 0 0.0% 0.0% $5.95 0 150,040
Riverport 12,557,133 362,800 2.9% 9.2% $3.56 230,000 0
Southern Indiana 10,216,172 505,000 4.9% 12.2% $3.85 0 2,280,600
Louisville Totals 66,392,802 2,157,300 3.2% 7.2% $3.95 359,000 3,470,640
Analyzes all industrial buidings greater than 100,000 s.f. with a minimum clear height of 24'
2,234,648
1,934,181 2,059,001
2,742,889
3,029,702
3,843,783
2,568,298
5,710,124
2,157,300
0
1,000,000
2,000,000
3,000,000
4,000,000
5,000,000
6,000,000
2011 2012 2013 2014 2015 2016 2017 2018 Q1 2019
Q1 2019
Statistics
Louisville Industrial Outlook
9.2%
8.3%
7.2%
6.6%
5.7%
8.7%
11.7%
9.4%
7.0%
2.0%
5.0%
8.0%
11.0%
14.0%
2011 2012 2013 2014 2015 2016 2017 2018 Q1 2019
© 2019 Jones Lang LaSalle IP, Inc. All rights reserved. All information contained herein is from sources deemed reliable; however, no representation or warranty is made to the accuracy thereof.
Total Vacancy Rate %
Total Net Absorption
Inventory
(s.f.)
YTD
total net
absorption
(s.f.)
YTD
total net
absorption
(% of inventory)
Total
Vacancy (%)
Average
total asking
rent
($ p.s.f.)
YTD
completions
(s.f.)
Under
construction
(s.f.)
Airport 24,121,751 1,289,500 5.3% 3.6% $4.11 129,000 468,000
Bullitt County 13,647,026 0 0.0% 10.2% $4.09 0 572,000
East 5,850,720 0 0.0% 0.0% $5.95 0 150,040
Riverport 12,557,133 362,800 2.9% 9.2% $3.56 230,000 0
Southern Indiana 10,216,172 505,000 4.9% 12.2% $3.85 0 2,280,600
Louisville Totals 66,392,802 2,157,300 3.2% 7.0% $3.95 359,000 3,470,640
Analyzes all industrial buidings greater than 100,000 s.f. with a minimum clear height of 24'
© 2017 Jones Lang LaSalle IP, Inc. All rights reserved. All information contained herein is from sources deemed reliable; however, no representation or warranty is made to the accuracy thereof.
$187,037,809
10
$68
5.75%-6.25%
98.5%
2.5%
Top sales transactions last 12 months
Size (s.f.) $ p.s.f. Sale date
2621 Technology Drive WPT Industrial REIT WPT Capital Advisors 224,000 $17,900,000 $80 Sep-18
120 Velocity Way Granite Capital Browning 721,000 $68 Dec-18
7251 Logistics Drive Paul & Eleanor Sade Trust Panattoni 356,000 $66 May-18
250 Hilton Drive GLP Van Trust 592,800 $38,400,000 $65 Apr-18
857 Park Loop Road* Colony Capital Dermody 546,000 $26,489,801 $47 Feb-19
Dream Industrial REIT Transwestern 302,500 $13,491,668 $45 Feb-19
1234 Gardiner Lane GSK Properties 162,000 $4,610,000 $28 Dec-18
Sales price $
12 month sales volume $ by submarket
$48,696,340
*Purchased as part of portfolio
Dry Ridge Capital
$23,500,000
3208 E. Blue Lick Road*
Building address Buyer company
Transactions details
Seller company
Average Class A sale price p.s.f.
12 month transaction volume at a glance
Total volume
Number of transactions
Average Class A cap rate
Sales activity by building type last 12 months
Warehouse/Dist. sales volume as % of
total
Manufacturing sales volume as % of
total
Top sellers (s.f.)Top buyers (s.f.)
$182,287,809
$4,750,000
0 s.f.
500,000 s.f.
1,000,000 s.f.
1,500,000 s.f.
2,000,000 s.f.
2,500,000 s.f.
3,000,000 s.f.
3,500,000 s.f.
$0
$50,000,000
$100,000,000
$150,000,000
$200,000,000
Warehouse / Distribution Manufacturing
Sum of Price ($) Sum of RBA (SF)
20%
16%
15%13%
10%
8%
6%
Granite GLP
Colony Capital Sazerac
Paul & Eleanor Sade Trust Dream Industrial REIT
WPT Industrial REIT GSK Properties
Sperber Familly Trust Greif
20%
16%
15%13%
10%
8%
6%
Browning Van Trust
Dermody New Mill Capital Holdings
Panattoni Transwestern
WPT Capital Advisors Dry Ridge Capital
Atalaya Investments Alemap
$88,677,809
$43,150,000
$27,200,000
$17,900,000
$10,110,000
Bullitt County
Southern Indiana
Riverport
East
Airport
Q1 2019
Sales
Louisville Industrial Outlook
This report analyzes all industrial sales > 75,000 s.f. year-to-date
© 2019 Jones Lang LaSalle IP, Inc. All rights reserved. All information contained herein is from sources deemed reliable; however, no representation or warranty is made to the accuracy thereof.
$187,037,809
10
$68
5.75%-6.25%
98.5%
2.5%
Top sales transactions last 12 months
Size (s.f.) $ p.s.f. Sale date
2621 Technology Drive WPT Industrial REIT WPT Capital Advisors 224,000 $17,900,000 $80 Sep-18
120 Velocity Way Granite Capital Browning 721,000 $68 Dec-18
7251 Logistics Drive Paul & Eleanor Sade Trust Panattoni 356,000 $66 May-18
250 Hilton Drive GLP Van Trust 592,800 $38,400,000 $65 Apr-18
857 Park Loop Road* Colony Capital Dermody 546,000 $26,489,801 $47 Feb-19
Dream Industrial REIT Transwestern 302,500 $13,491,668 $45 Feb-19
1234 Gardiner Lane GSK Properties 162,000 $4,610,000 $28 Dec-18
Sales price $
12 month sales volume $ by submarket
$48,696,340
*Purchased as part of portfolio
Dry Ridge Capital
$23,500,000
3208 E. Blue Lick Road*
Building address Buyer company
Transactions details
Seller company
Average Class A sale price p.s.f.
12 month transaction volume at a glance
Total volume
Number of transactions
Average Class A cap rate
Sales activity by building type last 12 months
Warehouse/Dist. sales volume as % of
total
Manufacturing sales volume as % of
total
Top sellers (s.f.)Top buyers (s.f.)
$182,287,809
$4,750,000
0 s.f.
500,000 s.f.
1,000,000 s.f.
1,500,000 s.f.
2,000,000 s.f.
2,500,000 s.f.
3,000,000 s.f.
3,500,000 s.f.
$0
$50,000,000
$100,000,000
$150,000,000
$200,000,000
Warehouse / Distribution Manufacturing
Sum of Price ($) Sum of RBA (SF)
20%
16%
15%13%
10%
8%
6%
Granite GLP
Colony Capital Sazerac
Paul & Eleanor Sade Trust Dream Industrial REIT
WPT Industrial REIT GSK Properties
Sperber Familly Trust Greif
20%
16%
15%13%
10%
8%
6%
Browning Van Trust
Dermody New Mill Capital Holdings
Panattoni Transwestern
WPT Capital Advisors Dry Ridge Capital
Atalaya Investments Alemap
$88,677,809
$43,150,000
$27,200,000
$17,900,000
$10,110,000
Bullitt County
Southern Indiana
Riverport
East
Airport
© 2017 Jones Lang LaSalle IP, Inc. All rights reserved. All information contained herein is from sources deemed reliable; however, no representation or warranty is made to the accuracy thereof.
Total leased at delivery (%) 2.7%
Total speculative at delivery (s.f.) 2,436,815
Total BTS at delivery (s.f.) 481,000
Total owner-user at delivery (s.f.) 1,300,000
Total # of properties delivered 11
Asking rental rate (low - high) $4.25 - $5.50
Largest projects delivered past 12 months
Building/Address RBA (s.f.) Delivery date
Leased at
delivery (%)
W.W. Grainger 1,300,000 Q3 2018 100%
10301 Air Commerce Drive 677,685 Q2 2018 0%
300 Hilton Drive 506,117 Q3 2018 0%
4500 Fern Valley Road 350,000 Q3 2018 0%
2349 E. Millers Lane 251,000 Q4 2018 100%
101 Lewman Way 250,000 Q4 2018 0%
Total pre-leased (%) 25.0%
Total speculative under construction (s.f.) 1,583,640
Total BTS under construction (s.f.) -
Total Owner-user under construction (s.f.) 1,887,000
Total # of properties UC 8
Asking rental rate (low - high) $3.90 - $4.15
Largest projects currently under construction
Building RBA (s.f.) Delivery date Pre-leased (%)
Salt River Business Park 572,000 Q3 2019 0%
Exeter River Ridge 561,600 Q4 2019 0%
Logistics River Ridge 469,000 Q2 2019 100%
Premier Packaging 318,000 Q2 2019 100%
Eastpoint Business Center B 150,040 Q1 2019 21%
Speculative
Speculative
Owner-user
Submarket
Under construction
3,470,640
Under construction (s.f.)
Under construction in-depth
Upcoming deliveries by year (s.f., excludes YTD completions)
Southern Indiana Gray Speculative
New and historical deliveries
Completions in-depth
4,217,815
Total delivered past 12 months (s.f.)
Construction typeOwnerSubmarket
Airport
Airport
Southern Indiana
Airport
Airport
Advance Distribution Services
The Schroering Co.
Exeter Property Group
Molto
W.W. Grainger
BTS
Speculative
East
Airport
Southern Indiana
Southern Indiana
Bullitt County
Speculative
Owner-user
Owner Construction type
Owner-user
Boland
Premier Packaging
Niagara Bottling
Exeter Property Group
Crossdock Dev.
Speculative
Speculative
0
1,000,000
2,000,000
3,000,000
4,000,000
5,000,000
6,000,000
7,000,000
2012 2013 2014 2015 2016 2017 2018 2019
0
500,000
1,000,000
1,500,000
2,000,000
2,500,000
3,000,000
3,500,000
4,000,000
2019
Owner-user Speculative
Q1 2019
Construction
Louisville Industrial Outlook
This report analyzes all industrial developments under construction & new deliveries > 100,000 s.f.
© 2019 Jones Lang LaSalle IP, Inc. All rights reserved. All information contained herein is from sources deemed reliable; however, no representation or warranty is made to the accuracy thereof.
© 2017 Jones Lang LaSalle IP, Inc. All rights reserved. All information contained herein is from sources deemed reliable; however, no representation or warranty is made to the accuracy thereof.
Q1 2019
Construction
Louisville Industrial Outlook
1
Location: 100 Velocity Way
Square feet: 925,000
Tenant(s): None
Landlord: Browning
1
2
Address: 4301 Produce Road
Square feet: 318,000
Tenant(s): Owner-user
Landlord: Premier Packaging
2
3
Location: 350 Hilton Drive
Square feet: 561,600
Tenant(s): None
Landlord: Exeter
3
4
Address: Logistics Avenue
Square feet: 469,000
Tenant(s): Owner-user
Landlord: Niagara Bottling
4
© 2019 Jones Lang LaSalle IP, Inc. All rights reserved. All information contained herein is from sources deemed reliable; however, no representation or warranty is made to the accuracy thereof.
© 2017 Jones Lang LaSalle IP, Inc. All rights reserved. All information contained herein is from sources deemed reliable; however, no representation or warranty is made to the accuracy thereof.
22%
15%
13%12%
11%
10%
7%
Trade, Transportation & Utilities
Educational & Health Services
Professional & Business Services
Manufacturing
Government
Leisure & Hospitality
Financial Activities
Mining, Logging & Construction
Other Services
Information
Q1 2019
Employment
Louisville Industrial Outlook
3.8%U.S. unemployment
1.7%U.S. 12-month job growth
4.0%Louisville unemployment
1.0%Louisville 12-month job growth
4.1%Kentucky unemployment
1.1%Kentucky 12-month job growth
-3.0
2.0
7.0
12.0
17.0
22.0
2014 2015 2016 2017 2018
Trade, Transportation & Utilities Manufacturing
Other Services Mining Logging & Construction
0%
4%
8%
12%
400,000
500,000
600,000
700,000
800,000
2014 2015 2016 2017 2018 2019
Employment Unemployment
Employment vs. unemployment rate
Employment by industry
Job growth (12-month change)
-2,600
-2,200
-500
-400
100
600
900
2,100
2,600
6,300
-4,500 -2,500 -500 1,500 3,500 5,500 7,500
Leisure & Hospitality
Other Services
Financial Activities
Information
Professional & Business…
Government
Trade, Transportation & Utilities
Manufacturing
Mining, Logging & Construction
Educational & Health Services
Job growth*
Historical employment Job growth by sector*
Employment by industry Industrial employment*
* Represents 12-month change in employment. All charts represent the latest economic data available from the Bureau of Labor Statistics as of September 2018.
© 2019 Jones Lang LaSalle IP, Inc. All rights reserved. All information contained herein is from sources deemed reliable; however, no representation or warranty is made to the accuracy thereof.
-1.0%
-0.3%
0.4%
1.1%
1.8%
2.5%
3.2%
3.9%
2015 2016 2017 2018
Louisville U.S.
Andrew Batson
Vice President, Director of Research
+1 216 937 4374
andrew.batson@am.jll.com
Alex Westcott
Research Analyst
+1 502 394 2504
alex.westcott@am.jll.com
About JLL
JLL (NYSE: JLL) is a leading professional services firm that
specializes in real estate and investment management. Our vision
is to reimagine the world of real estate, creating rewarding
opportunities and amazing spaces where people can achieve
their ambitions. In doing so, we will build a better tomorrow for
our clients, our people and our communities. JLL is a Fortune 500
company with annual revenue of $16.3 billion, operations in over
80 countries and a global workforce of over 90,000 as of
December 31, 2018. JLL is the brand name, and a registered
trademark, of Jones Lang LaSalle Incorporated. For further
information, visit jll.com
About JLL Research
JLL’s research team delivers intelligence, analysis and insight
through market-leading reports and services that illuminate
today’s commercial real estate dynamics and identify tomorrow’s
challenges and opportunities. Our more than 400 global research
professionals track and analyze economic and property trends
and forecast future conditions in over 60 countries, producing
unrivalled local and global perspectives. Our research and
expertise, fueled by real-time information and innovative thinking
around the world, creates a competitive advantage for our clients
and drives successful strategies and optimal real estate
decisions.
© 2018 Jones Lang LaSalle IP, Inc. All rights reserved. All information contained herein is from sources deemed reliable; however, no representation or warranty is made to the accuracy thereof.

More Related Content

What's hot

JLL Louisville Industrial Outlook - Q3 2018
JLL Louisville Industrial Outlook - Q3 2018JLL Louisville Industrial Outlook - Q3 2018
JLL Louisville Industrial Outlook - Q3 2018Alex Westcott
 
JLL Louisville Industrial Outlook - Q2 2021
JLL Louisville Industrial Outlook - Q2 2021 JLL Louisville Industrial Outlook - Q2 2021
JLL Louisville Industrial Outlook - Q2 2021 Alex Westcott
 
Q4 2019 | Austin Office | Research & Forecast Report
Q4 2019 | Austin Office | Research & Forecast ReportQ4 2019 | Austin Office | Research & Forecast Report
Q4 2019 | Austin Office | Research & Forecast ReportColliers International | Houston
 
JLL Louisville Industrial Outlook - Q2 2019
JLL Louisville Industrial Outlook - Q2 2019JLL Louisville Industrial Outlook - Q2 2019
JLL Louisville Industrial Outlook - Q2 2019Alex Westcott
 
JLL Cleveland Office Outlook: Q1 2018
JLL Cleveland Office Outlook: Q1 2018JLL Cleveland Office Outlook: Q1 2018
JLL Cleveland Office Outlook: Q1 2018Andrew Batson
 
JLL Cleveland Office Outlook: Q1 2018
JLL Cleveland Office Outlook: Q1 2018JLL Cleveland Office Outlook: Q1 2018
JLL Cleveland Office Outlook: Q1 2018Andrew Batson
 
JLL Louisville Industrial Outlook - Q1 2018
JLL Louisville Industrial Outlook - Q1 2018 JLL Louisville Industrial Outlook - Q1 2018
JLL Louisville Industrial Outlook - Q1 2018 Alex Westcott
 
JLL Louisville Industrial Outlook Q3 2017
JLL Louisville Industrial Outlook  Q3 2017 JLL Louisville Industrial Outlook  Q3 2017
JLL Louisville Industrial Outlook Q3 2017 Ross Bratcher
 
Jll cincinnati office outlook q2 2017
Jll cincinnati office outlook   q2 2017Jll cincinnati office outlook   q2 2017
Jll cincinnati office outlook q2 2017Abby Armbruster
 
Q1 2019 | Austin Office | Research & Forecast Report
Q1 2019 | Austin Office | Research & Forecast ReportQ1 2019 | Austin Office | Research & Forecast Report
Q1 2019 | Austin Office | Research & Forecast ReportColliers International | Houston
 
Q2 2017: Columbus Industrial Trends 2017
Q2 2017: Columbus Industrial Trends 2017Q2 2017: Columbus Industrial Trends 2017
Q2 2017: Columbus Industrial Trends 2017Kyle Ghiloni
 
Jll cincinnati office outlook q1 2017
Jll cincinnati office outlook   q1 2017Jll cincinnati office outlook   q1 2017
Jll cincinnati office outlook q1 2017Abby Armbruster
 
JLL Cleveland Office Outlook: Q4 2018
JLL Cleveland Office Outlook: Q4 2018JLL Cleveland Office Outlook: Q4 2018
JLL Cleveland Office Outlook: Q4 2018Andrew Batson
 
JLL Louisville Industrial Outlook - Q1 2017
JLL Louisville Industrial Outlook - Q1 2017 JLL Louisville Industrial Outlook - Q1 2017
JLL Louisville Industrial Outlook - Q1 2017 Ross Bratcher
 
JLL Cleveland Office Outlook: Q1 2018
JLL Cleveland Office Outlook: Q1 2018JLL Cleveland Office Outlook: Q1 2018
JLL Cleveland Office Outlook: Q1 2018Andrew Batson
 
Q1 2019 | Houston Office | Research & Forecast Report
Q1 2019 | Houston Office | Research & Forecast ReportQ1 2019 | Houston Office | Research & Forecast Report
Q1 2019 | Houston Office | Research & Forecast ReportColliers International | Houston
 
JLL Louisville Office Outlook - Q2 2018
JLL Louisville Office Outlook - Q2 2018JLL Louisville Office Outlook - Q2 2018
JLL Louisville Office Outlook - Q2 2018Alex Westcott
 
Jll memphis industrial review q1 2017
Jll memphis industrial review q1 2017Jll memphis industrial review q1 2017
Jll memphis industrial review q1 2017Hensley Loeb
 

What's hot (20)

JLL Louisville Industrial Outlook - Q3 2018
JLL Louisville Industrial Outlook - Q3 2018JLL Louisville Industrial Outlook - Q3 2018
JLL Louisville Industrial Outlook - Q3 2018
 
JLL Louisville Industrial Outlook - Q2 2021
JLL Louisville Industrial Outlook - Q2 2021 JLL Louisville Industrial Outlook - Q2 2021
JLL Louisville Industrial Outlook - Q2 2021
 
Q4 2019 | Austin Office | Research & Forecast Report
Q4 2019 | Austin Office | Research & Forecast ReportQ4 2019 | Austin Office | Research & Forecast Report
Q4 2019 | Austin Office | Research & Forecast Report
 
JLL Louisville Industrial Outlook - Q2 2019
JLL Louisville Industrial Outlook - Q2 2019JLL Louisville Industrial Outlook - Q2 2019
JLL Louisville Industrial Outlook - Q2 2019
 
JLL Cleveland Office Outlook: Q1 2018
JLL Cleveland Office Outlook: Q1 2018JLL Cleveland Office Outlook: Q1 2018
JLL Cleveland Office Outlook: Q1 2018
 
JLL Cleveland Office Outlook: Q1 2018
JLL Cleveland Office Outlook: Q1 2018JLL Cleveland Office Outlook: Q1 2018
JLL Cleveland Office Outlook: Q1 2018
 
JLL Louisville Industrial Outlook - Q1 2018
JLL Louisville Industrial Outlook - Q1 2018 JLL Louisville Industrial Outlook - Q1 2018
JLL Louisville Industrial Outlook - Q1 2018
 
JLL Louisville Industrial Outlook Q3 2017
JLL Louisville Industrial Outlook  Q3 2017 JLL Louisville Industrial Outlook  Q3 2017
JLL Louisville Industrial Outlook Q3 2017
 
Q3 2012 Houston Office Market Research Report
Q3 2012 Houston Office Market Research ReportQ3 2012 Houston Office Market Research Report
Q3 2012 Houston Office Market Research Report
 
Jll cincinnati office outlook q2 2017
Jll cincinnati office outlook   q2 2017Jll cincinnati office outlook   q2 2017
Jll cincinnati office outlook q2 2017
 
Q1 2019 | Austin Office | Research & Forecast Report
Q1 2019 | Austin Office | Research & Forecast ReportQ1 2019 | Austin Office | Research & Forecast Report
Q1 2019 | Austin Office | Research & Forecast Report
 
Q2 2017: Columbus Industrial Trends 2017
Q2 2017: Columbus Industrial Trends 2017Q2 2017: Columbus Industrial Trends 2017
Q2 2017: Columbus Industrial Trends 2017
 
Jll cincinnati office outlook q1 2017
Jll cincinnati office outlook   q1 2017Jll cincinnati office outlook   q1 2017
Jll cincinnati office outlook q1 2017
 
Q1 2014 Houston Office Market Research Report
Q1 2014 Houston Office Market Research ReportQ1 2014 Houston Office Market Research Report
Q1 2014 Houston Office Market Research Report
 
JLL Cleveland Office Outlook: Q4 2018
JLL Cleveland Office Outlook: Q4 2018JLL Cleveland Office Outlook: Q4 2018
JLL Cleveland Office Outlook: Q4 2018
 
JLL Louisville Industrial Outlook - Q1 2017
JLL Louisville Industrial Outlook - Q1 2017 JLL Louisville Industrial Outlook - Q1 2017
JLL Louisville Industrial Outlook - Q1 2017
 
JLL Cleveland Office Outlook: Q1 2018
JLL Cleveland Office Outlook: Q1 2018JLL Cleveland Office Outlook: Q1 2018
JLL Cleveland Office Outlook: Q1 2018
 
Q1 2019 | Houston Office | Research & Forecast Report
Q1 2019 | Houston Office | Research & Forecast ReportQ1 2019 | Houston Office | Research & Forecast Report
Q1 2019 | Houston Office | Research & Forecast Report
 
JLL Louisville Office Outlook - Q2 2018
JLL Louisville Office Outlook - Q2 2018JLL Louisville Office Outlook - Q2 2018
JLL Louisville Office Outlook - Q2 2018
 
Jll memphis industrial review q1 2017
Jll memphis industrial review q1 2017Jll memphis industrial review q1 2017
Jll memphis industrial review q1 2017
 

Similar to JLL Louisville Industrial Outlook - Q1 2019

JLL Louisville Industrial Outlook - Q4 2018
JLL Louisville Industrial Outlook - Q4 2018JLL Louisville Industrial Outlook - Q4 2018
JLL Louisville Industrial Outlook - Q4 2018Alex Westcott
 
JLL Louisville Industrial Outlook Q4 - 2018
JLL Louisville Industrial Outlook Q4 - 2018JLL Louisville Industrial Outlook Q4 - 2018
JLL Louisville Industrial Outlook Q4 - 2018Alex Westcott
 
JLL Louisville Industrial Outlook - Q2 2018
JLL Louisville Industrial Outlook - Q2 2018JLL Louisville Industrial Outlook - Q2 2018
JLL Louisville Industrial Outlook - Q2 2018Alex Westcott
 
Q3 2020 | Austin Industrial | Research & Forecast Report
Q3 2020 | Austin Industrial | Research & Forecast ReportQ3 2020 | Austin Industrial | Research & Forecast Report
Q3 2020 | Austin Industrial | Research & Forecast ReportColliers International | Houston
 
JLL Louisville Industrial Outlook - Q3 2016
JLL Louisville Industrial Outlook - Q3 2016JLL Louisville Industrial Outlook - Q3 2016
JLL Louisville Industrial Outlook - Q3 2016Ross Bratcher
 
JLL Columbus Industrial Outlook: Q1 2017
JLL Columbus Industrial Outlook: Q1 2017JLL Columbus Industrial Outlook: Q1 2017
JLL Columbus Industrial Outlook: Q1 2017Andrew Batson
 
Jll nashville industrial review q2 2017
Jll nashville industrial review q2 2017Jll nashville industrial review q2 2017
Jll nashville industrial review q2 2017Hensley Loeb
 
Q2 2018 | Houston Industrial | Research & Forecast Report
Q2 2018 | Houston Industrial | Research & Forecast ReportQ2 2018 | Houston Industrial | Research & Forecast Report
Q2 2018 | Houston Industrial | Research & Forecast ReportColliers International | Houston
 
JLL Houston Industrial Report Q4
JLL Houston Industrial Report Q4JLL Houston Industrial Report Q4
JLL Houston Industrial Report Q4Rebecca Moraitakis
 
JLL Houston Industrial Report Q4
JLL Houston Industrial Report Q4JLL Houston Industrial Report Q4
JLL Houston Industrial Report Q4Rebecca Moraitakis
 
JLL Q4 Houston Industrial Insight
JLL Q4 Houston Industrial InsightJLL Q4 Houston Industrial Insight
JLL Q4 Houston Industrial InsightDavidDominy1
 
@JLL Q4 Houston Industrial Insight & Statistics
@JLL Q4 Houston Industrial Insight & Statistics@JLL Q4 Houston Industrial Insight & Statistics
@JLL Q4 Houston Industrial Insight & StatisticsDavidDominy1
 
Q2 2019 | Austin Industrial | Research & Forecast Report
Q2 2019 | Austin Industrial | Research & Forecast ReportQ2 2019 | Austin Industrial | Research & Forecast Report
Q2 2019 | Austin Industrial | Research & Forecast ReportColliers International | Houston
 
JLL Louisville Office Outlook - Q2 2019
JLL Louisville Office Outlook - Q2 2019JLL Louisville Office Outlook - Q2 2019
JLL Louisville Office Outlook - Q2 2019Alex Westcott
 
JLL Cleveland Office Outlook: Q4 2017
JLL Cleveland Office Outlook: Q4 2017JLL Cleveland Office Outlook: Q4 2017
JLL Cleveland Office Outlook: Q4 2017Andrew Batson
 
Jll cincinnati industrial outlook q1 2017
Jll cincinnati industrial outlook   q1 2017Jll cincinnati industrial outlook   q1 2017
Jll cincinnati industrial outlook q1 2017Abby Armbruster
 
Q1 2018 | Houston Industrial | Research & Forecast Report
Q1 2018 | Houston Industrial | Research & Forecast ReportQ1 2018 | Houston Industrial | Research & Forecast Report
Q1 2018 | Houston Industrial | Research & Forecast ReportColliers International | Houston
 
Q3 2017 | Houston Industrial | Research & Forecast Report
Q3 2017 | Houston Industrial | Research & Forecast ReportQ3 2017 | Houston Industrial | Research & Forecast Report
Q3 2017 | Houston Industrial | Research & Forecast ReportColliers International | Houston
 
JLL Cleveland Office Outlook: Q3 2017
JLL Cleveland Office Outlook: Q3 2017JLL Cleveland Office Outlook: Q3 2017
JLL Cleveland Office Outlook: Q3 2017Andrew Batson
 

Similar to JLL Louisville Industrial Outlook - Q1 2019 (20)

JLL Louisville Industrial Outlook - Q4 2018
JLL Louisville Industrial Outlook - Q4 2018JLL Louisville Industrial Outlook - Q4 2018
JLL Louisville Industrial Outlook - Q4 2018
 
JLL Louisville Industrial Outlook Q4 - 2018
JLL Louisville Industrial Outlook Q4 - 2018JLL Louisville Industrial Outlook Q4 - 2018
JLL Louisville Industrial Outlook Q4 - 2018
 
JLL Louisville Industrial Outlook - Q2 2018
JLL Louisville Industrial Outlook - Q2 2018JLL Louisville Industrial Outlook - Q2 2018
JLL Louisville Industrial Outlook - Q2 2018
 
Q3 2020 | Austin Industrial | Research & Forecast Report
Q3 2020 | Austin Industrial | Research & Forecast ReportQ3 2020 | Austin Industrial | Research & Forecast Report
Q3 2020 | Austin Industrial | Research & Forecast Report
 
JLL Louisville Industrial Outlook - Q3 2016
JLL Louisville Industrial Outlook - Q3 2016JLL Louisville Industrial Outlook - Q3 2016
JLL Louisville Industrial Outlook - Q3 2016
 
JLL Columbus Industrial Outlook: Q1 2017
JLL Columbus Industrial Outlook: Q1 2017JLL Columbus Industrial Outlook: Q1 2017
JLL Columbus Industrial Outlook: Q1 2017
 
Houston industrial report suite q1 2018
Houston industrial report suite q1 2018Houston industrial report suite q1 2018
Houston industrial report suite q1 2018
 
Jll nashville industrial review q2 2017
Jll nashville industrial review q2 2017Jll nashville industrial review q2 2017
Jll nashville industrial review q2 2017
 
Q2 2018 | Houston Industrial | Research & Forecast Report
Q2 2018 | Houston Industrial | Research & Forecast ReportQ2 2018 | Houston Industrial | Research & Forecast Report
Q2 2018 | Houston Industrial | Research & Forecast Report
 
JLL Houston Industrial Report Q4
JLL Houston Industrial Report Q4JLL Houston Industrial Report Q4
JLL Houston Industrial Report Q4
 
JLL Houston Industrial Report Q4
JLL Houston Industrial Report Q4JLL Houston Industrial Report Q4
JLL Houston Industrial Report Q4
 
JLL Q4 Houston Industrial Insight
JLL Q4 Houston Industrial InsightJLL Q4 Houston Industrial Insight
JLL Q4 Houston Industrial Insight
 
@JLL Q4 Houston Industrial Insight & Statistics
@JLL Q4 Houston Industrial Insight & Statistics@JLL Q4 Houston Industrial Insight & Statistics
@JLL Q4 Houston Industrial Insight & Statistics
 
Q2 2019 | Austin Industrial | Research & Forecast Report
Q2 2019 | Austin Industrial | Research & Forecast ReportQ2 2019 | Austin Industrial | Research & Forecast Report
Q2 2019 | Austin Industrial | Research & Forecast Report
 
JLL Louisville Office Outlook - Q2 2019
JLL Louisville Office Outlook - Q2 2019JLL Louisville Office Outlook - Q2 2019
JLL Louisville Office Outlook - Q2 2019
 
JLL Cleveland Office Outlook: Q4 2017
JLL Cleveland Office Outlook: Q4 2017JLL Cleveland Office Outlook: Q4 2017
JLL Cleveland Office Outlook: Q4 2017
 
Jll cincinnati industrial outlook q1 2017
Jll cincinnati industrial outlook   q1 2017Jll cincinnati industrial outlook   q1 2017
Jll cincinnati industrial outlook q1 2017
 
Q1 2018 | Houston Industrial | Research & Forecast Report
Q1 2018 | Houston Industrial | Research & Forecast ReportQ1 2018 | Houston Industrial | Research & Forecast Report
Q1 2018 | Houston Industrial | Research & Forecast Report
 
Q3 2017 | Houston Industrial | Research & Forecast Report
Q3 2017 | Houston Industrial | Research & Forecast ReportQ3 2017 | Houston Industrial | Research & Forecast Report
Q3 2017 | Houston Industrial | Research & Forecast Report
 
JLL Cleveland Office Outlook: Q3 2017
JLL Cleveland Office Outlook: Q3 2017JLL Cleveland Office Outlook: Q3 2017
JLL Cleveland Office Outlook: Q3 2017
 

More from Alex Westcott

Jll Louisville Industrial Outlook - Q1 2021
Jll Louisville Industrial Outlook - Q1 2021Jll Louisville Industrial Outlook - Q1 2021
Jll Louisville Industrial Outlook - Q1 2021Alex Westcott
 
JLL Louisville Office Outlook - Q4 2020
JLL Louisville Office Outlook - Q4 2020JLL Louisville Office Outlook - Q4 2020
JLL Louisville Office Outlook - Q4 2020Alex Westcott
 
JLL Louisville Industrial Outlook - Q4 2020
JLL Louisville Industrial Outlook - Q4 2020JLL Louisville Industrial Outlook - Q4 2020
JLL Louisville Industrial Outlook - Q4 2020Alex Westcott
 
JLL Louisville Industrial Outlook - Q2 2020
JLL Louisville Industrial Outlook - Q2 2020JLL Louisville Industrial Outlook - Q2 2020
JLL Louisville Industrial Outlook - Q2 2020Alex Westcott
 
JLL Louisville Office Outlook - Q4 2019
JLL Louisville Office Outlook - Q4 2019JLL Louisville Office Outlook - Q4 2019
JLL Louisville Office Outlook - Q4 2019Alex Westcott
 
JLL Louisville Office Outlook - Q3 2019
JLL Louisville Office Outlook - Q3 2019JLL Louisville Office Outlook - Q3 2019
JLL Louisville Office Outlook - Q3 2019Alex Westcott
 
JLL Louisville Office Outlook - Q1 2019
JLL Louisville Office Outlook - Q1 2019JLL Louisville Office Outlook - Q1 2019
JLL Louisville Office Outlook - Q1 2019Alex Westcott
 
JLL Louisville Office Outlook - Q4 2018
JLL Louisville Office Outlook - Q4 2018JLL Louisville Office Outlook - Q4 2018
JLL Louisville Office Outlook - Q4 2018Alex Westcott
 
JLL Louisville Office Outlook - Q3 2018
JLL Louisville Office Outlook - Q3 2018JLL Louisville Office Outlook - Q3 2018
JLL Louisville Office Outlook - Q3 2018Alex Westcott
 
JLL Louisville Office Outlook Q4 2017
JLL Louisville Office Outlook Q4 2017JLL Louisville Office Outlook Q4 2017
JLL Louisville Office Outlook Q4 2017Alex Westcott
 

More from Alex Westcott (10)

Jll Louisville Industrial Outlook - Q1 2021
Jll Louisville Industrial Outlook - Q1 2021Jll Louisville Industrial Outlook - Q1 2021
Jll Louisville Industrial Outlook - Q1 2021
 
JLL Louisville Office Outlook - Q4 2020
JLL Louisville Office Outlook - Q4 2020JLL Louisville Office Outlook - Q4 2020
JLL Louisville Office Outlook - Q4 2020
 
JLL Louisville Industrial Outlook - Q4 2020
JLL Louisville Industrial Outlook - Q4 2020JLL Louisville Industrial Outlook - Q4 2020
JLL Louisville Industrial Outlook - Q4 2020
 
JLL Louisville Industrial Outlook - Q2 2020
JLL Louisville Industrial Outlook - Q2 2020JLL Louisville Industrial Outlook - Q2 2020
JLL Louisville Industrial Outlook - Q2 2020
 
JLL Louisville Office Outlook - Q4 2019
JLL Louisville Office Outlook - Q4 2019JLL Louisville Office Outlook - Q4 2019
JLL Louisville Office Outlook - Q4 2019
 
JLL Louisville Office Outlook - Q3 2019
JLL Louisville Office Outlook - Q3 2019JLL Louisville Office Outlook - Q3 2019
JLL Louisville Office Outlook - Q3 2019
 
JLL Louisville Office Outlook - Q1 2019
JLL Louisville Office Outlook - Q1 2019JLL Louisville Office Outlook - Q1 2019
JLL Louisville Office Outlook - Q1 2019
 
JLL Louisville Office Outlook - Q4 2018
JLL Louisville Office Outlook - Q4 2018JLL Louisville Office Outlook - Q4 2018
JLL Louisville Office Outlook - Q4 2018
 
JLL Louisville Office Outlook - Q3 2018
JLL Louisville Office Outlook - Q3 2018JLL Louisville Office Outlook - Q3 2018
JLL Louisville Office Outlook - Q3 2018
 
JLL Louisville Office Outlook Q4 2017
JLL Louisville Office Outlook Q4 2017JLL Louisville Office Outlook Q4 2017
JLL Louisville Office Outlook Q4 2017
 

Recently uploaded

Listing Turkey Sylvana Istanbul - Bahcesehir
Listing Turkey Sylvana Istanbul - BahcesehirListing Turkey Sylvana Istanbul - Bahcesehir
Listing Turkey Sylvana Istanbul - BahcesehirListing Turkey
 
The Omaxe State Dwarka Delhi-broucher.pdf.pdf
The Omaxe State Dwarka Delhi-broucher.pdf.pdfThe Omaxe State Dwarka Delhi-broucher.pdf.pdf
The Omaxe State Dwarka Delhi-broucher.pdf.pdfkratirudram
 
Model Call Girl in Shastri Nagar Delhi reach out to us at 🔝8264348440🔝
Model Call Girl in Shastri Nagar Delhi reach out to us at 🔝8264348440🔝Model Call Girl in Shastri Nagar Delhi reach out to us at 🔝8264348440🔝
Model Call Girl in Shastri Nagar Delhi reach out to us at 🔝8264348440🔝soniya singh
 
9711199012 Call {Girls Delhi} Very Low rate Vaishali DownLoad PDF
9711199012 Call {Girls Delhi} Very Low rate Vaishali DownLoad PDF9711199012 Call {Girls Delhi} Very Low rate Vaishali DownLoad PDF
9711199012 Call {Girls Delhi} Very Low rate Vaishali DownLoad PDFMs Riya
 
Call Girls in Khan Market 9654467111 ESCORTS SERVICE
Call Girls in Khan Market 9654467111 ESCORTS SERVICECall Girls in Khan Market 9654467111 ESCORTS SERVICE
Call Girls in Khan Market 9654467111 ESCORTS SERVICESapana Sha
 
Call Girls Janta Market {Delhi//8447779280)) ₹↬Short 2000 Full Night 5500 ↫Es...
Call Girls Janta Market {Delhi//8447779280)) ₹↬Short 2000 Full Night 5500 ↫Es...Call Girls Janta Market {Delhi//8447779280)) ₹↬Short 2000 Full Night 5500 ↫Es...
Call Girls Janta Market {Delhi//8447779280)) ₹↬Short 2000 Full Night 5500 ↫Es...asmaqueen5
 
Call Girls in Kashmiri Gate Delhi 💯Call Us 🔝8264348440🔝
Call Girls in Kashmiri Gate Delhi 💯Call Us 🔝8264348440🔝Call Girls in Kashmiri Gate Delhi 💯Call Us 🔝8264348440🔝
Call Girls in Kashmiri Gate Delhi 💯Call Us 🔝8264348440🔝soniya singh
 
Call Girls in laxmi Nagar Delhi 💯Call Us 🔝 9582086666🔝 South Delhi Escorts Se...
Call Girls in laxmi Nagar Delhi 💯Call Us 🔝 9582086666🔝 South Delhi Escorts Se...Call Girls in laxmi Nagar Delhi 💯Call Us 🔝 9582086666🔝 South Delhi Escorts Se...
Call Girls in laxmi Nagar Delhi 💯Call Us 🔝 9582086666🔝 South Delhi Escorts Se...delhimodel235
 
Rustomjee Cleon Bandra East, Mumbai - Brochure.pdf
Rustomjee Cleon Bandra East, Mumbai - Brochure.pdfRustomjee Cleon Bandra East, Mumbai - Brochure.pdf
Rustomjee Cleon Bandra East, Mumbai - Brochure.pdfmonikasharma630
 
9990771857 Call Girls in Noida Sector 06 Noida (Call Girls) Delhi
9990771857 Call Girls in Noida Sector 06 Noida (Call Girls) Delhi9990771857 Call Girls in Noida Sector 06 Noida (Call Girls) Delhi
9990771857 Call Girls in Noida Sector 06 Noida (Call Girls) Delhidelhimodel235
 
Raquel Thompson: Combining Creativity with Practicality in Architecture
Raquel Thompson: Combining  Creativity with Practicality in ArchitectureRaquel Thompson: Combining  Creativity with Practicality in Architecture
Raquel Thompson: Combining Creativity with Practicality in ArchitectureRaquel Thompson Barbados
 
Shapoorji Pallonji Parkwest Sequoia Tower Bangalore.pdf
Shapoorji Pallonji Parkwest Sequoia Tower Bangalore.pdfShapoorji Pallonji Parkwest Sequoia Tower Bangalore.pdf
Shapoorji Pallonji Parkwest Sequoia Tower Bangalore.pdfashiyadav24
 
How to Build Multifamily and Laneway Suites in Toronto!! (feat. Expert Archi...
How to Build Multifamily and Laneway Suites  in Toronto!! (feat. Expert Archi...How to Build Multifamily and Laneway Suites  in Toronto!! (feat. Expert Archi...
How to Build Multifamily and Laneway Suites in Toronto!! (feat. Expert Archi...Volition Properties
 
Call Girls In Hari Nagar Dadb Block {8447779280}Hari Nagar {West Delhi Escort...
Call Girls In Hari Nagar Dadb Block {8447779280}Hari Nagar {West Delhi Escort...Call Girls In Hari Nagar Dadb Block {8447779280}Hari Nagar {West Delhi Escort...
Call Girls In Hari Nagar Dadb Block {8447779280}Hari Nagar {West Delhi Escort...asmaqueen5
 
Call girls in Jeewan Park .Delhi↫8447779280↬ ꧂Escorts Service In Delhi Ncr
Call girls in Jeewan Park .Delhi↫8447779280↬ ꧂Escorts Service In Delhi NcrCall girls in Jeewan Park .Delhi↫8447779280↬ ꧂Escorts Service In Delhi Ncr
Call girls in Jeewan Park .Delhi↫8447779280↬ ꧂Escorts Service In Delhi Ncrasmaqueen5
 
Call Girls in Model Town Delhi 💯Call Us 🔝8264348440🔝
Call Girls in Model Town Delhi 💯Call Us 🔝8264348440🔝Call Girls in Model Town Delhi 💯Call Us 🔝8264348440🔝
Call Girls in Model Town Delhi 💯Call Us 🔝8264348440🔝soniya singh
 
Call Girls in Janakpuri ↫8447779280↫Short 1500 Night 6000-Escorts Service In ...
Call Girls in Janakpuri ↫8447779280↫Short 1500 Night 6000-Escorts Service In ...Call Girls in Janakpuri ↫8447779280↫Short 1500 Night 6000-Escorts Service In ...
Call Girls in Janakpuri ↫8447779280↫Short 1500 Night 6000-Escorts Service In ...asmaqueen5
 
Call Girls In Vasant Vihar Delhi 💯Call Us 🔝8264348440🔝
Call Girls In Vasant Vihar Delhi 💯Call Us 🔝8264348440🔝Call Girls In Vasant Vihar Delhi 💯Call Us 🔝8264348440🔝
Call Girls In Vasant Vihar Delhi 💯Call Us 🔝8264348440🔝soniya singh
 
Call Girls in Noida Sector 12 Noida 💯Call Us 🔝 9582086666 🔝 South Delhi Escor...
Call Girls in Noida Sector 12 Noida 💯Call Us 🔝 9582086666 🔝 South Delhi Escor...Call Girls in Noida Sector 12 Noida 💯Call Us 🔝 9582086666 🔝 South Delhi Escor...
Call Girls in Noida Sector 12 Noida 💯Call Us 🔝 9582086666 🔝 South Delhi Escor...delhimodel235
 

Recently uploaded (20)

Listing Turkey Sylvana Istanbul - Bahcesehir
Listing Turkey Sylvana Istanbul - BahcesehirListing Turkey Sylvana Istanbul - Bahcesehir
Listing Turkey Sylvana Istanbul - Bahcesehir
 
The Omaxe State Dwarka Delhi-broucher.pdf.pdf
The Omaxe State Dwarka Delhi-broucher.pdf.pdfThe Omaxe State Dwarka Delhi-broucher.pdf.pdf
The Omaxe State Dwarka Delhi-broucher.pdf.pdf
 
Model Call Girl in Shastri Nagar Delhi reach out to us at 🔝8264348440🔝
Model Call Girl in Shastri Nagar Delhi reach out to us at 🔝8264348440🔝Model Call Girl in Shastri Nagar Delhi reach out to us at 🔝8264348440🔝
Model Call Girl in Shastri Nagar Delhi reach out to us at 🔝8264348440🔝
 
9711199012 Call {Girls Delhi} Very Low rate Vaishali DownLoad PDF
9711199012 Call {Girls Delhi} Very Low rate Vaishali DownLoad PDF9711199012 Call {Girls Delhi} Very Low rate Vaishali DownLoad PDF
9711199012 Call {Girls Delhi} Very Low rate Vaishali DownLoad PDF
 
Call Girls in Khan Market 9654467111 ESCORTS SERVICE
Call Girls in Khan Market 9654467111 ESCORTS SERVICECall Girls in Khan Market 9654467111 ESCORTS SERVICE
Call Girls in Khan Market 9654467111 ESCORTS SERVICE
 
Call Girls Janta Market {Delhi//8447779280)) ₹↬Short 2000 Full Night 5500 ↫Es...
Call Girls Janta Market {Delhi//8447779280)) ₹↬Short 2000 Full Night 5500 ↫Es...Call Girls Janta Market {Delhi//8447779280)) ₹↬Short 2000 Full Night 5500 ↫Es...
Call Girls Janta Market {Delhi//8447779280)) ₹↬Short 2000 Full Night 5500 ↫Es...
 
Call Girls in Kashmiri Gate Delhi 💯Call Us 🔝8264348440🔝
Call Girls in Kashmiri Gate Delhi 💯Call Us 🔝8264348440🔝Call Girls in Kashmiri Gate Delhi 💯Call Us 🔝8264348440🔝
Call Girls in Kashmiri Gate Delhi 💯Call Us 🔝8264348440🔝
 
Call Girls in laxmi Nagar Delhi 💯Call Us 🔝 9582086666🔝 South Delhi Escorts Se...
Call Girls in laxmi Nagar Delhi 💯Call Us 🔝 9582086666🔝 South Delhi Escorts Se...Call Girls in laxmi Nagar Delhi 💯Call Us 🔝 9582086666🔝 South Delhi Escorts Se...
Call Girls in laxmi Nagar Delhi 💯Call Us 🔝 9582086666🔝 South Delhi Escorts Se...
 
Rustomjee Cleon Bandra East, Mumbai - Brochure.pdf
Rustomjee Cleon Bandra East, Mumbai - Brochure.pdfRustomjee Cleon Bandra East, Mumbai - Brochure.pdf
Rustomjee Cleon Bandra East, Mumbai - Brochure.pdf
 
9990771857 Call Girls in Noida Sector 06 Noida (Call Girls) Delhi
9990771857 Call Girls in Noida Sector 06 Noida (Call Girls) Delhi9990771857 Call Girls in Noida Sector 06 Noida (Call Girls) Delhi
9990771857 Call Girls in Noida Sector 06 Noida (Call Girls) Delhi
 
Raquel Thompson: Combining Creativity with Practicality in Architecture
Raquel Thompson: Combining  Creativity with Practicality in ArchitectureRaquel Thompson: Combining  Creativity with Practicality in Architecture
Raquel Thompson: Combining Creativity with Practicality in Architecture
 
Shapoorji Pallonji Parkwest Sequoia Tower Bangalore.pdf
Shapoorji Pallonji Parkwest Sequoia Tower Bangalore.pdfShapoorji Pallonji Parkwest Sequoia Tower Bangalore.pdf
Shapoorji Pallonji Parkwest Sequoia Tower Bangalore.pdf
 
How to Build Multifamily and Laneway Suites in Toronto!! (feat. Expert Archi...
How to Build Multifamily and Laneway Suites  in Toronto!! (feat. Expert Archi...How to Build Multifamily and Laneway Suites  in Toronto!! (feat. Expert Archi...
How to Build Multifamily and Laneway Suites in Toronto!! (feat. Expert Archi...
 
Call Girls In Hari Nagar Dadb Block {8447779280}Hari Nagar {West Delhi Escort...
Call Girls In Hari Nagar Dadb Block {8447779280}Hari Nagar {West Delhi Escort...Call Girls In Hari Nagar Dadb Block {8447779280}Hari Nagar {West Delhi Escort...
Call Girls In Hari Nagar Dadb Block {8447779280}Hari Nagar {West Delhi Escort...
 
Call girls in Jeewan Park .Delhi↫8447779280↬ ꧂Escorts Service In Delhi Ncr
Call girls in Jeewan Park .Delhi↫8447779280↬ ꧂Escorts Service In Delhi NcrCall girls in Jeewan Park .Delhi↫8447779280↬ ꧂Escorts Service In Delhi Ncr
Call girls in Jeewan Park .Delhi↫8447779280↬ ꧂Escorts Service In Delhi Ncr
 
Call Girls in Model Town Delhi 💯Call Us 🔝8264348440🔝
Call Girls in Model Town Delhi 💯Call Us 🔝8264348440🔝Call Girls in Model Town Delhi 💯Call Us 🔝8264348440🔝
Call Girls in Model Town Delhi 💯Call Us 🔝8264348440🔝
 
Call Girls in Janakpuri ↫8447779280↫Short 1500 Night 6000-Escorts Service In ...
Call Girls in Janakpuri ↫8447779280↫Short 1500 Night 6000-Escorts Service In ...Call Girls in Janakpuri ↫8447779280↫Short 1500 Night 6000-Escorts Service In ...
Call Girls in Janakpuri ↫8447779280↫Short 1500 Night 6000-Escorts Service In ...
 
Call Girls In Vasant Vihar Delhi 💯Call Us 🔝8264348440🔝
Call Girls In Vasant Vihar Delhi 💯Call Us 🔝8264348440🔝Call Girls In Vasant Vihar Delhi 💯Call Us 🔝8264348440🔝
Call Girls In Vasant Vihar Delhi 💯Call Us 🔝8264348440🔝
 
VIP Escorts in Delhi:🔝9953056974🔝 Hot Qutub Minar Delhi Escorts Service
VIP Escorts in Delhi:🔝9953056974🔝 Hot Qutub Minar Delhi Escorts ServiceVIP Escorts in Delhi:🔝9953056974🔝 Hot Qutub Minar Delhi Escorts Service
VIP Escorts in Delhi:🔝9953056974🔝 Hot Qutub Minar Delhi Escorts Service
 
Call Girls in Noida Sector 12 Noida 💯Call Us 🔝 9582086666 🔝 South Delhi Escor...
Call Girls in Noida Sector 12 Noida 💯Call Us 🔝 9582086666 🔝 South Delhi Escor...Call Girls in Noida Sector 12 Noida 💯Call Us 🔝 9582086666 🔝 South Delhi Escor...
Call Girls in Noida Sector 12 Noida 💯Call Us 🔝 9582086666 🔝 South Delhi Escor...
 

JLL Louisville Industrial Outlook - Q1 2019

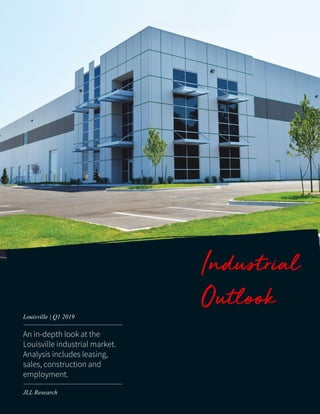
  • 1. Industrial Outlook An in-depth look at the Louisville industrial market. Analysis includes leasing, sales, construction and employment. Louisville | Q1 2019 JLL Research
  • 2. © 2017 Jones Lang LaSalle IP, Inc. All rights reserved. All information contained herein is from sources deemed reliable; however, no representation or warranty is made to the accuracy thereof. Q1 2019 Insight Louisville Industrial Outlook The year is off to a strong start as the pace of absorption in 2018 continued into 2019 with over 2.1 million square feet absorbed. Two buildings totaling nearly 868,000 square feet were leased in the Airport submarket. Ford leased the remaining 302,000 square feet of the building at 10301 Air Commerce Drive, after initially taking down 370,000 square feet last fall. Hydra made the largest lease of the quarter, taking the 505,000-square-foot Exeter building in River Ridge. As expected, speculative construction completions slowed significantly to start the year as development tapered off in mid- to-late 2018. However, announcements have picked back up with Browning planning a 925,000- squre-foot building in Bullitt County, Exeter planning a 561,600-square-foot building in Southern Indiana, and Main Street Realty planning a 331,000- square-foot building in the Airport submarket. This quarter was also active on the investor side with 3208 E. Blue Lick Road transferring to Dream Industrial REIT and 857 Park Loop Road transferring to Colony Capital. Both acquisitions were part of larger portfolio packages. Louisville remains a desirable location for institutional investors who have been priced out of larger markets, with several buildings currently under contract providing attractive returns for investors. Outlook The pace of absorption over the past 12-months has been historic for Louisville with over 7.0 million square feet leased. The surge in absorption has ignited interest in speculative development opportunities. Given the current availabilities and development announcements, there continues to be intriguing options for users evaluating the Louisville market. Fundamentals Forecast YTD net absorption 2,157,300 s.f. â–Ľ QTD net absorption 2,157,300 s.f. â–Ľ Under construction 3,470,640 s.f. â–Ľ Total vacancy 7.02 % â–Ľ Average asking rent (NNN) $3.95 p.s.f. â–˛ Tenant improvements Falling â–Ľ 0 4,000,000 8,000,000 2015 2016 2017 2018 2019 Supply and demand (s.f.) Net absorption Deliveries Absorption remains strong as vacancy continues to fall 5.7% 8.7% 11.7% 9.4% 7.0% 2015 2016 2017 2018 2019 Total vacancy $3.20 $3.40 $3.60 $3.80 $4.00 2014 2015 2016 2017 2018 2019 Average asking rents ($/s.f.) © 2019 Jones Lang LaSalle IP, Inc. All rights reserved. All information contained herein is from sources deemed reliable; however, no representation or warranty is made to the accuracy thereof. Top trends and activity • Dream Industrial REIT and Colony Capital entered the Louisville market in Bullitt County, as part of separate portfolio packages. • Two buildings totaling over 850,000 square feet in the Airport submarket were leased. • Modern bulk vacancy dipped to 7.02 percent, the lowest mark since 2015.
  • 3. © 2017 Jones Lang LaSalle IP, Inc. All rights reserved. All information contained herein is from sources deemed reliable; however, no representation or warranty is made to the accuracy thereof. Inventory (s.f.) YTD total net absorption (s.f.) YTD total net absorption (% of inventory) Total Vacancy (%) Average total asking rent ($ p.s.f.) YTD completions (s.f.) Under construction (s.f.) Airport 24,121,751 1,289,500 5.3% 3.6% $4.11 129,000 468,000 Bullitt County 13,647,026 0 0.0% 10.2% $4.09 0 572,000 East 5,850,720 0 0.0% 0.0% $5.95 0 150,040 Riverport 12,557,133 362,800 2.9% 9.2% $3.56 230,000 0 Southern Indiana 10,216,172 505,000 4.9% 12.2% $3.85 0 2,280,600 Louisville Totals 66,392,802 2,157,300 3.2% 7.2% $3.95 359,000 3,470,640 Analyzes all industrial buidings greater than 100,000 s.f. with a minimum clear height of 24' 2,234,648 1,934,181 2,059,001 2,742,889 3,029,702 3,843,783 2,568,298 5,710,124 2,157,300 0 1,000,000 2,000,000 3,000,000 4,000,000 5,000,000 6,000,000 2011 2012 2013 2014 2015 2016 2017 2018 Q1 2019 Q1 2019 Statistics Louisville Industrial Outlook 9.2% 8.3% 7.2% 6.6% 5.7% 8.7% 11.7% 9.4% 7.0% 2.0% 5.0% 8.0% 11.0% 14.0% 2011 2012 2013 2014 2015 2016 2017 2018 Q1 2019 © 2019 Jones Lang LaSalle IP, Inc. All rights reserved. All information contained herein is from sources deemed reliable; however, no representation or warranty is made to the accuracy thereof. Total Vacancy Rate % Total Net Absorption Inventory (s.f.) YTD total net absorption (s.f.) YTD total net absorption (% of inventory) Total Vacancy (%) Average total asking rent ($ p.s.f.) YTD completions (s.f.) Under construction (s.f.) Airport 24,121,751 1,289,500 5.3% 3.6% $4.11 129,000 468,000 Bullitt County 13,647,026 0 0.0% 10.2% $4.09 0 572,000 East 5,850,720 0 0.0% 0.0% $5.95 0 150,040 Riverport 12,557,133 362,800 2.9% 9.2% $3.56 230,000 0 Southern Indiana 10,216,172 505,000 4.9% 12.2% $3.85 0 2,280,600 Louisville Totals 66,392,802 2,157,300 3.2% 7.0% $3.95 359,000 3,470,640 Analyzes all industrial buidings greater than 100,000 s.f. with a minimum clear height of 24'
  • 4. © 2017 Jones Lang LaSalle IP, Inc. All rights reserved. All information contained herein is from sources deemed reliable; however, no representation or warranty is made to the accuracy thereof. $187,037,809 10 $68 5.75%-6.25% 98.5% 2.5% Top sales transactions last 12 months Size (s.f.) $ p.s.f. Sale date 2621 Technology Drive WPT Industrial REIT WPT Capital Advisors 224,000 $17,900,000 $80 Sep-18 120 Velocity Way Granite Capital Browning 721,000 $68 Dec-18 7251 Logistics Drive Paul & Eleanor Sade Trust Panattoni 356,000 $66 May-18 250 Hilton Drive GLP Van Trust 592,800 $38,400,000 $65 Apr-18 857 Park Loop Road* Colony Capital Dermody 546,000 $26,489,801 $47 Feb-19 Dream Industrial REIT Transwestern 302,500 $13,491,668 $45 Feb-19 1234 Gardiner Lane GSK Properties 162,000 $4,610,000 $28 Dec-18 Sales price $ 12 month sales volume $ by submarket $48,696,340 *Purchased as part of portfolio Dry Ridge Capital $23,500,000 3208 E. Blue Lick Road* Building address Buyer company Transactions details Seller company Average Class A sale price p.s.f. 12 month transaction volume at a glance Total volume Number of transactions Average Class A cap rate Sales activity by building type last 12 months Warehouse/Dist. sales volume as % of total Manufacturing sales volume as % of total Top sellers (s.f.)Top buyers (s.f.) $182,287,809 $4,750,000 0 s.f. 500,000 s.f. 1,000,000 s.f. 1,500,000 s.f. 2,000,000 s.f. 2,500,000 s.f. 3,000,000 s.f. 3,500,000 s.f. $0 $50,000,000 $100,000,000 $150,000,000 $200,000,000 Warehouse / Distribution Manufacturing Sum of Price ($) Sum of RBA (SF) 20% 16% 15%13% 10% 8% 6% Granite GLP Colony Capital Sazerac Paul & Eleanor Sade Trust Dream Industrial REIT WPT Industrial REIT GSK Properties Sperber Familly Trust Greif 20% 16% 15%13% 10% 8% 6% Browning Van Trust Dermody New Mill Capital Holdings Panattoni Transwestern WPT Capital Advisors Dry Ridge Capital Atalaya Investments Alemap $88,677,809 $43,150,000 $27,200,000 $17,900,000 $10,110,000 Bullitt County Southern Indiana Riverport East Airport Q1 2019 Sales Louisville Industrial Outlook This report analyzes all industrial sales > 75,000 s.f. year-to-date © 2019 Jones Lang LaSalle IP, Inc. All rights reserved. All information contained herein is from sources deemed reliable; however, no representation or warranty is made to the accuracy thereof. $187,037,809 10 $68 5.75%-6.25% 98.5% 2.5% Top sales transactions last 12 months Size (s.f.) $ p.s.f. Sale date 2621 Technology Drive WPT Industrial REIT WPT Capital Advisors 224,000 $17,900,000 $80 Sep-18 120 Velocity Way Granite Capital Browning 721,000 $68 Dec-18 7251 Logistics Drive Paul & Eleanor Sade Trust Panattoni 356,000 $66 May-18 250 Hilton Drive GLP Van Trust 592,800 $38,400,000 $65 Apr-18 857 Park Loop Road* Colony Capital Dermody 546,000 $26,489,801 $47 Feb-19 Dream Industrial REIT Transwestern 302,500 $13,491,668 $45 Feb-19 1234 Gardiner Lane GSK Properties 162,000 $4,610,000 $28 Dec-18 Sales price $ 12 month sales volume $ by submarket $48,696,340 *Purchased as part of portfolio Dry Ridge Capital $23,500,000 3208 E. Blue Lick Road* Building address Buyer company Transactions details Seller company Average Class A sale price p.s.f. 12 month transaction volume at a glance Total volume Number of transactions Average Class A cap rate Sales activity by building type last 12 months Warehouse/Dist. sales volume as % of total Manufacturing sales volume as % of total Top sellers (s.f.)Top buyers (s.f.) $182,287,809 $4,750,000 0 s.f. 500,000 s.f. 1,000,000 s.f. 1,500,000 s.f. 2,000,000 s.f. 2,500,000 s.f. 3,000,000 s.f. 3,500,000 s.f. $0 $50,000,000 $100,000,000 $150,000,000 $200,000,000 Warehouse / Distribution Manufacturing Sum of Price ($) Sum of RBA (SF) 20% 16% 15%13% 10% 8% 6% Granite GLP Colony Capital Sazerac Paul & Eleanor Sade Trust Dream Industrial REIT WPT Industrial REIT GSK Properties Sperber Familly Trust Greif 20% 16% 15%13% 10% 8% 6% Browning Van Trust Dermody New Mill Capital Holdings Panattoni Transwestern WPT Capital Advisors Dry Ridge Capital Atalaya Investments Alemap $88,677,809 $43,150,000 $27,200,000 $17,900,000 $10,110,000 Bullitt County Southern Indiana Riverport East Airport
  • 5. © 2017 Jones Lang LaSalle IP, Inc. All rights reserved. All information contained herein is from sources deemed reliable; however, no representation or warranty is made to the accuracy thereof. Total leased at delivery (%) 2.7% Total speculative at delivery (s.f.) 2,436,815 Total BTS at delivery (s.f.) 481,000 Total owner-user at delivery (s.f.) 1,300,000 Total # of properties delivered 11 Asking rental rate (low - high) $4.25 - $5.50 Largest projects delivered past 12 months Building/Address RBA (s.f.) Delivery date Leased at delivery (%) W.W. Grainger 1,300,000 Q3 2018 100% 10301 Air Commerce Drive 677,685 Q2 2018 0% 300 Hilton Drive 506,117 Q3 2018 0% 4500 Fern Valley Road 350,000 Q3 2018 0% 2349 E. Millers Lane 251,000 Q4 2018 100% 101 Lewman Way 250,000 Q4 2018 0% Total pre-leased (%) 25.0% Total speculative under construction (s.f.) 1,583,640 Total BTS under construction (s.f.) - Total Owner-user under construction (s.f.) 1,887,000 Total # of properties UC 8 Asking rental rate (low - high) $3.90 - $4.15 Largest projects currently under construction Building RBA (s.f.) Delivery date Pre-leased (%) Salt River Business Park 572,000 Q3 2019 0% Exeter River Ridge 561,600 Q4 2019 0% Logistics River Ridge 469,000 Q2 2019 100% Premier Packaging 318,000 Q2 2019 100% Eastpoint Business Center B 150,040 Q1 2019 21% Speculative Speculative Owner-user Submarket Under construction 3,470,640 Under construction (s.f.) Under construction in-depth Upcoming deliveries by year (s.f., excludes YTD completions) Southern Indiana Gray Speculative New and historical deliveries Completions in-depth 4,217,815 Total delivered past 12 months (s.f.) Construction typeOwnerSubmarket Airport Airport Southern Indiana Airport Airport Advance Distribution Services The Schroering Co. Exeter Property Group Molto W.W. Grainger BTS Speculative East Airport Southern Indiana Southern Indiana Bullitt County Speculative Owner-user Owner Construction type Owner-user Boland Premier Packaging Niagara Bottling Exeter Property Group Crossdock Dev. Speculative Speculative 0 1,000,000 2,000,000 3,000,000 4,000,000 5,000,000 6,000,000 7,000,000 2012 2013 2014 2015 2016 2017 2018 2019 0 500,000 1,000,000 1,500,000 2,000,000 2,500,000 3,000,000 3,500,000 4,000,000 2019 Owner-user Speculative Q1 2019 Construction Louisville Industrial Outlook This report analyzes all industrial developments under construction & new deliveries > 100,000 s.f. © 2019 Jones Lang LaSalle IP, Inc. All rights reserved. All information contained herein is from sources deemed reliable; however, no representation or warranty is made to the accuracy thereof.
  • 6. © 2017 Jones Lang LaSalle IP, Inc. All rights reserved. All information contained herein is from sources deemed reliable; however, no representation or warranty is made to the accuracy thereof. Q1 2019 Construction Louisville Industrial Outlook 1 Location: 100 Velocity Way Square feet: 925,000 Tenant(s): None Landlord: Browning 1 2 Address: 4301 Produce Road Square feet: 318,000 Tenant(s): Owner-user Landlord: Premier Packaging 2 3 Location: 350 Hilton Drive Square feet: 561,600 Tenant(s): None Landlord: Exeter 3 4 Address: Logistics Avenue Square feet: 469,000 Tenant(s): Owner-user Landlord: Niagara Bottling 4 © 2019 Jones Lang LaSalle IP, Inc. All rights reserved. All information contained herein is from sources deemed reliable; however, no representation or warranty is made to the accuracy thereof.
  • 7. © 2017 Jones Lang LaSalle IP, Inc. All rights reserved. All information contained herein is from sources deemed reliable; however, no representation or warranty is made to the accuracy thereof. 22% 15% 13%12% 11% 10% 7% Trade, Transportation & Utilities Educational & Health Services Professional & Business Services Manufacturing Government Leisure & Hospitality Financial Activities Mining, Logging & Construction Other Services Information Q1 2019 Employment Louisville Industrial Outlook 3.8%U.S. unemployment 1.7%U.S. 12-month job growth 4.0%Louisville unemployment 1.0%Louisville 12-month job growth 4.1%Kentucky unemployment 1.1%Kentucky 12-month job growth -3.0 2.0 7.0 12.0 17.0 22.0 2014 2015 2016 2017 2018 Trade, Transportation & Utilities Manufacturing Other Services Mining Logging & Construction 0% 4% 8% 12% 400,000 500,000 600,000 700,000 800,000 2014 2015 2016 2017 2018 2019 Employment Unemployment Employment vs. unemployment rate Employment by industry Job growth (12-month change) -2,600 -2,200 -500 -400 100 600 900 2,100 2,600 6,300 -4,500 -2,500 -500 1,500 3,500 5,500 7,500 Leisure & Hospitality Other Services Financial Activities Information Professional & Business… Government Trade, Transportation & Utilities Manufacturing Mining, Logging & Construction Educational & Health Services Job growth* Historical employment Job growth by sector* Employment by industry Industrial employment* * Represents 12-month change in employment. All charts represent the latest economic data available from the Bureau of Labor Statistics as of September 2018. © 2019 Jones Lang LaSalle IP, Inc. All rights reserved. All information contained herein is from sources deemed reliable; however, no representation or warranty is made to the accuracy thereof. -1.0% -0.3% 0.4% 1.1% 1.8% 2.5% 3.2% 3.9% 2015 2016 2017 2018 Louisville U.S.
  • 8. Andrew Batson Vice President, Director of Research +1 216 937 4374 andrew.batson@am.jll.com Alex Westcott Research Analyst +1 502 394 2504 alex.westcott@am.jll.com About JLL JLL (NYSE: JLL) is a leading professional services firm that specializes in real estate and investment management. Our vision is to reimagine the world of real estate, creating rewarding opportunities and amazing spaces where people can achieve their ambitions. In doing so, we will build a better tomorrow for our clients, our people and our communities. JLL is a Fortune 500 company with annual revenue of $16.3 billion, operations in over 80 countries and a global workforce of over 90,000 as of December 31, 2018. JLL is the brand name, and a registered trademark, of Jones Lang LaSalle Incorporated. For further information, visit jll.com About JLL Research JLL’s research team delivers intelligence, analysis and insight through market-leading reports and services that illuminate today’s commercial real estate dynamics and identify tomorrow’s challenges and opportunities. Our more than 400 global research professionals track and analyze economic and property trends and forecast future conditions in over 60 countries, producing unrivalled local and global perspectives. Our research and expertise, fueled by real-time information and innovative thinking around the world, creates a competitive advantage for our clients and drives successful strategies and optimal real estate decisions. © 2018 Jones Lang LaSalle IP, Inc. All rights reserved. All information contained herein is from sources deemed reliable; however, no representation or warranty is made to the accuracy thereof.