
Recommended
More Related Content
What's hot
What's hot (20)
Similar to Shelf life calculation of drugs
Similar to Shelf life calculation of drugs (20)
More from Bishnu Koirala
More from Bishnu Koirala (14)
Recently uploaded
Recently uploaded (20)
Shelf life calculation of drugs
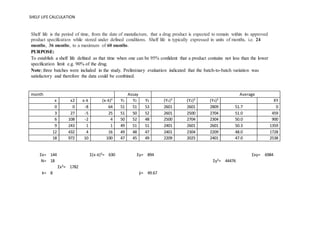
- 1. SHELF LIFE CALCULATION Shelf life is the period of time, from the date of manufacture, that a drug product is expected to remain within its approved product specification while stored under defined conditions. Shelf life is typically expressed in units of months, i.e. 24 months, 36 months, to a maximum of 60 months. PURPOSE: To establish a shelf life defined as that time when one can be 95% confident that a product contains not less than the lower specification limit e.g. 90% of the drug. Note; three batches were included in the study. Preliminary evaluation indicated that the batch-to-batch variation was satisfactory and therefore the data could be combined. month Assay Average x x2 x-x̄ (x-x̄)² Y1 Y2 Y3 (Y1)² (Y2)² (Y3)² XY 0 0 -8 64 51 51 53 2601 2601 2809 51.7 0 3 27 -5 25 51 50 52 2601 2500 2704 51.0 459 6 108 -2 4 50 52 48 2500 2704 2304 50.0 900 9 243 1 1 49 51 51 2401 2601 2601 50.3 1359 12 432 4 16 49 48 47 2401 2304 2209 48.0 1728 18 972 10 100 47 45 49 2209 2025 2401 47.0 2538 Ʃx= 144 Ʃ(x-x̄)²= 630 Ʃy= 894 Ʃxy= 6984 N= 18 Ʃy²= 44476 Ʃx²= 1782 x̄= 8 ӯ= 49.67
- 2. SHELF LIFE CALCULATION Y1 (y1-ӯ) (y1-ӯ)² Y2 (y2-ӯ) (y2-ӯ)² Y3 (y3-ӯ) (y3-ӯ)² 51 1.33 1.8 51 1.33 1.8 53 3.33 11.1 51 1.33 1.8 50 0.33 0.1 52 2.33 5.4 50 0.33 0.1 52 2.33 5.4 48 -1.67 2.8 49 -0.67 0.4 51 1.33 1.8 51 1.33 1.8 49 -0.67 0.4 48 -1.67 2.8 47 -2.67 7.1 47 -2.67 7.1 45 -4.67 21.8 49 -0.67 0.4 total= 11.7 total= 33.7 total= 28.6 Ʃ(y-ӯ)²= 74 i.examinationof the graphindicatesthatthe linearrelationshipwouldbe areasonable represntationof the data. ii.Inthis case one will assume thatthe concentrationandtime are trulylinearlyrelated,i.e: C= Co-Kx t Where:C= Concentrationattime t Co= Concentrationattime 0 k = rate constant t = time (storage time) iii. Estimationof the slope andinterceptof the leastsquares(regression) line: equations: ӯ= a + b x̄ a = y intercept b = slope C = Co - kt Hence k = -b or k = - slope
- 3. SHELF LIFE CALCULATION b= N x ƩXY -ƩXx Ʃy -3024 N x ƩX² - (ƩX)² 11340 b= -0.267 mg/month, k= 0.267 a= ӯ-b x x̄ a= 51.8 iv.The equationfora straightline bestfitis therefore: C = Co - k x t C=51.8 - 0.267 x t v. the variance estimate,S²xyrepresentsthe variabilityof tabletpotencyatafixedtime,assumingitisequivalentacross all time points. S²xy= [ƩY²-(ƩY)²/N]-[b²x Ʃ(x- x̄)²]/N-2 S²xy= 1.825 Sxy= 1.35 vi.To calculate the time at whichthe tabletpotencyis90% (45 mg) of the labeledamount,solve fortwhen C= 45 ,i.e.: t= (Co- C)/k t= 25.5 months., (X=25.5) X mean= 17.5
- 4. SHELF LIFE CALCULATION vii.Lower95% confidence interval of the meantime. since one isintrestedinbeing95%confidentthatat expirythe concentrationisnotlessthan45 mg (90%) confidence limit for meantime estimate confidence interval fortrue X(time) ata givenvalue forY. The lower95% confidence intervalis equal to: [(X-(gx x̄)]-[tx (Sxy)/bx √((1-g)/N+[(x-x̄)²/Ʃ(x-x̄)²]) (1-g) where g= t² x (Sxy) (b² x [Ʃ(x-x̄)²] vii.Forexample:Y=45 mg, X= 25.5 months; for one sidedconfidence interval : tN-2 = t16,0.975= 2.12 g= 0.183 (1-g)= 0.817 The lowerconfidence interval is: months= 19.8 REFERENCE: Operational Manual for Implementation of GMP (Asean Guidelines)