
Recommended
Recommended
More Related Content
What's hot
What's hot (16)
Similar to Indianapolis JLL Industrial Employment Update April 2015
Similar to Indianapolis JLL Industrial Employment Update April 2015 (20)
More from JLL_Midwest_Great_Lakes_Research
More from JLL_Midwest_Great_Lakes_Research (20)
Recently uploaded
Recently uploaded (20)
Indianapolis JLL Industrial Employment Update April 2015
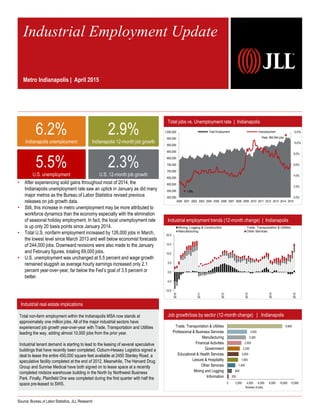
- 1. Industrial real estate implications Industrial employment trends (12-month change) | Indianapolis Source: Bureau of Labor Statistics, JLL Research Job growth/loss by sector (12-month change) | IndianapolisTotal non-farm employment within the Indianapolis MSA now stands at approximately one million jobs. All of the major industrial sectors have experienced job growth year-over-year with Trade, Transportation and Utilities leading the way, adding almost 10,000 jobs from the prior year. Industrial tenant demand is starting to lead to the leasing of several speculative buildings that have recently been completed. Ozburn-Hessey Logistics signed a deal to lease the entire 450,000 square feet available at 2450 Stanley Road, a speculative facility completed at the end of 2012. Meanwhile, The Harvard Drug Group and Sunrise Medical have both signed on to lease space at a recently completed midsize warehouse building in the North by Northwest Business Park. Finally, Plainfield One was completed during the first quarter with half the space pre-leased to SWS. Total jobs vs. Unemployment rate | Indianapolis 6.2% Indianapolis unemployment 2.9% Indianapolis 12-month job growth 5.5% U.S. unemployment 2.3% U.S. 12-month job growth Number of jobs • After experiencing solid gains throughout most of 2014, the Indianapolis unemployment rate saw an uptick in January as did many major metros as the Bureau of Labor Statistics revised previous releases on job growth data. • Still, this increase in metro unemployment may be more attributed to workforce dynamics than the economy especially with the elimination of seasonal holiday employment. In fact, the local unemployment rate is up only 20 basis points since January 2014. • Total U.S. nonfarm employment increased by 126,000 jobs in March, the lowest level since March 2013 and well below economist forecasts of 244,000 jobs. Downward revisions were also made to the January and February figures, totaling 69,000 jobs. • U.S. unemployment was unchanged at 5.5 percent and wage growth remained sluggish as average hourly earnings increased only 2.1 percent year-over-year, far below the Fed’s goal of 3.5 percent or better. Industrial Employment Update Metro Indianapolis | April 2015 0.0% 2.0% 4.0% 6.0% 8.0% 10.0% 12.0% 500,000 550,000 600,000 650,000 700,000 750,000 800,000 850,000 900,000 950,000 1,000,000 2000 2001 2002 2003 2004 2005 2006 2007 2008 2009 2010 2011 2012 2013 2014 2015 Total Employment Unemployment 1.8% Peak: 960,944 jobs -10.0 -5.0 0.0 5.0 10.0 15.0 20.0 2010 2011 2012 2013 2014 2015 Mining, Logging & Construction Trade, Transportation & Utilities Manufacturing Other Services 200 800 1,400 1,900 2,000 2,200 2,500 3,300 3,500 9,800 0 2,000 4,000 6,000 8,000 10,000 12,000 Information Mining and Logging Other Services Leisure & Hospitality Educational & Health Services Government Financial Activities Manufacturing Professional & Business Services Trade, Transportation & Utilities
- 2. © 2015 Jones Lang LaSalle IP, Inc. All rights reserved. All information contained herein is from sources deemed reliable; however, no representation or warranty is made to the accuracy thereof. January 2013 January 2014 January 2015 Total non-farm employment 943,700 1.9% 962,400 2.0% 990,000 2.9% Unemployment rate 8.8% 6.0% 6.2% Indianapolis supersectors January 2013 January 2014 January 2015 Mining, Logging & Construction 40,000 0.0% 40,200 0.5% 41,000 2.0% Manufacturing 87,100 2.4% 87,500 0.5% 90,800 3.8% Trade, Transportation, & Utilities 201,300 2.3% 205,700 2.2% 215,500 4.8% Information 16,400 3.8% 16,600 1.2% 16,800 1.2% Financial Activities 59,700 -0.5% 59,800 0.2% 62,300 4.2% Professional & Business Services 138,200 4.9% 148,200 7.2% 151,700 2.4% Educational & Health Services 141,200 2.2% 141,500 0.2% 143,500 1.4% Leisure & Hospitality 93,800 3.1% 93,800 0.0% 95,700 2.0% Other Services 41,100 2.5% 42,600 3.6% 44,000 3.3% Government 124,900 -1.9% 126,500 1.3% 128,700 1.7% News on the street | Indianapolis businesses expanding, contracting, etc. Employment statistics | Indianapolis Industry employment stratification | Indianapolis OMR North America, Inc. │ Manufacturing: Expanding OMR North America, Inc., an auto parts manufacturer, plans to invest $15 million into a new facility located on the west side of Indianapolis in Speedway. As part of this investment, OMR intends to hire at least 60 employees. Opflex Technologies, LLC. │ Manufacturing: Relocating Opflex Technologies, LLC., a foam manufacturer, plans to invest $2 million to relocate operations from New York to Indiana. The Indianapolis location will be on the east side of the city in the Western Select industrial complex. Opflex plans to bring nearly 50 jobs to the Hoosier state over the next five years. Logical Concepts, Inc. │ Manufacturing: Expanding Logical Concepts, Inc., a wireless monitoring and control device manufacturer, recently unveiled plans to relocate from Greenwood to Indianapolis. Logical Concepts will purchase, renovate and equip a vacant 18,000 square-foot building on the south side of Indianapolis. The move will allow the company to add approximately 25 jobs by 2019. Logical Concepts currently employs 17 employees, all of which are expected to be part of the relocation process. Amazon.com, Inc. │ E-commerce: Expanding Amazon.com, Inc. (NASDAQ: AMZN) plans to fill as many as 700 full-time positions immediately at its AllPoints at Anson fulfillment center in Whitestown. The company, which currently operates multiple fulfillment centers around Indianapolis, needs to add workers in order to keep up with customer demand. Raytheon Company │ Manufacturing: Expanding Raytheon Company, a defense and aerospace manufacturer, will move roughly 250 positions to Indianapolis from plants in California and Virginia. Raytheon is consolidating operations into its East 21st Street plant in order to improve efficiency and competitiveness. B&B Manufacturing │ Manufacturing: Expanding B&B Manufacturing is expanding in La Porte, Indiana. The company will invest more than $5 million to build and equip an 80,000 square-foot facility to replace its current 30,000 square-foot facility. The new space will enable the company to expand its workforce from 70 employees to over 100 employees by 2024. B&B manufactures timing belt pulleys and roller chain sprockets among others. Vera Bradley │ Retailer: Contracting Fort Wayne-based Vera Bradley (NASDAQ: VRA) will close its New Haven, IN factory next month. The move will impact 250 employees as the jobs will be outsourced to facilities overseas. 200 East Randolph Street Chicago, IL 60601 +1 312 782 5800 8900 Keystone Crossing, Suite 1150 Indianapolis, IN 46240 www.jll.com/indianapolis For more information, please contact: Robert Kramp Senior Vice President – Americas Midwest Research Director tel +1 312 228 2470 Robert.Kramp@am.jll.com Mike Cagna Senior Research Analyst tel +1 317 810 7358 Mike.Cagna@am.jll.com Trade, transportation and Utilities, 215,500, 22% Professional and Business Services, 151,700, 15% Educational and Health Services, 143,500, 15% Government, 128,700, 13% Leisure and Hospitality, 95,700, 10% Manufacturing, 90,800, 9% Financial Activities, 62,300, 6% Other Services, 44,000, 4% Mining, Logging and construction, 41,000, 4% Information, 16,800, 2%