SlideShare a Scribd company logo
1 of 30
arXiv:astro-ph/0210128v15Oct2002
ApJ, in press: 25 September 2002
Our Sun. V. A Bright Young Sun Consistent with Helioseismology and Warm
Temperatures on Ancient Earth and Mars
I.-Juliana Sackmann1
and Arnold I. Boothroyd2
W. K. Kellogg Radiation Laboratory 106-38, California Institute of Technology,
Pasadena, CA 91125
ijs@caltech.edu
boothroy@cita.utoronto.ca
ABSTRACT
The relatively warm temperatures required on early Earth and Mars have been difficult to
account for via warming from greenhouse gases. We tested whether this problem can be resolved
for both Earth and Mars by a young Sun that is brighter than predicted by the standard solar
model (SSM). We computed high-precision solar evolutionary models with slightly increased
initial masses of Mi = 1.01 to 1.07 M⊙; for each mass, we considered three different mass loss
scenarios. We then tested whether these models were consistent with the current high-precision
helioseismic observations. The relatively modest mass loss rates in these models are consistent
with observational limits from young stars and estimates of the past solar wind obtained from
lunar rocks, and do not significantly affect the solar lithium depletion. For appropriate initial
masses, all three mass loss scenarios are capable of yielding a solar flux 3.8 Gyr ago high enough
to be consistent with water on ancient Mars. The higher flux at the planets is due partly to the
fact that a more massive young Sun would be intrinsically more luminous, and partly to the fact
that the planets would be closer to the more massive young Sun. At birth on the main sequence,
our preferred initial mass Mi = 1.07 M⊙ would produce a solar flux at the planets 50% higher
than that of the SSM, namely, a flux 5% higher than the present value (rather than 30% lower,
which the SSM predicts). At first (for 1 − 2 Gyr), the solar flux would decrease; subsequently, it
would behave more like the flux in the SSM, increasing until the present. We find that all of our
mass-losing solar models are consistent with the helioseismic observations; in fact, our preferred
mass-losing case with Mi = 1.07 M⊙ is in marginally (though insignificantly) better agreement
with the helioseismology than is the SSM. The early solar mass loss of a few percent does
indeed leave a small fingerprint on the Sun’s internal structure. However, for helioseismology
to significantly constrain early solar mass loss would require higher accuracy in the observed
solar parameters and input physics, namely, by a factor of ∼ 3 for the observed solar surface
composition, and a factor of ∼ 2 for the solar interior opacities, the pp nuclear reaction rate, and
the diffusion constants for gravitational settling.
Subject headings: Sun: evolution — Sun: helioseismology — Sun: solar-terrestrial relations —
Sun: solar wind — planets and satellites: individual (Earth, Mars)
1Present address: West Bridge Laboratory 103-33, California Institute of Technology, Pasadena, CA 91125
2Present address: CITA, U. of Toronto, 60 St. George Street, Toronto, Ontario, Canada M5S 3H8
– 2 –
1. Introduction
Observations indicate that the Earth was at least warm enough for liquid water to exist as far back as
4 Gyr ago, namely, as early as half a billion years after the formation of the Earth (Cogley & Henderson-
Sellers 1984; Mojzsis et al. 1996; Eiler, Mojzsis, & Arrhenius 1997; Eriksson 1982; Bowring, Williams, &
Compston 1989; Nutman et al. 1984); in fact, there is evidence suggesting that Earth may have been even
warmer then than it is now (Kasting 1989; Oberbeck, Marshall, & Aggarwal 1993; Woese 1987; Ohmotu &
Felder 1987; Knauth & Epstein 1976; Karhu & Epstein 1986). These relatively warm temperatures required
on early Earth are in apparent contradiction to the dimness of the early Sun predicted by the standard solar
models. This problem has generally been explained by assuming that Earth’s early atmosphere contained
huge amounts of carbon dioxide (CO2), resulting in a large enough greenhouse effect to counteract the
effect of a dimmer Sun. However, the recent work of Rye, Kuo, & Holland (1995) places an upper limit
of 0.04 bar on the partial pressure of CO2 in the period from 2.75 to 2.2 Gyr ago, based on the absence
of siderite in paleosols; this casts doubt on the viability of a strong CO2 greenhouse effect on early Earth.
The existence of liquid water on early Mars has been even more of a puzzle; even the maximum possible
CO2 greenhouse effect cannot yield warm enough Martian surface temperatures (Kasting 1991; Kasting,
Whitmire, & Reynolds 1993). These problems can simultaneously be resolved, for both Earth and Mars, if
the early Sun were brighter than predicted by the standard solar models. This could be accomplished if the
early Sun were slightly more massive than it is now.
Helioseismic observations provide revolutionary precision for probing the solar interior. Helioseismic
frequencies are observed with an accuracy of a few parts in 105
, allowing measurement of the sound speed
profile throughout most of the Sun’s interior to an accuracy of a few parts in 104
(Basu, Pinsonneault, &
Bahcall 2000). This high precision permits one to search for subtle effects in the interior structure of the
present Sun resulting from events in the distant past. In particular, modest mass loss (between 1% and 7% of
the Sun’s mass) early on the main sequence might have left enough of a fingerprint on the interior structure
of the present Sun to be detectable by helioseismological observations.
1.1. Limits On Early Solar Mass Loss
1.1.1. Theoretical Solar Models and Helioseismology
Willson, Bowen, & Struck-Marcel (1987) first presented the hypothesis that stars like the Sun might
lose significant amounts of mass on the early main sequence. Guzik, Willson, & Brunish (1987) were the first
to compute solar models with such early main sequence mass loss, namely, an extreme case with an initial
mass of 2 M⊙. Such extreme mass loss (of ∆M = 1 M⊙) turns out to be unrealistic, as discussed below; but
small mass loss cases cannot be ruled out at the present. Boothroyd, Sackmann, & Fowler (1991) considered
an initial solar mass of 1.1 M⊙, showing that this is the upper limit allowed by the observed solar lithium
depletion. Some work has been carried out recently attempting to use helioseismology to constrain early
solar mass loss (Guzik & Cox 1995; Morel, Provost, & Berthomieu 1997); however, the first of these used
rather crude solar interior models, and the second yielded ambiguous results, as we discuss in detail below.
Guzik & Cox (1995) were the first to attempt to use helioseismic observations to constrain early solar
mass loss; they considered initial solar masses of 1.1 and 2 M⊙, concluding that the 2 M⊙ could be ruled out
by helioseismic observations of low-degree modes. They also claimed that a mass loss timescale of 0.2 Gyr
was favored over a 0.45 Gyr timescale for the 1.1 M⊙ case, based on “frequencies for modes that probe
– 3 –
just below the convection zone bottom (l = 5 − 20, ν = 2500 − 3500 µHz),” but this latter conclusion is
rendered dubious by the fact that this is the particular region of the Sun where one should expect the worst
agreement in models that do not attempt to include rotation-induced mixing (see, e.g., Richard et al. 1996;
Brun, Turck-Chi`eze, & Zahn 1999; Basu et al. 2000; Bahcall, Pinsonneault, & Basu 2001; Turck-Chi`eze et
al. 2001). Furthermore, these models of Guzik & Cox (1995) were based on relatively crude approximations
to the physical processes in the solar interior, particularly for the opacities. They state that their solar
interior opacities used the Iben (1975) analytical fits to the opacity tables of Cox & Stewart (1970), with
the electron scattering (esk) term in the Iben fit being multiplied either by a factor of 1.5 to approximate
the LAOL tables, or by a factor of 2 to approximate the (early) OPAL opacities of Rogers & Iglesias (1992);
in addition, they adjusted the opacities separately for each of their solar models, by adjusting the Az term
in the Iben fit (which mainly affects opacities at 2 − 5 × 10⁶
K) in order to yield a position for the base of
solar envelope convection at Rce ≈ 0.711 − 0.712 R⊙ (Guzik & Cox 1995). Even if they had in fact used
the early OPAL opacity tables of Rogers & Iglesias (1992), the models of Morel et al. (1997) suggest that
this would be expected to yield solar models with helioseismic disagreements 2 or 3 times worse than can
be achieved by models using the more recent OPAL opacities (Iglesias & Rogers 1996; Rogers, Swenson,
& Iglesias 1996); we have shown that using the LAOL opacity tables would result in even larger errors
(Boothroyd & Sackmann 2002). Guzik & Cox (1995) used the recent MHD equation of state tables (D¨appen
et al. 1988), albeit for a fixed value of Zeos = 0.02 (the metallicity Z actually varied from ∼ 0.018 to ∼ 0.021
from the envelope to the center of their models), but the equation of state is not very sensitive to metallicity,
and we estimate that this fixed-Z approximation introduced errors in their thermodynamic quantities of no
more than a few parts in 103
. They considered diffusion of hydrogen, helium, and four of the CNO isotopes,
using diffusion constants from Cox, Guzik, & Kidman (1989); as they point out, the fact that this treatment
probably overestimates the extent of gravitational settling of heavy elements (Proffitt & Michaud 1991) may
compensate for the fact that they considered diffusion for elements comprising only 62% of the metallicity Z.
Finally, Guzik & Cox (1995) compared models which had not been converged to the same final surface Z/X
value; their Z/X differences of up to 4% would by themselves yield significant (though not major) differences
between the models, largely through the effect on the opacities (Boothroyd & Sackmann 2002).
Morel et al. (1997) also used helioseismology to test an initial solar mass of 1.1 M⊙, comparing sound
speed and density profiles in their solar models to profiles obtained via an inversion from helioseismic fre-
quencies. Their solar models incorporated much more up-to-date input physics (though they also used the
fixed-Z approximation in the equation of state, with Zeos = 0.019), and they tested some different formu-
lations of the input physics; but their tests of the effects of early solar mass loss yielded results that were
ambiguous at best. They first considered models using the CEFF equation of state (Christensen-Dalsgaard
& D¨appen 1992), diffusion constants from Michaud & Proffitt (1993), and the more recent OPAL opacities
(Iglesias & Rogers 1996; Rogers et al. 1996); however, in these models Morel et al. (1997) also used the
fixed-Z approximation when interpolating the opacities, which can lead to significant opacity errors and
thus significant effects on the solar models, as they themselves showed (see also Boothroyd & Sackmann
2002). Morel et al. (1997) compared mass-losing models with an initial mass of Mi = 1.1 M⊙ to a standard
solar model (Mi = 1.0 M⊙), testing both a short (0.2 Gyr) and a long (0.45 Gyr) mass loss timescale. They
found that the long mass loss timescale yielded fractional shifts of up to ∼ 0.001 in the sound speed profile
relative to the standard solar model (a significant but not major effect), while the short mass loss timescale
had an insignificant effect (of ∼ 0.0002, roughly one fifth as large). They next considered models with the
OPAL equation of state (Rogers et al. 1996), and where the variation of metallicity Z inside the star was
considered when interpolating in the OPAL opacities (each of these latter two changes yielded shifts of up
to 0.001 in the sound speed profiles of their standard solar models). They compared a model with an initial
– 4 –
mass Mi = 1.1 M⊙ and their short (0.2 Gyr) mass loss timescale to a standard solar model, finding differ-
ences of up to ∼ 0.001 in the sound speed profile between them — 5 times as large as the effect from the
same comparison with the first set of models (and large enough to suggest the possibility of highly significant
effects from a longer mass loss timescale). Such large disagreements between their two sets of results for
the differential effects of early solar mass loss suggest that their mass-losing models may have had much
larger numerical or convergence errors than they estimated for their standard solar models; and indeed their
second short-timescale mass-losing model shows sound speed disagreements near the surface that might be
interpreted as being due to poor convergence to the present solar luminosity, radius, and/or surface Z/X —
though even very poor convergence would not expected to yield such large interior disagreements (Boothroyd
& Sackmann 2002).
The goal of the present work was to resolve the above ambiguity as to what constraints might be placed
on early solar mass loss by helioseismic observations, by computing models with both up-to-date input
physics and high numerical precision. We considered additional observational constraints on solar mass loss
(as discussed in § 1.1.2 below), and tested a number of different initial solar masses and mass loss timescales.
We also compared the effects of mass loss to the effects of other reasonable variations in the solar input
parameters and input physics — these latter effects were discussed in detail in our companion paper “Our
Sun IV” (Boothroyd & Sackmann 2002). Finally, we present the effects of the various mass loss cases on the
solar flux reaching Earth and Mars as a function of time.
1.1.2. Other Observational Constraints
Presently, the Sun is experiencing only a negligible amount of mass loss: the solar wind removes mass
at a rate ∼ 3×10⁻¹⁴
M⊙ yr−1
. If this mass loss rate had been constant over the last 4.5 Gyr, the young Sun
would have been more massive by only ∼ 10−4
M⊙. The contemporary solar wind has been observed only
for a few decades, and has been found to be a highly variable phenomenon — all properties, including flux,
velocity, and composition vary significantly (Geiss & Bochsler 1991). The lunar surface material carries the
signature of the solar wind irradiation over the past several Gyr; measurements of noble gas isotopes in lunar
samples suggest that the average solar wind flux over the past ∼ 3 Gyr was an order of magnitude higher
than it is today (Geiss 1973; Geiss & Bochsler 1991; Kerridge et al. 1991). This implies a total solar mass
loss of ∼ 10−3
M⊙ over the past 3 to 4 Gyr (the age of the oldest available lunar material). Some older,
solar-flare irradiated grains from meteorites imply an early solar flare activity about 103
times that of the
present Sun (Caffee, Hohenberg, & Swindle 1987); the associated solar wind may have been enhanced by a
similar factor of ∼ 103
, most likely during the first ∼ 1 Gyr of the Sun’s life on the main sequence (Whitmire
et al. 1995), implying a total mass loss during this first 1 Gyr period of as much as ∼ 0.03 M⊙ (if the average
mass loss rate throughout that period was indeed ∼ 103
times the present rate of 3 × 10⁻¹⁴
M⊙yr−1
). Such
a change in the solar mass would be sufficient to cause a significant increase in the luminosity of the young
Sun.
Since the Sun is a typical main sequence star, it is reasonable to assume that mass loss rates in the
young Sun would be similar to those in other young solar-type main sequence stars. There have been several
attempts to measure mass loss in early main sequence stars. It is observationally a very challenging task.
Brown et al. (1990) attempted to obtain mass loss rates for 17 young main sequence stars somewhat hotter
and more massive than the Sun (A and F dwarfs), finding upper limits to the mass loss rates of 10−10
to
10−9
M⊙/yr; these limits are even less constraining than the highest solar mass loss rate suggested by the
meteoritic and lunar data. Gaidos, G¨udel, & Blake (2000) used 3.6 cm VLA observations to place more
– 5 –
stringent upper limits of ˙M 5 × 10⁻¹¹
M⊙ yr−1
on mass loss rates of three young main sequence stars of
roughly solar mass (π01
UMa, κ1
Cet, and β Com) — as discussed in § 2.1, the largest initial solar mass
that we consider, namely 1.07 M⊙, would require early solar mass loss rates that are marginally consistent
with these more stringent limits.
Wood et al. (2001) recently obtained HST observations of H I Lyα absorption from the region where the
stellar wind collides with the interstellar medium, using these to measure the stellar wind from the sun-like
star α Cen. They found a mass loss rate roughly twice as large as that of the Sun; note that α Cen is slightly
older than the Sun (with an age of ∼ 5 Gyr), as well as being very slightly more massive (M ≈ 1.08 M⊙).
They also found an upper limit roughly ten times lower for its cooler, less massive companion Proxima Cen.
A similar method had earlier been used by Wood & Linsky (1998) to look at four other main sequence stars
cooler and less massive than the Sun (finding stellar winds of roughly the same order of magnitude as the
solar wind). Such a method applied to young, Sun-like stars holds promise for placing stringent limits on
early main sequence mass loss.
Very recently, Wood et al. (2002) demonstrated that mass loss rates in GK dwarfs (measured using
the above method) are generally correlated with their X-ray flux (measured by ROSAT, and using the
HIPPARCOS distances). For 7 of the 9 stars they looked at, there was a fairly tight correlation, with
˙M ∝ F1.15±0.20
X over a range of 2 orders of magnitude in ˙M and FX. They then used the estimates from
Ayres (1997) of the correlation of X-ray flux with rotational velocity FX ∝ V 2.9±0.3
rot and of rotational velocity
with age Vrot ∝ t−0.6±0.1
to obtain the first empirically derived relation describing the mass-loss evolution of
cool main-sequence stars like the Sun, namely, ˙M ∝ t−2.00±0.52
. They point out that the above correlations
do not really apply to very young stars (age 0.3 Gyr), and assume instead that the maximum mass loss
rate at early times corresponds to the maximum X-ray flux observed in Sun-like stars, namely, 103
times
the solar value. Given the Sun’s present mass loss rate of ˙M ∼ 3 × 10⁻¹⁴
M⊙ yr−1
, this would imply total
solar mass loss of order 0.01 M⊙ (albeit with an uncertainty of a factor of 5 or so), with most of this mass
loss taking place in the first fraction of a Gyr of the Sun’s lifetime. The effects of such a mass loss law will
be investigated in more detail in a future paper (A. I. Boothroyd & I.-J. Sackmann, in preparation), but we
make some rough estimates of the probable effects in § 3 and § 4.
The observed depletion of lithium in the Sun provides a stringent upper limit to the total solar mass loss
of ∆M ∼ 0.1 M⊙; i.e., the initial solar mass Mi (4.5 Gyr ago) is constrained to be Mi 1.1 M⊙ (Boothroyd
et al. 1991). However, this is much too generous an upper limit. There are additional mechanisms that
can deplete solar lithium. One mechanism, namely, pre-main-sequence lithium depletion (during the Sun’s
initial contraction phase), was taken into account in our mass-losing solar models (for the standard Sun, this
depletion was a factor of ∼ 20, as discussed below and in our companion paper “Our Sun IV” [Boothroyd
& Sackmann 2002]). Another mechanism is rotation-induced turbulent mixing, which probably is the major
cause of the main-sequence lithium depletion; however, rotation models have free parameters, and can be
fitted to any required amount of solar lithium depletion (see, e.g., Schatzman 1977; Lebreton & Maeder 1987;
Pinsonneault et al. 1989; Charbonnel, Vauclair, & Zahn 1992; Richard et al. 1996). Also, it has been shown
that mass loss cannot be the major contributor to the observed lithium depletions in the young Hyades
cluster (Swenson & Faulkner 1992); this constraint is discussed in more detail in § 1.1.3 below.
An even more stringent upper limit to the Sun’s initial mass is imposed by the requirement that the
early Earth not lose its water via a moist greenhouse effect, which would occur if the solar flux at Earth
were more than 10% higher than its present value (Kasting 1988) — a moist greenhouse occurs when the
stratosphere becomes wet, and H2O is lost through UV dissociation and the subsequent loss of hydrogen to
space. This solar flux limit corresponds to an upper limit on the Sun’s initial mass of Mi 1.07 M⊙, which
– 6 –
is the most stringent upper limit on the Sun’s initial mass.
The only strong lower limit on Mi comes from the fact that the Sun is converting matter into energy
and radiating it away; ∆E = L∆t = ∆Mc2
, where ∆E is the total energy radiated away, L is the average
solar luminosity (including the neutrino luminosity) ∆t is the ∼ 4.5 Gyr duration of the nuclear burning,
∆M is the amount of mass converted into energy, and c is the speed of light (note that elsewhere in the
paper we use “c” to denote the adiabatic sound speed). At present, mass is radiated away as photons and
neutrinos at a rate slightly over twice the solar wind mass loss rate. For the standard solar model, the
Sun’s average luminosity over the last 4.5 Gyr was about 0.85 times its present luminosity. It follows that
∆M ≈ 3 × 10⁻⁴
M⊙ from radiation losses alone (i.e., that Mi 1.0003 M⊙). Such a minor amount of mass
loss has a negligible effect on the early solar luminosity.
There are also considerations that put soft lower limits on the Sun’s initial mass Mi. If the present
observed solar wind rate of ∼ 3 × 10⁻¹⁴
M⊙/yr had been constant over the Sun’s history, the total amount
of solar wind mass loss would have been only ∼ 1.4 × 10⁻⁴
M⊙; including the ∆M ≈ 3 × 10⁻⁴
M⊙ from
radiation losses would imply Mi ∼ 1.0004 M⊙. However, measurements of the noble gases implanted in
lunar samples suggest an average solar wind flux over the past ∼ 3 Gyr an order of magnitude higher than
at present, (Geiss 1973; Geiss & Bochsler 1991; Kerridge et al. 1991), implying a total solar mass loss over
that period of ∼ 0.001 M⊙, i.e., a solar mass 3 Gyr ago of M(−3 Gyr) ∼ 1.001 M⊙ — note that M(−t)
is used to refer to the solar mass at t years before the present. The ∼ 3 Gyr age of these lunar rocks
means that they place no limits on earlier solar mass loss, so that all one can say is that Mi ≥ M(−3 Gyr).
Older, solar-flare irradiated grains from meteorites imply early solar flare activity about 103
times that of
the present Sun (Caffee et al. 1987), which might possibly correspond to similarly high mass loss rates during
the first ∼ 1 Gyr period of the Sun’s life, but cannot be used to provide any sort of limit. The semi-empirical
mass loss formula recently presented by Wood et al. (2002) suggests total solar mass loss of order 0.01 M⊙,
but with an uncertainty of about a factor of 5, as discussed above.
Another limit on the Sun’s initial mass comes from the requirement that Mars was warm enough for
liquid water to exist 3.8 Gyr ago (at the end of the late heavy bombardment period). According to Kasting
(1991) and Kasting et al. (1993), this requires a solar flux (at Mars) 3.8 Gyr ago at least 13% larger than
that from the standard solar model, in order to make it possible for a CO2 greenhouse effect on Mars to be
able raise the temperature to 0◦
C. Such an increase in flux would correspond to a mass of the Sun at that
time of M(−3.8 Gyr) 1.018 M⊙. Since the lunar rock measurements constrain the Sun’s mass ∼ 3 Gyr
ago to be M(−3 Gyr) ∼ 1.001 M⊙, the Sun’s average mass loss rate between 3.8 and 3 Gyr ago would be
˙M 2 × 10⁻¹¹
M⊙/yr. If this same mass loss rate also occurred throughout the period from the Sun’s
birth ∼ 4.6 Gyr ago until 3.8 Gyr ago, this would imply an initial solar mass of Mi 1.033 M⊙. Note that
this lower limit assumes that the only greenhouse effect on early Mars is due to CO2. If a smog-shielded
ammonia greenhouse could exist on early Mars, such as that proposed for the early Earth by Sagan & Chyba
(1997), then this lower limit on Mi might be softened or eliminated.
1.1.3. The Swenson-Faulkner Hyades Mass Loss Constraint
Swenson & Faulkner (1992) established that mass loss could not be the major cause of the main-
sequence lithium depletion for stars in the Hyades cluster. Their result has frequently been mis-quoted and
misunderstood; it has often been used to rule out the possibility of mass loss during the Sun’s early main
sequence phase. However, their result does not rule out relatively small amounts of mass loss for either the
– 7 –
Hyades or the Sun.
For the Hyades cluster, which is 0.6 Gyr old, lithium abundances in many stars have been observed,
exhibiting a fairly tight relationship between a star’s lithium abundance and its surface temperature — the
observed lithium abundance drops off steeply with decreasing surface temperature, below ∼ 6000 K. Swenson
& Faulkner (1992) considered lithium depletion due both to pre-main-sequence burning and to main sequence
mass loss. They found that the observed lithium-temperature relationship could not be accounted for by
pre-main-sequence lithium depletion alone, but that it could be accounted for fairly well if one added main
sequence mass loss. However, they found that all the stars with surface temperatures below 5500 K would
then have to have nearly identical initial masses (with a wide range of mass loss rates). Such a distribution of
initial stellar masses, with a high, narrow peak in the distribution near 1.1 M⊙, is unrealistic. This argument
has been widely misquoted, to rule out early main sequence mass loss in stars (including the Sun).
The Swenson-Faulkner conclusion applies only if one is trying to match the Hyades lithium depletions
without including rotation-induced mixing. As soon as one includes the latter as a major component, one
can reproduce the observed lithium-temperature relation of Hyades stars by choosing suitable values for the
adjustable parameters in the rotational mixing formalism (see, e.g., Schatzman 1977; Lebreton & Maeder
1987; Pinsonneault et al. 1989; Charbonnel et al. 1992; Richard et al. 1996). Stellar rotation is ubiquitous in
young stars, and is commonly assumed to be the cause of all main sequence lithium depletion; the presence
of a relatively small amount of mass loss merely requires that the large lithium depletion due to rotation be
decreased by a small amount (by small changes in the adjustable parameters for rotational mixing). For the
Hyades, even a mass loss as large as ∆M = 0.07 M⊙ in a star near 1 M⊙ would imply a lithium depletion
factor due to mass loss alone of only ∼ 5, (according to the models of Swenson & Faulkner 1992), and
would still require a depletion factor due to rotational mixing of ∼ 15 in order to reproduce the observed
lithium-temperature relation. For the Sun, pre-main sequence burning yields a lithium depletion factor
of order 20 (Boothroyd & Sackmann 2002); as discussed in § 3.2.1, combining pre-main sequence lithium
burning with an early solar mass loss of ∆M = 0.07 M⊙ increases this by less than a factor of 2, i.e., a
combined lithium depletion factor of ∼ 30 − 40, still much smaller than the total observed lithium depletion
of 160 ± 40 (Grevesse & Sauval 1998). Rotation would be responsible for the remaining lithium depletion.
Mass loss of order ∆M = 0.07 M⊙ or less is consistent with the Hyades lithium observations, i.e., does not
require an unrealistic initial stellar mass distribution.
In their later work, Swenson et al. (1994) found they were able to reproduce the Hyades lithium-
temperature relation by pre-main-sequence depletion alone, provided that the oxygen abundance was as-
sumed to be at the upper limit of the observed range (and using the most up-to-date OPAL and Alexander
opacities). However, other clusters such as NGC 752, M67, or NGC 188 cannot be explained via pre-main-
sequence lithium depletion alone — their observed lithium depletions are much larger than those of the
Hyades (see, e.g., Hobbs & Pilachowski 1988; Balachandran 1995), while their pre-main-sequence depletions
would be significantly smaller (due to their lower metallicities). The same is true of the Sun. In other
words, the observed lithium depletions demand main sequence depletion, which would be largely due to
rotation-induced mixing, with possibly a small effect from mass loss as well.
– 8 –
1e-14
1e-13
1e-12
1e-11
1e-10
0 0.5 1 1.5 2 2.5 3 3.5 4 4.5
Solarmasslossrate(MO•yr-1
)
time (Gyr)
1.07 exp
1.01 exp
1.07 step
1.01 step
1.07 linear
1.01 linear
π01
UMa
κ
1
Cet
β Com
Exponential mass loss: Mi = 1.07 MO•
Exponential mass loss: Mi = 1.01 MO•
Step-function mass loss: Mi = 1.07 MO•
Step-function mass loss: Mi = 1.01 MO•
Linear mass loss: Mi = 1.07 MO•
Linear mass loss: Mi = 1.01 MO•
Fig. 1.— Mass loss rates as a function of time for our “exponential,” “step-function,” and “linear” solar
mass loss cases. The lowest and the highest mass loss cases that we considered are shown (Mi = 1.01 and
1.07 M⊙, respectively). Mass loss upper limits for the young Sun-like stars π01
UMa, κ1
Cet, and β Com
are from Gaidos et al. (2000).
2. Methods
2.1. Mass Loss of the Young Sun
We computed mass-losing solar models having initial masses Mi = 1.01, 1.02, 1.03, 1.04, 1.05, 1.06,
and 1.07 M⊙; as discussed in § 1.1.2, an initial mass of 1.07 M⊙ is the upper limit consistent with the
requirement that the young Earth not lose its water via a moist greenhouse effect (Kasting 1988). We
considered three different forms for early solar mass loss, which we call “exponential,” “step-function,” and
“linear”; for each of these, two limiting cases are displayed in Figure 1 (i.e., cases with initial solar masses
of 1.01 and 1.07 M⊙).
In the “exponential” mass loss case, the mass loss rate starts out high and declines exponentially, with
an initial mass loss rate ˙M0 and decay time constant τ chosen such as to give the present observed solar
mass loss rate of ˙M = 3 × 10⁻¹⁴
M⊙ yr−1
at the Sun’s present age. In other words, ˙M(t) = ˙Mi e−t/τ
, with
˙Mi = 1.33 × 10⁻¹¹
to 1.27 × 10⁻¹⁰
M⊙ yr−1
and τ = 0.755 to 0.551 Gyr, for initial solar masses of 1.01
to 1.07 M⊙, respectively. This exponential mass loss case is our most conservative one: a simple mass loss
scenario that is still reasonably consistent with the observed lunar mass loss constraint. This scenario yields
average mass loss rates over the past 3 Gyr of 13 to 42 times the present value, for initial solar masses of
1.01 to 1.07 M⊙, respectively. These average mass loss values are reasonably consistent with measurements
of noble gases in lunar rocks, which suggest a mass loss rate an order-of-magnitude higher than the present
value. Since Figure 1 is a log-linear plot, these “exponential” mass loss cases appear as straight lines.
The “step-function” mass loss rate was chosen to have a constant high value during the period before
the lunar rock observations apply, namely, the first 1.6 Gyr of the Sun’s life; over the remaining 3 Gyr of the
– 9 –
Sun’s life (up to the present), a mass loss rate averaging ten times the present value was assumed, declining
linearly over this period to reach the present solar mass loss rate at the present solar age. This is the most
extreme case which is still consistent with the observed lunar rock mass loss constraints: it keeps the solar
flux as high as possible for as long as possible. For the first 1.6 Gyr, this scenario has constant mass loss
rates of ˙M = 5.69 × 10⁻¹²
to 4.32 × 10⁻¹¹
M⊙ yr−1
, for initial solar masses of 1.01 to 1.07 M⊙, respectively.
In the “linear” mass loss case, the mass loss rate starts out high and declines slowly and linearly,
to reach the present solar mass loss rate at the present solar age. This was chosen as our most radical
case, with maximum impact on the Sun’s internal structure. Due to the linear decline, the mass loss rate
remains high throughout most of the Sun’s lifetime, remaining of the same order as the initial mass loss
rate ( ˙Mi = 4.35 × 10⁻¹²
to 3.04 × 10⁻¹¹
M⊙ yr−1
, for initial solar masses of 1.01 to 1.07 M⊙, respectively).
During the past 3 Gyr, the mass loss rate for this “linear” case is much higher than for the other mass
loss cases above, violating the observed lunar mass loss constraints (the “linear” case has average mass loss
rates over the past 3 Gyr of 50 to 330 times the present rate, for initial solar masses of 1.01 to 1.07 M⊙,
respectively). The “linear” mass loss cases appear as curved lines in Figure 1.
2.2. Physical Inputs to our Solar Models
The solar evolution program is discussed in detail in our companion paper “Our Sun IV” (Boothroyd
& Sackmann 2002); we provide only a brief summary here. We used the OPAL equation of state (Rogers
et al. 1996), extended to lower temperatures by the MHD equation of state (D¨appen et al. 1988). The
1995 OPAL opacities (Iglesias & Rogers 1996) were used for log T > 4; since these opacities (as well as
both sets of equation of state tables) were based on the heavy element composition of Grevesse & Noels
(1993), this mixture was used in order to obtain self-consistent solar models (along with their recommended
value Z/X = 0.0245 in the present solar envelope). At lower temperatures (log T < 4), the Alexander &
Ferguson (1994) molecular opacities were used. Both the equation of state and the opacities were interpolated
in metallicity as well as in hydrogen abundance, temperature, and density, in order to take into account
metallicity variations due to diffusion and nuclear burning.
For the “exponential” mass loss cases, we also computed an alternate set of solar models based on
the recent solar composition observations of Grevesse & Sauval (1998), which yield Z/X = 0.023 in the
present solar envelope; for this composition, we obtained appropriate OPAL opacities via the online opacity
computation feature of the OPAL web page3
. Also, in these models we performed the switchover between
the OPAL and MHD equations of state at log T ∼ 4 (rather than at log ρ ∼ −2, which corresponds to
log T ∼ 5.5 in the Sun). As discussed in Boothroyd & Sackmann (2002), the switchover region between
the two equations of state was wide enough, and the equations of state were similar enough in the chosen
switchover regions, that artifacts introduced by the switchover should not be significant compared to the
size of the inconsistencies in the OPAL equation of state.
We used the NACRE nuclear reaction rate compilation (Angulo et al. 1999), supplemented by the 7
Be
electron capture rates of Gruzinov & Bahcall (1997). Weak screening (Salpeter 1955) was used — note
that it is a very good approximation to the exact quantum mechanical solution for solar conditions (see,
e.g., Bahcall, Chen, & Kamionkowski 1998; Gruzinov & Bahcall 1998). All of the stable isotopes up to
and including 18
O were considered in detail, except for deuterium (which was assumed to have been burned
3http://www-phys.llnl.gov/Research/OPAL/
– 10 –
to 3
He). The other isotopes up to 28
Si were included in the code, but not in the nuclear reaction network,
since there are no significant effects under solar conditions (except for 19
F, which was assumed to be in
CNO-cycle nuclear equilibrium for nuclear rate purposes). Neutrino capture cross sections were taken from
Bahcall & Ulrich (1988), except for the 8
B-neutrino cross section for capture on 37
Cl, where the more recent
value (5% higher) of Aufderheide et al. (1994) was used.
A set of subroutines4
were kindly provided to us (M. H. Pinsonneault 1999, private communication) that
take into account the diffusion (gravitational settling) of helium and heavy elements relative to hydrogen
(see also Thoul, Bahcall, & Loeb 1994; Bahcall, Pinsonneault, & Wasserburg 1995).
A present solar mass of M⊙ = 1.9891 × 1033
g (Cohen & Taylor 1986) was used, and a solar radius at
the photosphere (τ = 2/3) of R⊙ = 695.98 Mm (Ulrich & Rhodes 1983; Guenther et al. 1992). Our solar
luminosity value of L⊙ = 3.854 × 1033
erg s−1
(Sackmann, Boothroyd, & Kraemer 1993) is close (less than
1-σ) to the more recent value of Bahcall et al. (2001); as discussed in our companion “Our Sun V” paper
(Boothroyd & Sackmann 2002), such a luminosity difference has negligible effect on the solar structure (and
only a minor effect on the neutrino rates). We used a total solar age of t⊙ = 4.6 Gyr, measured from the Sun’s
birth on the pre-main-sequence Hayashi track; this is only just outside the range 4.55 Gyr < t⊙ < 4.59 Gyr
(in effect, t⊙ = 4.57±0.01 Gyr) allowed by meteoritic ages (Bahcall et al. 1995), sufficiently close that a more
precise age value would have had very little effect on the solar structure and helioseismology (see Boothroyd
& Sackmann 2002). Note that the earlier total solar (and solar system) age estimate τss = 4.53 ± 0.03 Gyr
of Guenther (1989) is consistent with the limits of Bahcall et al. (1995). Our models took about 40 Myr
to reach the zero age main sequence (ZAMS), the point at which nuclear reactions in the core provide
essentially all the Sun’s luminosity, and the pre-main-sequence contraction stops; this pre-main-sequence
timescale implies that the total solar age t⊙ used in this paper can be converted into a main sequence solar
lifetime by subtracting about 0.04 Gyr (this was also pointed out by Guenther 1989).
We investigated the effects of using two different zonings. Our coarse-zoned solar models had about 2000
spatial zones in the model, and about 200 time steps in the evolution from the zero-age main sequence to the
present solar age (plus about 800 time steps on the pre-main-sequence), comparable to other work in this
field (e.g., a factor of 2 more than Morel et al. 1997); mass-losing solar models might require several times as
many timesteps, due to the constraint that mass loss effects be kept small over one timestep. Typically, these
models were converged to match the solar luminosity, radius, and surface Z/X value to within a few parts
in 105
; a few cases where convergence was slow reached only about a part in 104
. Because the inconsistencies
in the mass-losing solar models of Morel et al. (1997) had suggested the possibility that such models might
tend to have numerical inaccuracies larger than in standard solar models, as discussed in § 1.1.1, we also
computed a number of fine-zoned models, with 10 000 spatial zones and 1500 main-sequence time steps (plus
6000 pre-main-sequence time steps) — a factor of 5 increase in both spatial and temporal precision. It was
indeed more difficult to converge mass-losing solar models to precise solar luminosity, radius, and surface Z/X
values — the standard solar models were converged to these values with an accuracy nearly a factor of ten
better than the typical mass-losing models — but comparing the last few models in a convergence sequence
revealed no untoward effects. Considering the much larger amounts of CPU-time required, there seemed
to be no point in attempting to match the solar luminosity, radius, and surface Z/X values any better for
fine-zoned cases than for coarse-zoned ones. (A fine-zoned converged mass-losing solar model took a few
weeks of CPU-time on a fairly high-performance ES40 computer, as compared to about half a day for a
coarse-zoned case, while a standard solar model without mass loss took only about a fifth as long in each
4These subroutines are available from Bahcall’s web page: http://www.sns.ias.edu/∼jnb/
– 11 –
case; these times were roughly tripled on a 450 MHz Pentium III PC.) As discussed in our companion “Our
Sun IV” paper (Boothroyd & Sackmann 2002), even the worst of the above convergence accuracies has a
negligible effect on the solar sound speed profile: up to 1 or 2 parts in 104
in the convective envelope, and a
few parts in 105
below it. The fine-zoned mass-losing models differed from the corresponding coarse-zoned
ones by the same negligibly small systematic shift (less than a part in 104
in the sound speed) that had been
found in standard solar models (see Boothroyd & Sackmann 2002); we concluded that our properly converged
coarse-zoned mass-losing models are perfectly adequate, and do not suffer from the problems encountered
by the mass-losing solar models of Morel et al. (1997).
Even the largest of the mass loss rates we considered (3 orders of magnitude larger than the present
solar wind) is still quite small in absolute terms (for example, asymptotic giant branch stars encounter mass
loss rates 6 orders of magnitude larger still, and high-mass main sequence stars also have very high mass loss
rates). Nonetheless, over a reasonable model timestep, such mass loss would cause a mass layer near the solar
surface to move outwards significantly. We therefore used an outer boundary condition for our models at a
point ∼ 10−3
M⊙ inwards from the solar surface, computing sets of static envelopes for the region exterior
to this point (and requiring timesteps short enough that changes at this outer boundary point remained
small from one timestep to the next). Since the mass loss timescales for these outer layers are always at
least 4 orders of magnitude longer than their thermal timescales, this should be a good approximation; and
ignoring energy changes in this small outer region should introduce fractional errors in the solar luminosity
at the level of 10−6
or less. Test cases where this outer boundary point was chosen differently showed no
effect, as expected.
We compared our solar models to profiles of the solar sound speed c⊙, density ρ⊙, and adiabatic
index (Γ1)⊙ obtained from the helioseismic reference model of Basu et al. (2000)5
, which they obtained by
inversion from the helioseismic frequency observations. In the inversion process, a standard solar model
is required, but Basu et al. (2000) demonstrated that the resulting c⊙ and ρ⊙ profiles of the helioseismic
reference model are relatively insensitive to uncertainties in the standard solar model used for this purpose
(except for uncertainties in R⊙). They estimated a net uncertainty of few parts in 104
for the sound
speed c⊙ and adiabatic index (Γ1)⊙, and a few parts in 103
for the density ρ⊙. However, in the Sun’s core
(r 0.1 R⊙), systematic uncertainties in the helioseismic sound profile are increased by a factor of ∼ 5; this
was demonstrated by Bahcall et al. (2001), who compared helioseismic inversions of different helioseismic
data sets. We used their comparison to estimate the r-dependence of the systematic error in c⊙ in the
core and in the convective envelope (namely, a fractional systematic error decreasing linearly from 0.0013
at r = 0.05 R⊙ to 0.0003 at r = 0.2 R⊙, constant from there to r = 0.72; R⊙, then increasing linearly
to 0.00052 at r = 0.94; R⊙). For c⊙, this systematic error can be significantly larger than the statistical
errors quoted in Table 2 of Basu et al. (2000), and we combined the two in quadrature to get the total
fractional error (σc/c) for the purpose of calculating weighted rms differences — the rms fractional difference
in c is given by [(∆c/c)/(σc/c)]2
/ [1/(σc/c)]2
1/2
. For (Γ1)⊙ and ρ⊙, the systematic errors are
comparable to or smaller than the statistical ones, and the statistical errors sufficed for calculating weighted
rms differences.
We present all our sound speed and density profiles in terms of differences relative to the observed
helioseismic reference profiles. This choice of presentation not only allows one to see the effects of the choice
of initial mass and mass loss type, but also the extent to which the models agree with the helioseismic
5From the denser-grid machine-readable form of their Table 2, at http://www.sns.ias.edu/∼jnb/
– 12 –
observations.
3. Results and Discussion
For comparison with our solar mass loss rates, we used the most recent observed upper limits on stellar
mass loss rates from three young Sun-like stars (namely, ˙M 5 × 10⁻¹¹
M⊙ yr−1
, from π01
UMa, κ1
Cet,
and β Com), as presented by Gaidos et al. (2000). Even our highest mass loss cases are very close to being
consistent with these limits, as is illustrated in Figure 1.
3.1. Testing Mass Loss Models Via Helioseismology
3.1.1. Sound Speed and Density Profiles
We present in Figure 2 profiles of the adiabatic sound speed differences δc/c ≡ (c⊙ −cmodel)/c⊙; profiles
of the density differences δρ/ρ ≡ (ρ⊙ − ρmodel)/ρ⊙ are available online6
. Note that we use “δ” to denote
differences between the helioseismic profile and one of our models, and “∆” to denote differences between
two of our models with different input parameters — the “δ” values are the profiles plotted in Figure 2, while
the “∆” values refer to the difference between one plotted curve and another. Solar masses as a function of
time for the corresponding cases are presented in Figure 3, and solar fluxes at the planets (relative to their
present values) are presented in Figure 4.
Since the prominent peak at r ∼ 0.7 R⊙ results from the neglect of rotational mixing, we did not
require agreement in this region between profiles from our theoretical models and profiles inferred from
the helioseismic observations. Nor did we require agreement in core region, since the present helioseismic
observations still result in large uncertainties in the inferred profiles there. On the other hand, we aimed for
agreement in the regions 0.1 R⊙ r 0.6 R⊙ and 0.72 R⊙ r 0.94 R⊙, where disagreements are due to
imperfections in the input physics or uncertainties in the observed solar parameters. This is demonstrated
by our variant models of our companion paper “Our Sun IV” (Boothroyd & Sackmann 2002) and of Morel et
al. (1997) and Basu et al. (2000). Except around r ∼ 0.7 R⊙ and near the surface, the sound speed profile in
our standard solar models with the Grevesse & Noels (1993) composition (heavy solid lines in Fig. 2a, b, c)
differ by δc/c 0.001 from the helioseismic sound speed, typical agreement for standard solar models with
this composition (see, e.g., Morel et al. 1997; Basu et al. 2000; Bahcall et al. 2001; Turck-Chi`eze et al. 2001;
Neuforge-Verheecke et al. 2001). However, if one updates to the more recent solar composition value of
Grevesse & Sauval (1998), there is a systematic shift in the sound speed profile in the interior that worsens
agreement with helioseismology by a factor of ∼ 2 (heavy solid line in Fig. 2d — differences near the solar
surface are due to extending the use of the OPAL equation of state to lower temperatures in this model).
This composition effect was also demonstrated by solar models of Neuforge-Verheecke et al. (2001). Even
larger systematic effects are allowed by the quoted uncertainties in the solar composition, and (to a lesser
extent) the uncertainties in the OPAL opacities, the pp nuclear reaction rate, and the diffusion constants for
gravitational settling, as shown in detail in our companion paper “Our Sun IV” (Boothroyd & Sackmann
2002). In Figure 2, the filled circles (connected by light solid lines) indicate the extremes of the range of
δc/c profiles found in Boothroyd & Sackmann (2002) for solar models with “reasonable” variations in these
6http://www.krl.caltech.edu/∼aib/papdat.html
– 13 –
-0.003
-0.002
-0.001
0
0.001
0.002
0.003
0.004
0 0.1 0.2 0.3 0.4 0.5 0.6 0.7 0.8 0.9 1
adiabaticsoundspeedδc/c=(cO•−cmodel)/cO•
radius r (RO• )
cases
mass loss
Exponential
(a)
Mi = 1.00 MO•
Mi = 1.03 MO•
Mi = 1.07 MO•
range from other effects
-0.003
-0.002
-0.001
0
0.001
0.002
0.003
0.004
0 0.1 0.2 0.3 0.4 0.5 0.6 0.7 0.8 0.9 1
adiabaticsoundspeedδc/c=(cO•−cmodel)/cO•
radius r (RO• )
cases
mass loss
Step-function
(b)
Mi = 1.00 MO•
Mi = 1.03 MO•
Mi = 1.07 MO•
range from other effects
-0.003
-0.002
-0.001
0
0.001
0.002
0.003
0.004
0 0.1 0.2 0.3 0.4 0.5 0.6 0.7 0.8 0.9 1
adiabaticsoundspeedδc/c=(cO•−cmodel)/cO•
radius r (RO• )
cases
mass loss
Linear
(c)
Mi = 1.00 MO•
Mi = 1.03 MO•
Mi = 1.07 MO•
range from other effects
-0.003
-0.002
-0.001
0
0.001
0.002
0.003
0.004
0 0.1 0.2 0.3 0.4 0.5 0.6 0.7 0.8 0.9 1
adiabaticsoundspeedδc/c=(cO•−cmodel)/cO•
radius r (RO• )
OPAL eos down
GS98 composition,
Exponential cases:
to 104
K
(d)
Mi = 1.00 MO•
Mi = 1.03 MO•
Mi = 1.07 MO•
range from other effects
Fig. 2.— The effects of mass loss on the adiabatic sound speed c for (a) exponential, (b) step-function, and
(c) linear mass loss cases; (d) shows exponential mass loss cases, as in (a), except that it uses the more recent
“GS98” composition of Grevesse & Sauval (1998) (with appropriate OPAL opacities) instead of the “GN93”
composition of Grevesse & Noels (1993), and the OPAL equation of state is used at log T 4 (rather than
at log ρ −2, which corresponds to log T 5.5). The heavy solid line is the reference standard solar model
(no mass loss); the errorbars give the statistical error in the inferred helioseismic profile. Mass-losing cases
are shown for initial solar masses Mi = 1.01 M⊙ (close dot-dashed line), Mi = 1.02 M⊙ (wide dot-dashed
line), Mi = 1.03 M⊙ (heavy dotted line), Mi = 1.04 M⊙ (double-dotted line), Mi = 1.05 M⊙ (triple-dotted
line), Mi = 1.06 M⊙ (quadruple-dotted line), and Mi = 1.07 M⊙ (heavy dashed line). The filled circles
(connected by light solid line) show the range of variation in δc/c found to arise from reasonable variations
in solar initial parameters, from our companion paper “Our Sun IV” (Boothroyd & Sackmann 2002).
– 14 –
input parameters (i.e., variations allowed by the quoted uncertainties). In the comvective envelope, the
largest effects on the sound speed profile arises from the uncertainties in the observed solar radius and in the
equation of state; in the bulk of the solar interior, the largest effects arise from uncertainties in the observed
solar surface composition; in the core, the largest effect arises from the uncertainty in the pp nuclear reaction
rate (Boothroyd & Sackmann 2002).
Figure 2a, d demonstrates that all of our “exponential” mass loss models agree better with the he-
lioseismic observations than the standard solar model, which has no mass loss (i.e., they lie closer to the
zero line of perfect agreement). However, this improvement is clearly not significant: even for our most
extreme “exponential” mass loss case (with Mi = 1.07 M⊙), the effect is only about one third as large as
the maximum effect allowed by variations in other input solar parameters (also shown in Fig. 2).
The rms sound speed differences provide a numerical measure of the extent of the above agreement
between a given theoretical model and the profile inferred from helioseismic observations; these rms values
for each of our mass-losing cases are given in Table 1 (for completeness, the fine-zoned cases are presented as
well as the coarse-zoned ones, although the latter proved to be quite accurate enough, as discussed in § 2.2).
The differences rms{δc/c} relative to the helioseismic sound speed profile are shown both for the entire Sun
and for the region r < 0.6 R⊙ (where the latter region excludes the peak near r ∼ 0.7 R⊙ that results from
neglect of rotation-induced mixing, and the envelope which is sensitive mostly to the solar radius and the
equation of state); unlike the sound speed, the density profile does not respond in a localized way to local
variations in the solar models, so only the rms{δρ/ρ} over the entire Sun is shown. The differences rms{∆c/c}
(and rms{∆ρ/ρ}) relative to the corresponding theoretical standard (non-mass-losing) solar model are shown
for the entire Sun, since they measure the differential effects of mass loss.
Table 1 shows that the “exponential” Mi = 1.07 M⊙ cases have rms{δc/c} errors about 30% smaller
than the corresponding standard solar models, but again this difference is not significant compared to the
large variations that can arise from uncertainties in the other input solar parameters (shown in the last line
of Table 1). This is perhaps most easily seen by comparing the relative rms measures: the “exponential”
cases differ by rms{∆c/c} 0.0007 from their corresponding standard solar model, while the shifts in the
sound speed profile from uncertainties in other input parameters can be as large as rms{∆c/c} ∼ 0.0018,
nearly three times as large.
In summary, none of our “exponential” mass loss cases with initial solar masses Mi ≤ 1.07 M⊙ can be
ruled out by helioseismological observations; in fact, all other things being equal, these helioseismological
observations slightly favor the “exponential” mass loss case with highest of our initial solar masses (Mi =
1.07 M⊙), although this is not statistically significant, as shown by Figure 2a, d and the rms values in
Table 1.
Detailed investigation of the effects of the semi-empirical mass loss law ˙M ∝ t−2.00±0.52
recently pre-
sented by Wood et al. (2002) and discussed in § 1.1.2 above must wait for a future paper (A. I. Boothroyd &
I.-J. Sackmann, in preparation). However, the total amount of mass lost by the Sun would be comparable to
or smaller than that in our “exponential” mass loss case, and the evolution of the mass loss rate as a function
of time would be not too dissimilar (in both cases, most of the mass loss occurs at quite early times). Thus
a t−2
mass loss case should yield an effect on the solar sound speed profile similar to (or smaller than) that
of our “exponential” mass loss cases of Figure 2a, d.
Figure 2b presents our results for our “step-function” mass loss models; recall that this type of mass
loss was chosen as the most extreme possibility that remains consistent with all the observational mass
loss constraints (see § 2.1). Since the Sun remains more massive for a longer period in this case than for
– 15 –
0.99
1
1.01
1.02
1.03
1.04
1.05
1.06
1.07
-4.5 -4 -3.5 -3 -2.5 -2 -1.5 -1 -0.5 0
SolarMass(relativetopresent)
time (Gyr before present)
(a)Exponential mass loss cases
Mi = 1.07 MO•
Mi = 1.06 MO•
Mi = 1.05 MO•
Mi = 1.04 MO•
Mi = 1.03 MO•
Mi = 1.02 MO•
Mi = 1.01 MO•
Mi = 1.00 MO•
0.99
1
1.01
1.02
1.03
1.04
1.05
1.06
1.07
-4.5 -4 -3.5 -3 -2.5 -2 -1.5 -1 -0.5 0
SolarMass(relativetopresent)
time (Gyr before present)
(b)Step-function mass loss cases
Mi = 1.07 MO•
Mi = 1.06 MO•
Mi = 1.05 MO•
Mi = 1.04 MO•
Mi = 1.03 MO•
Mi = 1.02 MO•
Mi = 1.01 MO•
Mi = 1.00 MO•
0.99
1
1.01
1.02
1.03
1.04
1.05
1.06
1.07
-4.5 -4 -3.5 -3 -2.5 -2 -1.5 -1 -0.5 0
SolarMass(relativetopresent)
time (Gyr before present)
(c)Linear mass loss cases
Mi = 1.07 MO•
Mi = 1.06 MO•
Mi = 1.05 MO•
Mi = 1.04 MO•
Mi = 1.03 MO•
Mi = 1.02 MO•
Mi = 1.01 MO•
Mi = 1.00 MO•
Fig. 3.— Solar mass as a function of time for (a) exponential, (b) step-function, and (c) linear mass loss
cases.
the “exponential” mass loss cases (compare Fig. 3b with Fig. 3a), there is more of an impact on the Sun’s
internal structure (compare Fig. 2b with Fig. 2a). Again, the mass-losing models with higher initial masses
fit slightly (but not significantly) better than the standard non-mass-losing model, as shown by Figure 2b
and the rms values in Table 1. Even our most extreme “step-function” case (Mi = 1.07 M⊙) differs from the
standard solar model by an rms{∆c/c} 0.0010, as compared to 0.0018 from other uncertainties. As in the
“exponential” mass loss case, none of the “step-function” mass loss cases can be ruled out by helioseismic
observations.
Figure 2c presents our results for the radical “linear” mass loss models; recall that these models violate
the solar wind constraints from the lunar rock observations by about an order of magnitude (see § 2.1).
Since the Sun remains remains more massive for a very long time compared to the other mass loss cases
(compare Fig. 3c with Fig. 3a, b), there is even more of an impact on the Sun’s internal structure (compare
Fig. 2c with Fig. 2a, b). Intermediate Mi values have the lowest rms{∆c/c} values, though again none
of the differences are significant; but the most extreme “linear” Mi = 1.07 M⊙ differs from the standard
solar model by rms{∆c/c} ∼ 0.0016, nearly as large as the largest effect of 0.0018 from other uncertainties.
Even these radical “linear” mass loss cases cannot yet be ruled out by comparisons with the helioseismic
observations.
– 16 –
3.1.2. Position of Convection and Surface Helium Abundance
Helioseismic observations measure the position of the base of the Sun’s convective envelope, namely
Rce = 0.713±0.001 R⊙ (Basu & Antia 1997), and the surface helium abundance, namely, a mass fraction Ye ≈
0.245 ± 0.005 (see discussion in our companion paper “Our Sun IV”: Boothroyd & Sackmann 2002). The
values of Rce and Ye for both our reference standard solar model and for all of our mass-losing models are
shown in Table 1. The mass-losing cases all have values of Rce and Ye very close to those of the standard
solar model, all of them being consistent with the helioseismic observations.
3.2. Other Effects of Modest Mass Loss
3.2.1. Solar Lithium Depletion
The lithium depletion in a main sequence star, relative to its initial lithium abundance, can result from
three different causes. (1) There can be significant lithium depletion from pre-main-sequence lithium burning
at early times, when the convective envelope reaches deep into the star. (2) Rotationally induced mixing
on the main sequence can transport lithium down from the convective envelope to regions hot enough for
lithium burning. (3) Mass loss on the main sequence can cause the convective envelope to move inwards and
engulf lithium-depleted regions.
The Sun’s initial lithium abundance is assumed to be equal to the meteoritic abundance, and the deple-
tion factor fLi is obtained by comparing this initial abundance with the present observed solar photospheric
lithium abundance. This observed solar lithium depletion factor is fLi = 160 ± 40 (Grevesse & Sauval 1998).
For pre-main-sequence lithium depletion, our reference standard solar model predicts a lithium depletion
factor of fLi ∼ 24, although this is very sensitive to the solar metallicity (i.e., Z/X value, as well as uncer-
tainties in diffusion) and to the choice of low-temperature molecular opacities; values of fLi from 11 to 70 can
be obtained (see our companion paper “Our Sun IV”: Boothroyd & Sackmann 2002). For rotation-induced
main sequence lithium depletion, there is no theoretical prediction; instead, the observed main sequence
lithium depletion is used to constrain the free parameters in the theoretical treatment (see, e.g., Schatzman
1977; Lebreton & Maeder 1987; Pinsonneault et al. 1989; Charbonnel et al. 1992; Richard et al. 1996). For
main sequence mass loss, the extent of main sequence lithium depletion depends primarily on the initial
solar mass, and only weakly on the timescale of mass loss. Boothroyd et al. (1991) used the observed solar
lithium depletion to obtain a limit on solar main sequence mass loss, finding that the maximum mass loss
allowed was 0.1 M⊙ (i.e., a maximum initial solar mass of Mi ≈ 1.1 M⊙). However, as discussed in § 1,
such an extreme mass loss case violates the constraint from the requirement that the early Earth not lose
its water via a moist greenhouse effect, which would occur for Mi > 1.07 M⊙. This constraint is based on a
cloud-free climate model; a very slight increase in Mi might be allowed if clouds were taken into account.
As the Sun’s initial mass is increased above 1 M⊙, there are two competing effects. Higher initial
masses have less pre-main-sequence lithium depletion; on the other hand, the higher the initial mass, the
more mass loss has to take place, and thus the more lithium depletion takes place on the main sequence (as
the convective envelope sheds lithium-rich material from the surface and engulfs lithium-depleted material
from below). As may be seen from Table 1, for initial solar masses in the range 1.01 M⊙ ≤ Mi 1.04 M⊙,
the first of these effects dominates, and the total lithium depletion is slightly less than in the standard
(non-mass-losing) model; slightly stronger rotation-induced mixing would be required in order to account for
the observed lithium depletion. For masses Mi 1.05 M⊙, the mass loss dominates; however, even for our
– 17 –
most extreme mass loss cases (Mi = 1.07 M⊙), the total lithium depletion (from pre-main-sequence burning
plus mass loss effects) is only fLi ∼ 30 − 50. This is at most factor of 2 more lithium depletion than in the
standard (non-mass-losing) model with fLi ∼ 24.
The modest amount of mass loss considered here (∆M ≤ 0.07 M⊙) has only a minor effect on the
extent of solar lithium depletion — adding even the maximum possible mass loss only increases the lithium
depletion by a factor of 2, relative to the depletion on the pre-main-sequence. This effect is smaller than
the factor-of-2.5 effects on pre-main-sequence lithium depletion caused by uncertainties in other physical
parameters, as discussed above and in our companion paper “Our Sun IV” (Boothroyd & Sackmann 2002).
In these mass-losing models, rotational mixing would still be required, to account for the majority of the Sun’s
main-sequence lithium depletion; therefore the arguments of Swenson et al. (1994) (who showed that mass
loss could not be responsible for the majority of the observed Hyades lithium depletion) are not applicable, as
discussed in § 1.1.3. The observed solar lithium depletion thus cannot be used to constrain these mass-losing
solar models.
3.2.2. Solar Beryllium Depletion
The observed solar beryllium abundance is log ε(9
Be) = 1.40±0.09, consistent with no depletion relative
to the meteoritic value of log ε(9
Be) = 1.42 ± 0.04. The uncertainties given for these values imply that solar
beryllium cannot have been depleted by more than a factor of 2 (3-σ upper limit). A standard solar model
has negligible beryllium depletion (∼ 1%); our mass-losing solar models predict slightly larger depletions, but
are still all consistent with the observational limit. The most extreme of the “exponential” mass loss cases
(Mi = 1.07 M⊙) depleted beryllium by a relatively small amount (a factor of 1.17). Even the most extreme
of the “step-function” and “linear” mass loss cases yielded only ∼ 2-σ beryllium depletion factors (of 1.53
and 1.63, respectively); the Mi = 1.04 M⊙ cases depleted beryllium by negligible amounts, less than 3%. In
other words, all the mass losing cases deplete beryllium by significantly less than the observational upper
limit of a factor of 2.
3.2.3. Neutrino Fluxes
As may be seen from Table 1, the modest mass loss considered here has almost no effect on the predicted
solar neutrino fluxes. Variations are at most a few percent in the predicted 8
B flux and in the predicted
capture rate for the chlorine experiment (as compared to uncertainties of ∼ 30% from other causes), and less
than a percent in the predicted capture rate for the gallium experiment (as compared to uncertainties of at
least several percent from other causes) — the other sources of uncertainty in neutrino fluxes are discussed
elsewhere (see, e.g., Bahcall et al. 1995, 2001; Boothroyd & Sackmann 2002).
3.3. The Young Earth and the Solar Flux
At present, an airless, rapidly-rotating body at Earth’s orbit would have a temperature of −18◦
C
(255 K), if it had Earth’s present albedo and emissivity (Sagan & Chyba 1997), but the Earth’s present mean
surface temperature is observed to be +15◦
C (288 K). In other words, at present the greenhouse effect raises
Earth’s surface temperature by 33◦
C. The main greenhouse gases in the Earth’s atmosphere are CO2 and
– 18 –
H2O. If the atmospheric CO2 abundance were constant (at its present value), and the H2O abundance were
determined by its equilibrium vapor pressure, then 2 Gyr ago the Earth’s surface temperature would have
been below 0◦
C (Sagan & Mullen 1972; Sagan 1977; Pollack 1979). If the early Earth’s surface temperature
were below the freezing point of water, extensive glaciation would be expected; such glaciation would raise
the Earth’s albedo, delaying the time when the surface temperature reached 0◦
C. In other words, one would
expect Earth to be fully glaciated as recently as 1 Gyr in the past (North 1975; Wang & Stoner 1980).
On the other hand, a number of independent observations indicate that the Earth was at least warm
enough for liquid water to exist as far back as 4 Gyr ago. Sedimentary rocks, which are laid down under
water, have been dated to at least 4 Gyr ago (Bowring et al. 1989; Nutman et al. 1984). Liquid water is
necessary to explain the existence of the widespread microorganisms whose fossils are found in rocks dated
as far back as 3.8 Gyr ago (Cogley & Henderson-Sellers 1984; Mojzsis et al. 1996; Eiler et al. 1997). Tidal
or intertidal stromatolite fossils have been dated to ∼ 3.5 Gyr ago, alluvial detrital uraninite grains as far
back as 3 Gyr, and turbidites and ripple marks have been dated as far back as 3.5 Gyr (Eriksson 1982).
In fact, there is evidence not only that liquid water existed on the early Earth, but also that Earth
was considerably warmer in the past than it is today. To start with, there is no evidence of glaciation
before 2.7 Gyr ago (Kasting 1989), and it has been suggested that tillites prior to 2 Gyr ago are actually
due to impacts rather than glaciers (Oberbeck et al. 1993). Archaeobacteria exhibit extreme thermophilic
trends (Woese 1987). High ocean temperatures of ∼ 40◦
C in the period 2.6 to 3.5 Gyr ago are suggested
by sulphur isotope measurements (Ohmotu & Felder 1987). Average surface temperatures of tens of degrees
Celsius in the period 2.5 to 3.5 Gyr ago are indicated by deuterium to 18
O ratios (Knauth & Epstein 1976).
Temperatures as high as 80◦
C in the period ∼ 3.8 Gyr ago are suggested by differences in 18
O isotopic
data between coexisting cherts and phosphates (Karhu & Epstein 1986), although the results are subject to
interpretation.
The above “weak Sun paradox”, of a faint young Sun and a young Earth warm enough for liquid water,
has traditionally been explained by invoking a much stronger greenhouse effect for ancient Earth. This
would be driven by extremely high (i.e., non-constant) CO2 concentrations in Earth’s early atmosphere, with
partial CO2 pressures between 0.2 and 10 bars 4.5 Gyr ago (Pollack 1979; Kuhn & Kasting 1983; Kasting
& Ackerman 1986; Kasting 1987). Qualitatively, high CO2 concentrations can be justified on the basis of
theoretical feedback mechanisms linking mineral dissolution to liquid water and thus to atmospheric CO2
(Walker, Hays, & Kasting 1981). Although such massive amounts of CO2 in the Earth’s early atmosphere are
a possible solution to the “weak Sun paradox”, they are not mandated; there is little experimental evidence
available on which to base a choice of CO2 concentration (Canuto et al. 1983; Kuhn, Walker, & Marshall
1989). Indeed, very high concentrations may prove to be inconsistent with derived weathering rates (Holland,
Lazar, & McCaffrey 1986). The recent work of Rye et al. (1995) places an upper limit of 0.04 bar on the
partial pressure of CO2 in the period from 2.75 to 2.2 Gyr ago, based on the absence of siderite in paleosols;
earlier work by Holland & Zbinden (1986) estimated a partial pressure of CO2 of 0.004 bar, but with the
same upper limit of 0.04 bar. For Earth surface temperatures between 5 and 20◦
C during that period,
climate models predict a partial pressure of CO2 between 0.03 and 0.3 bar (Kasting 1987), barely consistent
with the upper limit of 0.04 bar. In other words, there is little evidence for a strong CO2 greenhouse effect
on ancient Earth.
Actual measurements of CO2 abundances are available only for relatively recent times, i.e., only for
the last ∼ 0.45 Gyr (see, e.g., Crowley & Berner 2001; Retallack 2001). These latter measurements show
major variations in the CO2 abundance over the past 0.45 Gyr. The lowest values are comparable to the
present-day CO2 abundance of about 350 ppmV, namely, 0.00035 bar (or the pre-industrial-age value of
– 19 –
∼ 300 ppmV — note that “ppmV” refers to parts per million by volume); the highest values measured over
the last 0.45 Gyr are ∼ 5000 ppmV. However, from these measurements, there is no clear evidence of a
long-term trend of higher CO2 abundances in the relatively recent past (i.e., the last 0.4 Gyr).
A non-CO2 greenhouse has been suggested for the early Earth (Kasting 1982; Lovelock 1988). Recently,
Sagan & Chyba (1997) calculated that a strong greenhouse contribution from ammonia was possible, if a
concentration of [NH3] ∼ 10−5
could be maintained. Normally, the ammonia would be photodissociated by
solar UV flux on a timescale of 10 years. They pointed out that ammonia could be shielded from the UV
radiation by high-altitude organic solids produced from photolysis of methane — a photochemical smog,
similar to that observed in the upper atmosphere of Titan (Ragas & Pollack 1980). However, the ammonia
lifetime depends sensitively on two parameters, the fraction f of the methane irradiation products that are
organic solids, and the sedimentation timescale t of the smog; Sagan & Chyba (1997) take as reasonable
values f 0.1 and 0.5 yr t 3 yr. For f 0.5, or t ∼ 3 yr, the ammonia lifetime is long enough for
the required ammonia concentration to be maintained, given a reasonable amount of resupply. However, for
f ∼ 1 and t 1 yr, the ammonia lifetime is less than 200 yr, which would require excessively large amounts of
ammonia production to maintain the required ammonia greenhouse effect. Sagan & Chyba (1997) also note
that an atmosphere rich in N2, with minor CO2 and CH4 components, could have adequate self-shielding of
NH3 from photodissociation (allowing an ammonia greenhouse), only as long as the ratio CH4/CO2 1 was
maintained. In other words, for the early Earth, a smog-shielded ammonia greenhouse is a viable solution
to the “weak Sun paradox” under certain conditions, but fails under others.
As discussed above, it is not clear whether the greenhouse effect could suffice to warm the early Earth.
A bright young Sun, with stronger illumination of the young Earth than from the standard solar model,
would require a less extreme early greenhouse effect to prevent the early Earth from freezing over.
3.4. The Young Mars and the Solar Flux
For Mars, there are also indications of higher surface temperatures in the past, that are even harder
to explain by a greenhouse effect. There is evidence of large scale flow of liquid water ∼ 3.8 Gyr ago, from
the drainage channels and valley networks visible on the heavily cratered ancient surface of Mars (Pollack
et al. 1987; Carr 1996); there is some evidence for lakes (Goldspiel & Squyres 1991; Parker et al. 1993), and
possibly even oceans 3 to 4 Gyr ago (Schaefer 1990; Baker et al. 1991). Even if the channels were formed by
subsurface sapping of groundwater, Martian surface temperatures significantly higher than today would have
been required for liquid water to be present near the surface; if the suggested evidence of glacial markings
were confirmed, this would require temperatures high enough for precipitation to occur (Whitmire et al.
1995).
Kasting (1991) demonstrated that there is an upper limit to the greenhouse warming of Mars that is
possible from CO2. He showed that the maximum possible greenhouse warming occurs at a Martian surface
CO2 pressure of 5 bars — with more CO2, the added greenhouse warming is outweighed by the cooling effects
of increased CO2 condensation in the upper Martian atmosphere. He demonstrated that the requirement of
liquid water on Mars, i.e., a surface temperature of at least 273◦
K, demands a solar flux value S ≥ 0.86
(where S is the solar flux relative to its present value), even with the most favorable greenhouse warming
case of a CO2 pressure of 5 bars. At 3.8 Gyr ago, when liquid water is thought to have existed on Mars,
the standard solar model yields a value of S = 0.75 (see Fig. 4), totally insufficient relative to Kasting’s
minimum value of 0.86. Kasting (1991) states that the uncertainties in his Martian climate model might
– 20 –
push the limiting value of S from 0.86 down to 0.80 (albeit for an unreasonably low Martian albedo), but
even this lower S requirement is incompatible with the standard solar model. The standard solar model
does not reach this extreme limit of S = 0.80 until 2.9 Gyr ago, and reaches S = 0.86 later still, at 1.9 Gyr
ago (see Fig. 4) — in either case, far too late to account for liquid water on Mars 3.8 Gyr ago. With CO2
pressures either lower or higher than 5 bar, Kasting (1991) shows that even higher solar flux values would
be required to yield liquid water. He presents the solar flux required to obtain liquid water as a function of
the CO2 pressure: e.g., a pressure of 3 bar would require S 0.92, and a pressure of 10 bar would require
S 0.90. The standard solar model is totally incapable of yielding such high fluxes 3.8 Gyr ago (see Fig. 4).
In other words, for a standard solar model, CO2 greenhouse warming cannot under any circumstances yield
liquid water on early Mars.
A preliminary study by Yung, Nair, & Gerstell (1997) suggested the possibility that relatively small
amounts of atmospheric SO2 (∼ 10−7
bar) might have served as a powerful source of heating in the upper
atmosphere of early Mars (due to its strong absorption in the near UV), which might have been sufficient
to prevent the condensation of CO2 (though they noted that SO2 in the presence of liquid water would
produce H2SO4, which would lead to some countervailing cooling). Murphy & Bass (1998) pointed out a
more important effect of the H2SO4: even ∼ 10−11
bar of SO2 in the Martian atmosphere, 4 orders of
magnitude less than proposed by Yung et al. (1997), would result in a pH acidic enough to attack solid rocks
and precipitate gypsum (CaSO4*2H2O), removing the SO2 from the atmosphere.
Some temperature increase on early Mars is expected from geothermal heating (Squyres 1993), but by
itself it is insufficient (Whitmire et al. 1995).
With the above greenhouse and geothermal heating apparently incapable of yielding liquid water on
early Mars, given the illumination from a standard solar model, let us consider the possibility of a non-
standard, brighter young Sun. Figure 4 presents the relative flux values S throughout the Sun’s past history
yielded by our mass-losing solar models with initial masses from Mi = 1.01 to 1.07 M⊙ (as well as that from
a standard solar model). The requirement that the early Earth not lose its water via a moist greenhouse
effect leads to an upper limit of S ≤ 1.1, corresponding to the upper edge of the figures. The lower luminosity
constraints from the requirement that liquid water be present 3.8 Gyr ago on early Mars are shown by the
vertical arrows; the heavy double arrow corresponds to the limit S ≥ 0.86 obtained by Kasting (1991), and
the lighter single arrow to his extreme (less probable) limit S ≥ 0.80.
Figure 4a presents the solar flux S at Earth and Mars (relative to their present flux) from the time of
solar system formation until the present, for our “exponential” mass loss cases; the flux for the standard solar
model (without mass loss) is also shown, by the solid line. Note that the mass loss time scale is between
0.755 and 0.551 Gyr, with initial mass loss rates from 1.33 × 10⁻¹¹
to 1.27 × 10⁻¹⁰
M⊙ yr−1
, for initial
masses from 1.01 to 1.07 M⊙, respectively. The exponential decline as a function of time of these mass
loss rates means that they are generally consistent with the observations of π01
UMa, κ1
Cet, and β Com
presented by Gaidos et al. (2000), who obtained upper limits of 5×10⁻¹¹
, 4×10⁻¹¹
, and 4×10⁻¹¹
M⊙ yr−1
,
respectively, for the mass loss rates of these three young Sun-like stars (note that the Mi = 1.07 M⊙ case is
only marginally consistent, lying very slightly above the π01
UMa limit: see Fig. 1). Our results demonstrate
that, for the “exponential” mass loss cases, the Mi = 1.07 M⊙ case — and only this case — is marginally
consistent with the Kasting (1991) Mars flux requirement S 0.86 at an age of ∼ 3.8 Gyr ago; if the Martian
surface CO2 pressure 3.8 Gyr ago was either much lower or much higher than 5 bar, even the Mi = 1.07 M⊙
case would be ruled out. (If the unlikely extreme Kasting flux limit of S 0.80 is used, initial masses
1.03 M⊙ Mi 1.07 M⊙ would be permissible for a CO2 pressure of 5 bars, and the Mi = 1.07 M⊙ case
would be marginally compatible with pressures between ∼ 3 and ∼ 12 bar.)
– 21 –
0.7
0.75
0.8
0.85
0.9
0.95
1
1.05
1.1
-4.5 -4 -3.5 -3 -2.5 -2 -1.5 -1 -0.5 0
SolarFluxatEarthorMars(relativetopresent)
time (Gyr before present)
Marslimits
1.07
1.00
(a)Exponential mass loss cases
Mi = 1.07 MO•
Mi = 1.06 MO•
Mi = 1.05 MO•
Mi = 1.04 MO•
Mi = 1.03 MO•
Mi = 1.02 MO•
Mi = 1.01 MO•
Mi = 1.00 MO• 0.7
0.75
0.8
0.85
0.9
0.95
1
1.05
1.1
-4.5 -4 -3.5 -3 -2.5 -2 -1.5 -1 -0.5 0
SolarFluxatEarthorMars(relativetopresent)
time (Gyr before present)
1.07
1.00
(b)Step-function mass loss cases
Mi = 1.07 MO•
Mi = 1.06 MO•
Mi = 1.05 MO•
Mi = 1.04 MO•
Mi = 1.03 MO•
Mi = 1.02 MO•
Mi = 1.01 MO•
Mi = 1.00 MO•
0.7
0.75
0.8
0.85
0.9
0.95
1
1.05
1.1
-4.5 -4 -3.5 -3 -2.5 -2 -1.5 -1 -0.5 0
SolarFluxatEarthorMars(relativetopresent)
time (Gyr before present)
1.07
1.00
(c)Linear mass loss cases
Mi = 1.07 MO•
Mi = 1.06 MO•
Mi = 1.05 MO•
Mi = 1.04 MO•
Mi = 1.03 MO•
Mi = 1.02 MO•
Mi = 1.01 MO•
Mi = 1.00 MO•
Fig. 4.— Solar flux at the planets as a function of time (relative to the present flux), for (a) exponential,
(b) step-function, and (c) linear mass loss cases. Heavy double arrows give the lower flux limit of Kasting
(1991) for the presence of water on early Mars; light single arrows give his extreme lower flux limit (for a
model with an unrealistically low Martian surface albedo).
Since the semi-empirical mass loss law ˙M ∝ t−2.00±0.52
recently presented by Wood et al. (2002) is
strongly peaked at early times (as discussed in § 1.1.2), it tends to yield a relatively small solar mass ∼ 3.8 Gyr
ago. A t−2
mass loss relation, normalized by the present solar mass loss rate, would yield M(−3.8 Gyr) ∼
1.001 M⊙; by tweaking parameters to their extreme limits, one might obtain M(−3.8 Gyr) ∼ 1.02 M⊙.
Comparing the flux relations in Figure 4 with the solar mass as a function of time in Figure 2, one can
estimate that a solar mass of M(−3.8 Gyr) 1.018 M⊙ is needed in order to satisfy the Kasting (1991)
Mars flux requirement S(−3.8 Gyr) 0.86. Thus the mass loss formula of Wood et al. (2002) might
possibly be capable of satisfying the Mars flux requirement. This possibility will be tested in a future paper
(A. I. Boothroyd & I.-J. Sackmann, in preparation).
Figure 4b presents the extreme “step-function” mass loss case. This case has a constant mass loss
rate for the first 1.6 Gyr ( ˙M = 5.69 × 10⁻¹²
to 4.32 × 10⁻¹¹
M⊙ yr−1
, for initial solar masses of 1.01 to
1.07 M⊙, respectively), and a low mass loss rate thereafter. These mass loss rates are all consistent with
the stellar mass loss observations of Gaidos et al. (2000) for π01
UMa, κ1
Cet, and β Com quoted above.
These “step-function” cases have a longer mass loss timescale than the “exponential” one, and thus yield a
– 22 –
higher solar flux for the first 1.6 Gyr. (Due to the way the “step-function” cases were defined, after the first
1.6 Gyr their solar flux is very close to that of the standard solar model.) Our results demonstrate that, for
this extreme “step-function” mass loss case, initial masses 1.04 M⊙ Mi 1.07 M⊙ are capable of yielding
liquid water on Mars until 3.8 Gyr ago.
Figure 4c similarly presents the radical “linear” mass loss case. This case has a high initial mass loss rate
( ˙M = 4.35 × 10⁻¹²
to 3.04 × 10⁻¹¹
M⊙ yr−1
, for initial solar masses of 1.01 to 1.07 M⊙, respectively), which
remains relatively high throughout much of the Sun’s lifetime (since it declines linearly with time to reach
the present solar mass loss rate at the present time). These mass loss cases are consistent with the stellar
mass loss observations of Gaidos et al. (2000) for π01
UMa, κ1
Cet, and β Com quoted above. However,
they are not consistent with the lunar rock observations of the solar wind over the past 3 Gyr, violating this
latter constraint by an order of magnitude. Our results demonstrate that, for this radical “linear” mass loss
case, initial masses 1.03 M⊙ Mi 1.07 M⊙ are capable of yielding liquid water on Mars until 3.8 Gyr
ago. The lower end of this range is mildly (but not significantly) favored by the helioseismology; note that
such cases with Mi ∼ 1.04 M⊙ have remarkably constant solar flux over the first 3 Gyr.
3.5. The Favored Cases of a Bright Young Sun
A mass-losing solar model will always be brighter at birth than the standard solar model, since the
luminosity LZAMS at the zero age main sequence (ZAMS) is roughly proportional to the mass to the fourth
power (LZAMS ∝ M4
i ). For a mass-losing Sun, the orbital radii of the planets varies inversely with the
solar mass (ri ∝ 1/Mi, due to conservation of angular momentum); the initial flux at the planets is thus
proportional to the sixth power of the initial solar mass (FZAMS ∝ LZAMS/r2
i ∝ M6
i ). Figure 4 illustrates
the solar flux at the planets as a function of time, demonstrating how much higher the early solar flux at
the planets is in the mass-losing cases than in the standard (non-mass-losing) model.
For clarity, only the flux for our “preferred” initial masses for each type of mass loss are illustrated
in Figure 5. Our preferred “exponential” case (with Mi = 1.07 M⊙) predicts a solar flux at the planets
about 5% higher at birth than at present, considerably higher than that indicated by the standard solar
model (which predicts a flux 29% lower than at present). At 3.8 Gyr ago, the flux for our “exponential”
case would have been only 16% lower than at present (cf. 25% for the standard model). For our preferred
“step-function” case (with Mi = 1.04 M⊙), the flux at the planets would have been only 10% lower at birth
than at present (cf. 29% for the standard model); at 3.8 Gyr ago, the flux would have been only 14% lower
than at present (cf. 25% for the standard model). For these “exponential” and “step-function” cases, the flux
at the planets for the past 3 billion years would be essentially the same as that predicted by the standard
solar model. Our radical “linear” case (with Mi = 1.04 M⊙) would have had an almost constant solar flux
at the planets for the first 3 Gyr, namely, only 11% lower than at present (cf. 29% to 12% lower for the
standard model); for this case, the flux would be close to that predicted by the standard solar model only
during the last billion years.
Figure 6 presents the evolution in the HR diagram of our preferred exponential and step-function mass-
losing cases (heavy dashed and dot-dashed curves, respectively); these cases are in agreement with the
helioseismic observations, with the existence of water on early Mars, and with the lunar rock observations
of solar mass loss. (A radical linear case, agreeing with the first two of these constraints but disagreeing
with the third one, is shown by the light dotted curve.) For comparison, the standard solar model is also
displayed (solid line). Figure 6 illustrates that the early evolution of mass-losing solar models is in the
– 23 –
0.7
0.8
0.9
1
-4.5 -4 -3.5 -3 -2.5 -2 -1.5 -1 -0.5 0
time (Gyr before present)
(c) linear
Preferred
SolarFluxatEarthorMars(relativetopresent)
Mi = 1.04 MO•
Mi = 1.00 MO•
0.7
0.8
0.9
1
(b) step-function
Preferred
Mi = 1.04 MO•
Mi = 1.00 MO•
0.7
0.8
0.9
1
(b) step-function
Preferred
0.7
0.8
0.9
1
(b) step-function
Preferred
0.7
0.8
0.9
1
(a) exponential
Preferred
Mi = 1.07 MO•
Mi = 1.00 MO•
0.7
0.8
0.9
1
(a) exponential
Preferred
0.7
0.8
0.9
1
(a) exponential
Preferred
Fig. 5.— Solar flux at the planets (relative to the present flux) as a function of time for our preferred initial
masses, for each type of mass loss that we considered. Heavy double arrows give the lower flux limit of
Kasting (1991) for the presence of water on early Mars; light single arrows give his extreme lower flux limit
(for a model with an unrealistically low Martian surface albedo).
opposite direction in the HR diagram to the standard solar model: the mass-losing models initially become
less luminous and slightly redder (instead of more luminous and slightly bluer). Figure 6 also illustrates
that in the past, the Sun’s surface temperature changed only by negligible amounts (1 or 2%), both for the
standard and the mass losing cases, in contrast to the relatively large changes in the luminosity.
4. Conclusions
A slightly higher initial solar mass, producing a brighter young Sun, turns out to be a viable explanation
for warm temperatures on early Earth and Mars, that otherwise are difficult to account for (particularly for
Mars). Such a higher initial solar mass leaves a fingerprint on the Sun’s present internal structure that is large
enough to be detectable in principle via helioseismic observations. Our computations demonstrated that all
21 of the mass-losing solar models that we considered were consistent with the helioseismic observations; in
fact, our preferred mass-losing cases were in marginally (though not significantly) better agreement with the
helioseismology than the standard solar model was. However, there are still significant uncertainties in the
– 24 –
-0.15
-0.1
-0.05
0
3.7553.763.765
0.7
0.75
0.8
0.85
0.9
0.95
1.0
56505700575058005850
log(L/LO•)
LuminosityL(LO•)
log Te
Effective Temperature Te (K)
1.07 ZAMS
1.04 ZAMS
1.00 ZAMS
present Sun
1.04
1.07
1.04
linear
Preferred mass loss cases
Mi = 1.00 MO• (Standard Sun: no mass loss)
Mi = 1.07 MO• Exponential mass loss
Mi = 1.04 MO• Step-function mass loss
Mi = 1.04 MO• Linear mass loss
Fig. 6.— Evolution in the H-R diagram of the standard solar model, and of our preferred mass loss cases
for each type of mass loss considered. The “ZAMS” points shown are actually ∼ 50 Myr subsequent to the
start of nuclear burning on the main sequence, i.e., the rapid loop due to initial CN-cycle burning is omitted
for clarity.
observed solar composition and in the input physics on which the solar models are based; these uncertainties
have a slightly larger effect on the Sun’s present internal structure than the fingerprint left from early solar
mass loss. Future improvements by a factor of 2 or so in the accuracy of these input parameters could reduce
the size of the uncertainties below the level of the fingerprints left by a more massive, brighter young Sun,
allowing one to determine whether early solar mass loss took place or not. Also urgently needed are more
measurements of mass loss rates from other young stars similar to the young Sun, and more measurements
from our solar system that can be used to estimate the solar wind in the past.
We are indebted to Prof. Marc H. Pinsonneault for helpful discussions on diffusion and for providing
us with his diffusion code. We are grateful to Prof. Sarbani Basu for discussions of helioseismology, and for
providing us with the current helioseismic reference model; we are also grateful to Prof. Dimitri M. Mihalas,
for providing us with his equation-of-state code. We wish to thank Prof. Charles A. Barnes, Prof. Yuk L.
Yung, and Dr. Mimi F. Gerstell for thoughtful discussions and encouragement. We wish to acknowledge
the support provided by Prof. Thomas A. Tombrello, Chairman of the Division of Physics, Math, and
Astronomy, and Prof. Robert D. McKeown, Head of the W. K. Kellogg Radiation Laboratory. One of us
(I.-J. S.) wishes to thank Alexandra R. Christy, her daughter, and Prof. Robert F. Christy, her husband, for
their supportiveness, and Robert F. Christy for critical analysis and helpful comments. One of us (A. I. B.)
wishes to thank Prof. Peter G. Martin and Prof. J. Richard Bond for their support, and M. Elaine Boothroyd,
his wife, for her patience and encouragement. This work was supported by a grant NAG5-7166 from the Sun-
Earth Connection Program of the Supporting Research and Technology and Suborbital Program in Solar
Physics of the National Aeronautics and Space Administration, and by the National Science Foundation
grant NSF-0071856 to the Kellogg Radiation Laboratory.
– 25 –
REFERENCES
Alexander, D. R., & Ferguson, J. W. 1994, ApJ, 437, 879
Angulo, C. et al. 1999, Nucl. Phys. A, 656, 3
Aufderheide, M. B., Bloom, S. B., Resler, D. A., & Goodman, C. D. 1994, Phys. Rev. C, 49, 678
Ayres, T. R. 1997, Geophys. Res., 102, 1641
Bahcall, J. N., Chen, X. L., & Kamionkowski, M. 1998, Phys. Rev. C, 57, 2756
Bahcall, J. N., Pinsonneault, M. H., & Basu, S. 2001, ApJ, 555, 990
Bahcall, J. N., Pinsonneault, M. H., & Wasserburg, G. J. 1995, Rev. Mod. Phys., 67, 781
Bahcall, J. N., & Ulrich, R. K. 1988, Rev. Mod. Phys., 60, 297
Baker, V. R., Strom, R. G., Gulick, V. C., Kargel, J. S., Komatsu, G., & Kale, V. S. 1991, Nature, 352, 589
Balachandran, S. 1995, ApJ, 446, 203
Basu, S., & Antia H. M. 1997, MNRAS, 287, 189
Basu, S., Pinsonneault, M. H., & Bahcall, J. N. 2000, ApJ, 529, 1084
Boothroyd, A. I., & Sackmann, I.-J. 2002, ApJ, in press (Our Sun V)
Boothroyd, A. I., Sackmann, I.-J., & Fowler, W. A. 1991, ApJ, 377, 318
Bowring, S. A., Williams, I. S., & Compston, W. 1989, Geology, 17, 971
Brown, A., Veal´e, A., Judge, P., Bookbinder, J. A., & Hubeny, I. 1990, ApJ, 361, 320
Brun, A. S., Turck-Chi`eze, S., & Zahn, J. P. 1999, ApJ, 525, 1032
Caffee, M., Hohenberg, C., & Swindle, T. 1987, ApJ, 313, L31
Canuto, V. M., Levine, J. S., Augustsson, T. R., Imhoff, C. L., & Giampapa, M. S. 1983, Nature, 305, 281
Carr, M. H. 1996, Water on Mars (New York: Oxford Univ. Press)
Charbonnel, C., Vauclair, S., & Zahn, J.-P. 1992, A&A, 255, 191
Christensen-Dalsgaard, J., & D¨appen, W. 1992, A&A Rev., 4, 267
Cogley, J. G., & Henderson-Sellers, A. 1984, Rev. Geophys. Space Phys., 22, 131
Cohen, E. R., & Taylor, B. N. 1986, Codata Bulletin No. 63 (New York: Pergamon)
Cox, A. N., Guzik, J. A., & Kidman, R. B. 1989, ApJ, 342, 1187
Cox, A. N., & Stewart, J. N. 1970, ApJS, 19, 243
Crowley, T. J., & Berner, R. A. 2001, Science, 292, 870
D¨appen, W., Mihalas, D., Hummer, D. G., & Mihalas, B. 1988, ApJ, 332, 261
– 26 –
Eiler, J. M., Mojzsis, S. J., & Arrhenius, G. 1997, Nature, 386, 665
Eriksson, K. A. 1982, Tectonophysics, 81, 179
Gaidos, E. J., G¨udel, M., & Blake, G. A. 2000, Geophys. Res. Lett., 27, 501
Geiss, J. 1973, in Proc. 13th Intl. Cosmic Ray Conf., vol. 5 (Denver: Univ. of Denver), 3375
Geiss, J., & Bochsler, P. 1991, in The Sun in Time, ed. C. Sonnett, M. Giampapa, & M. Matthews (Tucson:
Univ. Arizona Press), 98
Goldspiel, J., & Squyres, S. W. 1991, Icarus, 89, 392
Grevesse, N., & Noels, A. 1993, in Origin and Evolution of the Elements, ed. N. Prantzos, E. Vangioni-Flam,
& M. Cass´e (Cambridge: Cambridge Univ. Press), 15
Grevesse, N., & Sauval, A. J. 1998, Space Sci. Rev., 85, 161
Gruzinov, A. V., & Bahcall, J. N. 1997, ApJ, 490, 437
Gruzinov, A. V., & Bahcall, J. N. 1998, ApJ, 504, 996
Guenther, D. B. 1989, ApJ, 339, 1156
Guenther, D. B., Demarque, P., Kim, Y.-C., & Pinsonneault, M. H. 1992, ApJ, 387, 372
Guzik, J. A., & Cox, A. N. 1995, ApJ, 448, 905
Guzik, J. A., Willson, L. A., & Brunish, W. M. 1987, ApJ, 319, 957
Hobbs, L. M., & Pilachowski, C. 1988, ApJ, 334, 734
Holland, H. D., Lazar, B., & McCaffrey, M. 1986, Nature, 320, 27
Holland, H. D., & Zbinden, E. A. 1986, Paleosols and the evolution of the atmosphere, Part I., in Physical and
Chemical Weathering in Geochemical Cycles, ed. A. Lerman & M. Meybeck (NATO ASI Institute)
Iben, I., Jr. 1975, ApJ, 196, 546
Iglesias, C. A., & Rogers, F. J. 1996, ApJ, 464, 943
Karhu, J., & Epstein, S. 1986, Geochim. Cosmochim. Acta, 50, 1745
Kasting, J. 1982, J. Geophys. Res., 87, 3091
Kasting, J. 1987, Precambrian Res., 34, 205
Kasting, J. 1988, Icarus, 74, 472
Kasting, J. 1989, Palaeogeogr. Palaeoclimat. Palaeocol., 75, 83
Kasting, J. 1991, Icarus, 94, 1
Kasting, J., & Ackerman, T. P. 1986, Science, 234, 1383
Kasting, J. F., Whitmire, D. P., & Reynolds, R. T. 1993, Icarus, 101, 108
– 27 –
Kerridge, J. F., Signer, P., Wieler, R., Becker, R. H., & Pepin, R. O. 1991, in The Sun in Time, ed. C. Sonnett,
M. Giampapa, & M. Matthews (Tucson: Univ. Arizona Press), 389
Knauth, L. P., & Epstein, S. 1976, Geochim. Cosmochim. Acta, 40, 1095
Kuhn, W. R., & Kasting, J. F. 1983, Nature, 301, 53
Kuhn, W. R., Walker, J. C. G., & Marshall, H. G. 1989, J. Geophys. Res., 94, 11129
Lebreton, Y., & Maeder, A. 1987, A&A, 175, 99
Lovelock, J. 1988, The Ages of Gaia (London: Norton), chap. 4
Michaud, G., & Proffitt, C. R. 1993, in IAU Symp. 137, Inside the Stars, ed. A. Baglin & W. W. Weiss (San
Francisco: ASP), 246
Mojzsis, S. J., Arrhenius, G., McKeegan, K. D., Harrison, T. M., Nutman, A. P., & Friend, C. R. L. 1996,
Nature, 384, 55; —. 1997, Nature, 386, 738 (Erratum)
Morel, P., Provost, J., & Berthomieu, G. 1997, A&A, 327, 349
Murphy, W. M., & Bass, D. S. 1998, BAAS, 30, DPS Abstract 11.03
Neuforge-Verheecke, C., Goriely, S., Guzik, J. A., Swenson, F. J., & Bradley, P. A. 2001, ApJ, 550, 493
North, G. R. 1975, J. Atmos. Sci., 32, 2033
Nutman, A. P., Allaart, J. H., Bridgwater, D., Dimroth, E., & Rosing, M. 1984, Precambrian Res., 25, 365
Oberbeck, V. R., Marshall, J. R., & Aggarwal, H. R. 1993, J. Geol., 101, 1
Ohmotu, H., & Felder, R. P. 1987, Nature, 328, 244
Parker, T. J., Gorsline, D. S., Saunders, R. S., Pieri, D. C., & Schneeberger, D. M. 1993, J. Geophys. Res.,
95, 11061
Pinsonneault, M. H., Kawaler, S. D., Sofia, S., & Demarque, P. 1989, ApJ, 338, 424
Pollack, J. B. 1979, Icarus, 37, 479
Pollack, J. B., Kasting, J. F., Richardson, S. M., & Poliakoff, K. 1987, Icarus, 71, 203
Proffitt, C. R., & Michaud, G. 1991, ApJ, 380, 238
Ragas, K., & Pollack, J. B. 1980, Icarus, 41, 119
Retallack, G. J. 2001, Nature, 411, 287
Richard, O., Vauclair, S., Charbonnel, C., & Dziembowski, W. A. 1996, ApJ, 312, 1000
Rogers, F. J., & Iglesias, C. A. 1992, ApJS, 79, 507
Rogers, F. J., Swenson, F. J., & Iglesias, C. A. 1996, ApJ, 456, 902
Rye, R., Kuo, P. H., & Holland, H. D. 1995, Nature, 378, 603
Sackmann, I.-J., Boothroyd, A. I., & Kraemer, K. E. 1993, ApJ, 418, 457
– 28 –
Sagan, C. 1977, Nature, 269, 224
Sagan, C., & Chyba, C. 1997, Science, 276, 1217
Sagan, C., & Mullen, G. 1972, Science, 177, 52
Salpeter, E. E. 1955, ApJ, 121, 161
Schaefer, M. W. 1990, J. Geophys. Res., 95, 14291
Schatzman, E. 1977, A&A, 56, 211
Squyres, S. 1993, MSATT LPI Workshop on Early Mars: How Warm and How Wet?, LPI Tech. Report
No. 93-03, Part 1
Swenson, F. J., & Faulkner, J. 1992, ApJ, 395, 654
Swenson, F. J., Faulkner, J., Iglesias, C. A., Rogers, F. J., & Alexander, D. R. 1994, ApJ, 422, L79
Thoul, A. A., Bahcall, J. N., & Loeb, A. 1994, ApJ, 421, 828
Turck-Chi`eze, S., Nghiem, P, Couvidat, S., & Turcotte, S. 2001, Sol. Phys., 200, 323
Ulrich, R. K., & Rhodes, E. R., Jr. 1983, ApJ, 265, 551
Walker, J. C. G., Hays, P. B., & Kasting, J. F. 1981, J. Geophys. Res., 86, 9776
Wang, W. C., & Stoner, P. H. 1980, J. Atmos. Sci., 37, 545
Whitmire, D. P., Doyle, L. R., Reynolds, R. T., & Matese, J. J. 1995, J. Geo. Res. Planets, 100, 5457
Willson, L. A., Bowen, G. H., & Struck-Marcel, C. 1987, Comm. Ap., 12, 17
Woese, C. 1987, Microbiol. Rev., 51, 221
Wood, B. E., & Linsky, J. L. 1998, ApJ, 492, 788
Wood, B. E., Linsky, J. L., M¨uller, H.-R., & Zank, G. P. 2001, ApJ, 547, L49
Wood, B. E., M¨uller, H.-R., Zank, G. P., & Linsky, J. L. 2002, ApJ, 574, 412
Yung, Y. L., Nair, H., & Gerstell, M. F. 1997, Icarus, 130, 222
This preprint was prepared with the AAS LATEX macros v5.0.
 Our Sun. V. A Bright Young Sun Consistent with Helioseismology and Warm Temperatures on Ancient Earth and Mars
 Our Sun. V. A Bright Young Sun Consistent with Helioseismology and Warm Temperatures on Ancient Earth and Mars

More Related Content

What's hot

AGM2015: Antineutrino Global Map 2015
AGM2015: Antineutrino Global Map 2015AGM2015: Antineutrino Global Map 2015
AGM2015: Antineutrino Global Map 2015
Sérgio Sacani
 
Relativistic collapse and explosion of rotating supermassive stars with therm...
Relativistic collapse and explosion of rotating supermassive stars with therm...Relativistic collapse and explosion of rotating supermassive stars with therm...
Relativistic collapse and explosion of rotating supermassive stars with therm...
Sérgio Sacani
 
BlauveltSpaceAndEnergy
BlauveltSpaceAndEnergyBlauveltSpaceAndEnergy
BlauveltSpaceAndEnergy
Erin Blauvelt
 
T he effect_of_orbital_configuration)_on_the_possible_climates_and_habitabili...
T he effect_of_orbital_configuration)_on_the_possible_climates_and_habitabili...T he effect_of_orbital_configuration)_on_the_possible_climates_and_habitabili...
T he effect_of_orbital_configuration)_on_the_possible_climates_and_habitabili...
Sérgio Sacani
 
Jack Oughton - Galaxy Formation Journal 02.doc
Jack Oughton - Galaxy Formation Journal 02.docJack Oughton - Galaxy Formation Journal 02.doc
Jack Oughton - Galaxy Formation Journal 02.doc
Jack Oughton
 

What's hot (20)

Iesc110
Iesc110Iesc110
Iesc110
 
Study of Solar Interplanetary and Geomagnetic Disturbances in Solar Cycle 23
Study of Solar Interplanetary and Geomagnetic Disturbances in Solar Cycle 23Study of Solar Interplanetary and Geomagnetic Disturbances in Solar Cycle 23
Study of Solar Interplanetary and Geomagnetic Disturbances in Solar Cycle 23
 
Lunar tungsten isotopic_evidence_for_the_late_veneer
Lunar tungsten isotopic_evidence_for_the_late_veneerLunar tungsten isotopic_evidence_for_the_late_veneer
Lunar tungsten isotopic_evidence_for_the_late_veneer
 
A study on severe geomagnetic storms and earth’s magnetic field H variations,...
A study on severe geomagnetic storms and earth’s magnetic field H variations,...A study on severe geomagnetic storms and earth’s magnetic field H variations,...
A study on severe geomagnetic storms and earth’s magnetic field H variations,...
 
9 gravitation
9   gravitation9   gravitation
9 gravitation
 
AGM2015: Antineutrino Global Map 2015
AGM2015: Antineutrino Global Map 2015AGM2015: Antineutrino Global Map 2015
AGM2015: Antineutrino Global Map 2015
 
The Physics of Gas Sloshing in Galaxy Clusters
The Physics of Gas Sloshing in Galaxy ClustersThe Physics of Gas Sloshing in Galaxy Clusters
The Physics of Gas Sloshing in Galaxy Clusters
 
Relativistic collapse and explosion of rotating supermassive stars with therm...
Relativistic collapse and explosion of rotating supermassive stars with therm...Relativistic collapse and explosion of rotating supermassive stars with therm...
Relativistic collapse and explosion of rotating supermassive stars with therm...
 
Einstein lecture on big bang cosmology
Einstein lecture on big bang cosmologyEinstein lecture on big bang cosmology
Einstein lecture on big bang cosmology
 
Caltech Physics Colloquium
Caltech Physics ColloquiumCaltech Physics Colloquium
Caltech Physics Colloquium
 
BlauveltSpaceAndEnergy
BlauveltSpaceAndEnergyBlauveltSpaceAndEnergy
BlauveltSpaceAndEnergy
 
Einstein lecture on big bang cosmology
Einstein lecture on big bang cosmologyEinstein lecture on big bang cosmology
Einstein lecture on big bang cosmology
 
Lecture on Gravity
Lecture on Gravity Lecture on Gravity
Lecture on Gravity
 
Digital text
Digital textDigital text
Digital text
 
The nonmagnetic nucleus_of_comet_67_p_churyumov_gerasimenko
The nonmagnetic nucleus_of_comet_67_p_churyumov_gerasimenkoThe nonmagnetic nucleus_of_comet_67_p_churyumov_gerasimenko
The nonmagnetic nucleus_of_comet_67_p_churyumov_gerasimenko
 
Magma oceans and enhanced volcanism on TRAPPIST-1 planets due to induction he...
Magma oceans and enhanced volcanism on TRAPPIST-1 planets due to induction he...Magma oceans and enhanced volcanism on TRAPPIST-1 planets due to induction he...
Magma oceans and enhanced volcanism on TRAPPIST-1 planets due to induction he...
 
robcflux
robcfluxrobcflux
robcflux
 
T he effect_of_orbital_configuration)_on_the_possible_climates_and_habitabili...
T he effect_of_orbital_configuration)_on_the_possible_climates_and_habitabili...T he effect_of_orbital_configuration)_on_the_possible_climates_and_habitabili...
T he effect_of_orbital_configuration)_on_the_possible_climates_and_habitabili...
 
Jack Oughton - Galaxy Formation Journal 02.doc
Jack Oughton - Galaxy Formation Journal 02.docJack Oughton - Galaxy Formation Journal 02.doc
Jack Oughton - Galaxy Formation Journal 02.doc
 
CLASS XI - Chapter 9 optics (MAHARASHRA STATE BOARD)
CLASS XI - Chapter 9   optics  (MAHARASHRA STATE BOARD)CLASS XI - Chapter 9   optics  (MAHARASHRA STATE BOARD)
CLASS XI - Chapter 9 optics (MAHARASHRA STATE BOARD)
 

Similar to Our Sun. V. A Bright Young Sun Consistent with Helioseismology and Warm Temperatures on Ancient Earth and Mars

Highly siderophile elements_in_earth_mantle_as_a_clock_for_the_moon_forming_i...
Highly siderophile elements_in_earth_mantle_as_a_clock_for_the_moon_forming_i...Highly siderophile elements_in_earth_mantle_as_a_clock_for_the_moon_forming_i...
Highly siderophile elements_in_earth_mantle_as_a_clock_for_the_moon_forming_i...
Sérgio Sacani
 
Interior Heating of Rocky Exoplanets from Stellar Flares with Application to ...
Interior Heating of Rocky Exoplanets from Stellar Flares with Application to ...Interior Heating of Rocky Exoplanets from Stellar Flares with Application to ...
Interior Heating of Rocky Exoplanets from Stellar Flares with Application to ...
Sérgio Sacani
 
Mars surface radiation_environment_measured_with_curiosity
Mars surface radiation_environment_measured_with_curiosityMars surface radiation_environment_measured_with_curiosity
Mars surface radiation_environment_measured_with_curiosity
Sérgio Sacani
 
Climatic consequences of regional nuclear conflicts
Climatic consequences of regional nuclear conflictsClimatic consequences of regional nuclear conflicts
Climatic consequences of regional nuclear conflicts
27Nav
 
Theory of Planetary System Formation The mass of the presol.pdf
Theory of Planetary System Formation The mass of the presol.pdfTheory of Planetary System Formation The mass of the presol.pdf
Theory of Planetary System Formation The mass of the presol.pdf
adislifestyle
 
One tenth solar_abundances_along_the_body_of-the_stream
One tenth solar_abundances_along_the_body_of-the_streamOne tenth solar_abundances_along_the_body_of-the_stream
One tenth solar_abundances_along_the_body_of-the_stream
Sérgio Sacani
 
High precision abundances_of_the_old_solar_twin_insights_on_li_depletion_from...
High precision abundances_of_the_old_solar_twin_insights_on_li_depletion_from...High precision abundances_of_the_old_solar_twin_insights_on_li_depletion_from...
High precision abundances_of_the_old_solar_twin_insights_on_li_depletion_from...
Sérgio Sacani
 
Materials Required· Computer and internet access· Textbook·
Materials Required· Computer and internet access· Textbook· Materials Required· Computer and internet access· Textbook·
Materials Required· Computer and internet access· Textbook·
AbramMartino96
 

Similar to Our Sun. V. A Bright Young Sun Consistent with Helioseismology and Warm Temperatures on Ancient Earth and Mars (20)

Highly siderophile elements_in_earth_mantle_as_a_clock_for_the_moon_forming_i...
Highly siderophile elements_in_earth_mantle_as_a_clock_for_the_moon_forming_i...Highly siderophile elements_in_earth_mantle_as_a_clock_for_the_moon_forming_i...
Highly siderophile elements_in_earth_mantle_as_a_clock_for_the_moon_forming_i...
 
The physical conditions_in_a_pre_super_star_cluster_molecular_cloud_in_the_an...
The physical conditions_in_a_pre_super_star_cluster_molecular_cloud_in_the_an...The physical conditions_in_a_pre_super_star_cluster_molecular_cloud_in_the_an...
The physical conditions_in_a_pre_super_star_cluster_molecular_cloud_in_the_an...
 
Large-scale Volcanism and the Heat Death of Terrestrial Worlds
Large-scale Volcanism and the Heat Death of Terrestrial WorldsLarge-scale Volcanism and the Heat Death of Terrestrial Worlds
Large-scale Volcanism and the Heat Death of Terrestrial Worlds
 
Interior Heating of Rocky Exoplanets from Stellar Flares with Application to ...
Interior Heating of Rocky Exoplanets from Stellar Flares with Application to ...Interior Heating of Rocky Exoplanets from Stellar Flares with Application to ...
Interior Heating of Rocky Exoplanets from Stellar Flares with Application to ...
 
Mars surface radiation_environment_measured_with_curiosity
Mars surface radiation_environment_measured_with_curiosityMars surface radiation_environment_measured_with_curiosity
Mars surface radiation_environment_measured_with_curiosity
 
Climatic consequences of regional nuclear conflicts
Climatic consequences of regional nuclear conflictsClimatic consequences of regional nuclear conflicts
Climatic consequences of regional nuclear conflicts
 
Theory of Planetary System Formation The mass of the presol.pdf
Theory of Planetary System Formation The mass of the presol.pdfTheory of Planetary System Formation The mass of the presol.pdf
Theory of Planetary System Formation The mass of the presol.pdf
 
3d modeling of_gj1214b_atmosphere_formation_of_inhomogeneous_high_cloouds_and...
3d modeling of_gj1214b_atmosphere_formation_of_inhomogeneous_high_cloouds_and...3d modeling of_gj1214b_atmosphere_formation_of_inhomogeneous_high_cloouds_and...
3d modeling of_gj1214b_atmosphere_formation_of_inhomogeneous_high_cloouds_and...
 
Oort cloud (exo)planets
Oort cloud (exo)planetsOort cloud (exo)planets
Oort cloud (exo)planets
 
First emergence of cold accretion and supermassive star formation in the earl...
First emergence of cold accretion and supermassive star formation in the earl...First emergence of cold accretion and supermassive star formation in the earl...
First emergence of cold accretion and supermassive star formation in the earl...
 
Tests of big bang
Tests of big bangTests of big bang
Tests of big bang
 
One tenth solar_abundances_along_the_body_of-the_stream
One tenth solar_abundances_along_the_body_of-the_streamOne tenth solar_abundances_along_the_body_of-the_stream
One tenth solar_abundances_along_the_body_of-the_stream
 
High precision abundances_of_the_old_solar_twin_insights_on_li_depletion_from...
High precision abundances_of_the_old_solar_twin_insights_on_li_depletion_from...High precision abundances_of_the_old_solar_twin_insights_on_li_depletion_from...
High precision abundances_of_the_old_solar_twin_insights_on_li_depletion_from...
 
LPSC2014_Estrada
LPSC2014_EstradaLPSC2014_Estrada
LPSC2014_Estrada
 
NEW HOT-to-COOL COSMOLOGY: Amazing Progress Yet Greater Questions
NEW HOT-to-COOL COSMOLOGY: Amazing Progress Yet Greater QuestionsNEW HOT-to-COOL COSMOLOGY: Amazing Progress Yet Greater Questions
NEW HOT-to-COOL COSMOLOGY: Amazing Progress Yet Greater Questions
 
25059453.pdf
25059453.pdf25059453.pdf
25059453.pdf
 
Neven Bilic, "Dark Matter, Dark Energy, and Unification Models"
Neven Bilic, "Dark Matter, Dark Energy, and Unification Models"Neven Bilic, "Dark Matter, Dark Energy, and Unification Models"
Neven Bilic, "Dark Matter, Dark Energy, and Unification Models"
 
0909.4337-1
0909.4337-10909.4337-1
0909.4337-1
 
Aa15425 10
Aa15425 10Aa15425 10
Aa15425 10
 
Materials Required· Computer and internet access· Textbook·
Materials Required· Computer and internet access· Textbook· Materials Required· Computer and internet access· Textbook·
Materials Required· Computer and internet access· Textbook·
 

More from XequeMateShannon

The different faces of mass action in virus assembly
The different faces of mass action in virus assemblyThe different faces of mass action in virus assembly
The different faces of mass action in virus assembly
XequeMateShannon
 
Countermeasures Against High-Order Fault-Injection Attacks on CRT-RSA
 Countermeasures Against High-Order Fault-Injection Attacks on CRT-RSA Countermeasures Against High-Order Fault-Injection Attacks on CRT-RSA
Countermeasures Against High-Order Fault-Injection Attacks on CRT-RSA
XequeMateShannon
 

More from XequeMateShannon (20)

LCS35
LCS35LCS35
LCS35
 
Wow! Signal Decoded as Foundations of Theory of Everything
Wow! Signal Decoded as Foundations of Theory of EverythingWow! Signal Decoded as Foundations of Theory of Everything
Wow! Signal Decoded as Foundations of Theory of Everything
 
Número normal
Número normalNúmero normal
Número normal
 
A Teoria de Cordas e a Unificação das Forças da Natureza
A Teoria de Cordas e a Unificação das Forças da NaturezaA Teoria de Cordas e a Unificação das Forças da Natureza
A Teoria de Cordas e a Unificação das Forças da Natureza
 
Algoritmos genéticos: princípios e aplicações
Algoritmos genéticos: princípios e aplicaçõesAlgoritmos genéticos: princípios e aplicações
Algoritmos genéticos: princípios e aplicações
 
Hamiltonian design in readout from room-temperature Raman atomic memory
 Hamiltonian design in readout from room-temperature Raman atomic memory  Hamiltonian design in readout from room-temperature Raman atomic memory
Hamiltonian design in readout from room-temperature Raman atomic memory
 
An efficient algorithm for the computation of Bernoulli numbers
 An efficient algorithm for the computation of Bernoulli numbers An efficient algorithm for the computation of Bernoulli numbers
An efficient algorithm for the computation of Bernoulli numbers
 
Intel Random Number Generator
Intel Random Number GeneratorIntel Random Number Generator
Intel Random Number Generator
 
Information Theory for Intelligent People
Information Theory for Intelligent PeopleInformation Theory for Intelligent People
Information Theory for Intelligent People
 
A Teoria Algorítmica da Aleatoriedade
 A Teoria Algorítmica da Aleatoriedade A Teoria Algorítmica da Aleatoriedade
A Teoria Algorítmica da Aleatoriedade
 
Quantum Computation and Information
Quantum Computation and InformationQuantum Computation and Information
Quantum Computation and Information
 
Quantum Cryptography: from Theory to Practice
 Quantum Cryptography: from Theory to Practice Quantum Cryptography: from Theory to Practice
Quantum Cryptography: from Theory to Practice
 
The Security of Practical Quantum Key Distribution
 The Security of Practical Quantum Key Distribution The Security of Practical Quantum Key Distribution
The Security of Practical Quantum Key Distribution
 
Experimental realisation of Shor's quantum factoring algorithm using qubit r...
 Experimental realisation of Shor's quantum factoring algorithm using qubit r... Experimental realisation of Shor's quantum factoring algorithm using qubit r...
Experimental realisation of Shor's quantum factoring algorithm using qubit r...
 
A smooth exit from eternal inflation?
A smooth exit from eternal inflation?A smooth exit from eternal inflation?
A smooth exit from eternal inflation?
 
The different faces of mass action in virus assembly
The different faces of mass action in virus assemblyThe different faces of mass action in virus assembly
The different faces of mass action in virus assembly
 
A Digital Signature Based on a Conventional Encryption Function
A Digital Signature Based on a Conventional Encryption FunctionA Digital Signature Based on a Conventional Encryption Function
A Digital Signature Based on a Conventional Encryption Function
 
Quantum algorithm for solving linear systems of equations
 Quantum algorithm for solving linear systems of equations Quantum algorithm for solving linear systems of equations
Quantum algorithm for solving linear systems of equations
 
Shor's discrete logarithm quantum algorithm for elliptic curves
 Shor's discrete logarithm quantum algorithm for elliptic curves Shor's discrete logarithm quantum algorithm for elliptic curves
Shor's discrete logarithm quantum algorithm for elliptic curves
 
Countermeasures Against High-Order Fault-Injection Attacks on CRT-RSA
 Countermeasures Against High-Order Fault-Injection Attacks on CRT-RSA Countermeasures Against High-Order Fault-Injection Attacks on CRT-RSA
Countermeasures Against High-Order Fault-Injection Attacks on CRT-RSA
 

Recently uploaded

CYTOGENETIC MAP................ ppt.pptx
CYTOGENETIC MAP................ ppt.pptxCYTOGENETIC MAP................ ppt.pptx
CYTOGENETIC MAP................ ppt.pptx
Cherry
 
Porella : features, morphology, anatomy, reproduction etc.
Porella : features, morphology, anatomy, reproduction etc.Porella : features, morphology, anatomy, reproduction etc.
Porella : features, morphology, anatomy, reproduction etc.
Cherry
 
LUNULARIA -features, morphology, anatomy ,reproduction etc.
LUNULARIA -features, morphology, anatomy ,reproduction etc.LUNULARIA -features, morphology, anatomy ,reproduction etc.
LUNULARIA -features, morphology, anatomy ,reproduction etc.
Cherry
 
development of diagnostic enzyme assay to detect leuser virus
development of diagnostic enzyme assay to detect leuser virusdevelopment of diagnostic enzyme assay to detect leuser virus
development of diagnostic enzyme assay to detect leuser virus
NazaninKarimi6
 
POGONATUM : morphology, anatomy, reproduction etc.
POGONATUM : morphology, anatomy, reproduction etc.POGONATUM : morphology, anatomy, reproduction etc.
POGONATUM : morphology, anatomy, reproduction etc.
Cherry
 
(May 9, 2024) Enhanced Ultrafast Vector Flow Imaging (VFI) Using Multi-Angle ...
(May 9, 2024) Enhanced Ultrafast Vector Flow Imaging (VFI) Using Multi-Angle ...(May 9, 2024) Enhanced Ultrafast Vector Flow Imaging (VFI) Using Multi-Angle ...
(May 9, 2024) Enhanced Ultrafast Vector Flow Imaging (VFI) Using Multi-Angle ...
Scintica Instrumentation
 
PODOCARPUS...........................pptx
PODOCARPUS...........................pptxPODOCARPUS...........................pptx
PODOCARPUS...........................pptx
Cherry
 

Recently uploaded (20)

CYTOGENETIC MAP................ ppt.pptx
CYTOGENETIC MAP................ ppt.pptxCYTOGENETIC MAP................ ppt.pptx
CYTOGENETIC MAP................ ppt.pptx
 
Concept of gene and Complementation test.pdf
Concept of gene and Complementation test.pdfConcept of gene and Complementation test.pdf
Concept of gene and Complementation test.pdf
 
Porella : features, morphology, anatomy, reproduction etc.
Porella : features, morphology, anatomy, reproduction etc.Porella : features, morphology, anatomy, reproduction etc.
Porella : features, morphology, anatomy, reproduction etc.
 
FAIRSpectra - Enabling the FAIRification of Analytical Science
FAIRSpectra - Enabling the FAIRification of Analytical ScienceFAIRSpectra - Enabling the FAIRification of Analytical Science
FAIRSpectra - Enabling the FAIRification of Analytical Science
 
Dr. E. Muralinath_ Blood indices_clinical aspects
Dr. E. Muralinath_ Blood indices_clinical  aspectsDr. E. Muralinath_ Blood indices_clinical  aspects
Dr. E. Muralinath_ Blood indices_clinical aspects
 
LUNULARIA -features, morphology, anatomy ,reproduction etc.
LUNULARIA -features, morphology, anatomy ,reproduction etc.LUNULARIA -features, morphology, anatomy ,reproduction etc.
LUNULARIA -features, morphology, anatomy ,reproduction etc.
 
development of diagnostic enzyme assay to detect leuser virus
development of diagnostic enzyme assay to detect leuser virusdevelopment of diagnostic enzyme assay to detect leuser virus
development of diagnostic enzyme assay to detect leuser virus
 
Daily Lesson Log in Science 9 Fourth Quarter Physics
Daily Lesson Log in Science 9 Fourth Quarter PhysicsDaily Lesson Log in Science 9 Fourth Quarter Physics
Daily Lesson Log in Science 9 Fourth Quarter Physics
 
Genome Projects : Human, Rice,Wheat,E coli and Arabidopsis.
Genome Projects : Human, Rice,Wheat,E coli and Arabidopsis.Genome Projects : Human, Rice,Wheat,E coli and Arabidopsis.
Genome Projects : Human, Rice,Wheat,E coli and Arabidopsis.
 
POGONATUM : morphology, anatomy, reproduction etc.
POGONATUM : morphology, anatomy, reproduction etc.POGONATUM : morphology, anatomy, reproduction etc.
POGONATUM : morphology, anatomy, reproduction etc.
 
Cot curve, melting temperature, unique and repetitive DNA
Cot curve, melting temperature, unique and repetitive DNACot curve, melting temperature, unique and repetitive DNA
Cot curve, melting temperature, unique and repetitive DNA
 
(May 9, 2024) Enhanced Ultrafast Vector Flow Imaging (VFI) Using Multi-Angle ...
(May 9, 2024) Enhanced Ultrafast Vector Flow Imaging (VFI) Using Multi-Angle ...(May 9, 2024) Enhanced Ultrafast Vector Flow Imaging (VFI) Using Multi-Angle ...
(May 9, 2024) Enhanced Ultrafast Vector Flow Imaging (VFI) Using Multi-Angle ...
 
module for grade 9 for distance learning
module for grade 9 for distance learningmodule for grade 9 for distance learning
module for grade 9 for distance learning
 
CURRENT SCENARIO OF POULTRY PRODUCTION IN INDIA
CURRENT SCENARIO OF POULTRY PRODUCTION IN INDIACURRENT SCENARIO OF POULTRY PRODUCTION IN INDIA
CURRENT SCENARIO OF POULTRY PRODUCTION IN INDIA
 
GBSN - Biochemistry (Unit 3) Metabolism
GBSN - Biochemistry (Unit 3) MetabolismGBSN - Biochemistry (Unit 3) Metabolism
GBSN - Biochemistry (Unit 3) Metabolism
 
X-rays from a Central “Exhaust Vent” of the Galactic Center Chimney
X-rays from a Central “Exhaust Vent” of the Galactic Center ChimneyX-rays from a Central “Exhaust Vent” of the Galactic Center Chimney
X-rays from a Central “Exhaust Vent” of the Galactic Center Chimney
 
ABHISHEK ANTIBIOTICS PPT MICROBIOLOGY // USES OF ANTIOBIOTICS TYPES OF ANTIB...
ABHISHEK ANTIBIOTICS PPT MICROBIOLOGY  // USES OF ANTIOBIOTICS TYPES OF ANTIB...ABHISHEK ANTIBIOTICS PPT MICROBIOLOGY  // USES OF ANTIOBIOTICS TYPES OF ANTIB...
ABHISHEK ANTIBIOTICS PPT MICROBIOLOGY // USES OF ANTIOBIOTICS TYPES OF ANTIB...
 
PODOCARPUS...........................pptx
PODOCARPUS...........................pptxPODOCARPUS...........................pptx
PODOCARPUS...........................pptx
 
Selaginella: features, morphology ,anatomy and reproduction.
Selaginella: features, morphology ,anatomy and reproduction.Selaginella: features, morphology ,anatomy and reproduction.
Selaginella: features, morphology ,anatomy and reproduction.
 
Cyanide resistant respiration pathway.pptx
Cyanide resistant respiration pathway.pptxCyanide resistant respiration pathway.pptx
Cyanide resistant respiration pathway.pptx
 

Our Sun. V. A Bright Young Sun Consistent with Helioseismology and Warm Temperatures on Ancient Earth and Mars

  • 1. arXiv:astro-ph/0210128v15Oct2002 ApJ, in press: 25 September 2002 Our Sun. V. A Bright Young Sun Consistent with Helioseismology and Warm Temperatures on Ancient Earth and Mars I.-Juliana Sackmann1 and Arnold I. Boothroyd2 W. K. Kellogg Radiation Laboratory 106-38, California Institute of Technology, Pasadena, CA 91125 ijs@caltech.edu boothroy@cita.utoronto.ca ABSTRACT The relatively warm temperatures required on early Earth and Mars have been difficult to account for via warming from greenhouse gases. We tested whether this problem can be resolved for both Earth and Mars by a young Sun that is brighter than predicted by the standard solar model (SSM). We computed high-precision solar evolutionary models with slightly increased initial masses of Mi = 1.01 to 1.07 M⊙; for each mass, we considered three different mass loss scenarios. We then tested whether these models were consistent with the current high-precision helioseismic observations. The relatively modest mass loss rates in these models are consistent with observational limits from young stars and estimates of the past solar wind obtained from lunar rocks, and do not significantly affect the solar lithium depletion. For appropriate initial masses, all three mass loss scenarios are capable of yielding a solar flux 3.8 Gyr ago high enough to be consistent with water on ancient Mars. The higher flux at the planets is due partly to the fact that a more massive young Sun would be intrinsically more luminous, and partly to the fact that the planets would be closer to the more massive young Sun. At birth on the main sequence, our preferred initial mass Mi = 1.07 M⊙ would produce a solar flux at the planets 50% higher than that of the SSM, namely, a flux 5% higher than the present value (rather than 30% lower, which the SSM predicts). At first (for 1 − 2 Gyr), the solar flux would decrease; subsequently, it would behave more like the flux in the SSM, increasing until the present. We find that all of our mass-losing solar models are consistent with the helioseismic observations; in fact, our preferred mass-losing case with Mi = 1.07 M⊙ is in marginally (though insignificantly) better agreement with the helioseismology than is the SSM. The early solar mass loss of a few percent does indeed leave a small fingerprint on the Sun’s internal structure. However, for helioseismology to significantly constrain early solar mass loss would require higher accuracy in the observed solar parameters and input physics, namely, by a factor of ∼ 3 for the observed solar surface composition, and a factor of ∼ 2 for the solar interior opacities, the pp nuclear reaction rate, and the diffusion constants for gravitational settling. Subject headings: Sun: evolution — Sun: helioseismology — Sun: solar-terrestrial relations — Sun: solar wind — planets and satellites: individual (Earth, Mars) 1Present address: West Bridge Laboratory 103-33, California Institute of Technology, Pasadena, CA 91125 2Present address: CITA, U. of Toronto, 60 St. George Street, Toronto, Ontario, Canada M5S 3H8
  • 2. – 2 – 1. Introduction Observations indicate that the Earth was at least warm enough for liquid water to exist as far back as 4 Gyr ago, namely, as early as half a billion years after the formation of the Earth (Cogley & Henderson- Sellers 1984; Mojzsis et al. 1996; Eiler, Mojzsis, & Arrhenius 1997; Eriksson 1982; Bowring, Williams, & Compston 1989; Nutman et al. 1984); in fact, there is evidence suggesting that Earth may have been even warmer then than it is now (Kasting 1989; Oberbeck, Marshall, & Aggarwal 1993; Woese 1987; Ohmotu & Felder 1987; Knauth & Epstein 1976; Karhu & Epstein 1986). These relatively warm temperatures required on early Earth are in apparent contradiction to the dimness of the early Sun predicted by the standard solar models. This problem has generally been explained by assuming that Earth’s early atmosphere contained huge amounts of carbon dioxide (CO2), resulting in a large enough greenhouse effect to counteract the effect of a dimmer Sun. However, the recent work of Rye, Kuo, & Holland (1995) places an upper limit of 0.04 bar on the partial pressure of CO2 in the period from 2.75 to 2.2 Gyr ago, based on the absence of siderite in paleosols; this casts doubt on the viability of a strong CO2 greenhouse effect on early Earth. The existence of liquid water on early Mars has been even more of a puzzle; even the maximum possible CO2 greenhouse effect cannot yield warm enough Martian surface temperatures (Kasting 1991; Kasting, Whitmire, & Reynolds 1993). These problems can simultaneously be resolved, for both Earth and Mars, if the early Sun were brighter than predicted by the standard solar models. This could be accomplished if the early Sun were slightly more massive than it is now. Helioseismic observations provide revolutionary precision for probing the solar interior. Helioseismic frequencies are observed with an accuracy of a few parts in 105 , allowing measurement of the sound speed profile throughout most of the Sun’s interior to an accuracy of a few parts in 104 (Basu, Pinsonneault, & Bahcall 2000). This high precision permits one to search for subtle effects in the interior structure of the present Sun resulting from events in the distant past. In particular, modest mass loss (between 1% and 7% of the Sun’s mass) early on the main sequence might have left enough of a fingerprint on the interior structure of the present Sun to be detectable by helioseismological observations. 1.1. Limits On Early Solar Mass Loss 1.1.1. Theoretical Solar Models and Helioseismology Willson, Bowen, & Struck-Marcel (1987) first presented the hypothesis that stars like the Sun might lose significant amounts of mass on the early main sequence. Guzik, Willson, & Brunish (1987) were the first to compute solar models with such early main sequence mass loss, namely, an extreme case with an initial mass of 2 M⊙. Such extreme mass loss (of ∆M = 1 M⊙) turns out to be unrealistic, as discussed below; but small mass loss cases cannot be ruled out at the present. Boothroyd, Sackmann, & Fowler (1991) considered an initial solar mass of 1.1 M⊙, showing that this is the upper limit allowed by the observed solar lithium depletion. Some work has been carried out recently attempting to use helioseismology to constrain early solar mass loss (Guzik & Cox 1995; Morel, Provost, & Berthomieu 1997); however, the first of these used rather crude solar interior models, and the second yielded ambiguous results, as we discuss in detail below. Guzik & Cox (1995) were the first to attempt to use helioseismic observations to constrain early solar mass loss; they considered initial solar masses of 1.1 and 2 M⊙, concluding that the 2 M⊙ could be ruled out by helioseismic observations of low-degree modes. They also claimed that a mass loss timescale of 0.2 Gyr was favored over a 0.45 Gyr timescale for the 1.1 M⊙ case, based on “frequencies for modes that probe
  • 3. – 3 – just below the convection zone bottom (l = 5 − 20, ν = 2500 − 3500 µHz),” but this latter conclusion is rendered dubious by the fact that this is the particular region of the Sun where one should expect the worst agreement in models that do not attempt to include rotation-induced mixing (see, e.g., Richard et al. 1996; Brun, Turck-Chi`eze, & Zahn 1999; Basu et al. 2000; Bahcall, Pinsonneault, & Basu 2001; Turck-Chi`eze et al. 2001). Furthermore, these models of Guzik & Cox (1995) were based on relatively crude approximations to the physical processes in the solar interior, particularly for the opacities. They state that their solar interior opacities used the Iben (1975) analytical fits to the opacity tables of Cox & Stewart (1970), with the electron scattering (esk) term in the Iben fit being multiplied either by a factor of 1.5 to approximate the LAOL tables, or by a factor of 2 to approximate the (early) OPAL opacities of Rogers & Iglesias (1992); in addition, they adjusted the opacities separately for each of their solar models, by adjusting the Az term in the Iben fit (which mainly affects opacities at 2 − 5 × 10⁶ K) in order to yield a position for the base of solar envelope convection at Rce ≈ 0.711 − 0.712 R⊙ (Guzik & Cox 1995). Even if they had in fact used the early OPAL opacity tables of Rogers & Iglesias (1992), the models of Morel et al. (1997) suggest that this would be expected to yield solar models with helioseismic disagreements 2 or 3 times worse than can be achieved by models using the more recent OPAL opacities (Iglesias & Rogers 1996; Rogers, Swenson, & Iglesias 1996); we have shown that using the LAOL opacity tables would result in even larger errors (Boothroyd & Sackmann 2002). Guzik & Cox (1995) used the recent MHD equation of state tables (D¨appen et al. 1988), albeit for a fixed value of Zeos = 0.02 (the metallicity Z actually varied from ∼ 0.018 to ∼ 0.021 from the envelope to the center of their models), but the equation of state is not very sensitive to metallicity, and we estimate that this fixed-Z approximation introduced errors in their thermodynamic quantities of no more than a few parts in 103 . They considered diffusion of hydrogen, helium, and four of the CNO isotopes, using diffusion constants from Cox, Guzik, & Kidman (1989); as they point out, the fact that this treatment probably overestimates the extent of gravitational settling of heavy elements (Proffitt & Michaud 1991) may compensate for the fact that they considered diffusion for elements comprising only 62% of the metallicity Z. Finally, Guzik & Cox (1995) compared models which had not been converged to the same final surface Z/X value; their Z/X differences of up to 4% would by themselves yield significant (though not major) differences between the models, largely through the effect on the opacities (Boothroyd & Sackmann 2002). Morel et al. (1997) also used helioseismology to test an initial solar mass of 1.1 M⊙, comparing sound speed and density profiles in their solar models to profiles obtained via an inversion from helioseismic fre- quencies. Their solar models incorporated much more up-to-date input physics (though they also used the fixed-Z approximation in the equation of state, with Zeos = 0.019), and they tested some different formu- lations of the input physics; but their tests of the effects of early solar mass loss yielded results that were ambiguous at best. They first considered models using the CEFF equation of state (Christensen-Dalsgaard & D¨appen 1992), diffusion constants from Michaud & Proffitt (1993), and the more recent OPAL opacities (Iglesias & Rogers 1996; Rogers et al. 1996); however, in these models Morel et al. (1997) also used the fixed-Z approximation when interpolating the opacities, which can lead to significant opacity errors and thus significant effects on the solar models, as they themselves showed (see also Boothroyd & Sackmann 2002). Morel et al. (1997) compared mass-losing models with an initial mass of Mi = 1.1 M⊙ to a standard solar model (Mi = 1.0 M⊙), testing both a short (0.2 Gyr) and a long (0.45 Gyr) mass loss timescale. They found that the long mass loss timescale yielded fractional shifts of up to ∼ 0.001 in the sound speed profile relative to the standard solar model (a significant but not major effect), while the short mass loss timescale had an insignificant effect (of ∼ 0.0002, roughly one fifth as large). They next considered models with the OPAL equation of state (Rogers et al. 1996), and where the variation of metallicity Z inside the star was considered when interpolating in the OPAL opacities (each of these latter two changes yielded shifts of up to 0.001 in the sound speed profiles of their standard solar models). They compared a model with an initial
  • 4. – 4 – mass Mi = 1.1 M⊙ and their short (0.2 Gyr) mass loss timescale to a standard solar model, finding differ- ences of up to ∼ 0.001 in the sound speed profile between them — 5 times as large as the effect from the same comparison with the first set of models (and large enough to suggest the possibility of highly significant effects from a longer mass loss timescale). Such large disagreements between their two sets of results for the differential effects of early solar mass loss suggest that their mass-losing models may have had much larger numerical or convergence errors than they estimated for their standard solar models; and indeed their second short-timescale mass-losing model shows sound speed disagreements near the surface that might be interpreted as being due to poor convergence to the present solar luminosity, radius, and/or surface Z/X — though even very poor convergence would not expected to yield such large interior disagreements (Boothroyd & Sackmann 2002). The goal of the present work was to resolve the above ambiguity as to what constraints might be placed on early solar mass loss by helioseismic observations, by computing models with both up-to-date input physics and high numerical precision. We considered additional observational constraints on solar mass loss (as discussed in § 1.1.2 below), and tested a number of different initial solar masses and mass loss timescales. We also compared the effects of mass loss to the effects of other reasonable variations in the solar input parameters and input physics — these latter effects were discussed in detail in our companion paper “Our Sun IV” (Boothroyd & Sackmann 2002). Finally, we present the effects of the various mass loss cases on the solar flux reaching Earth and Mars as a function of time. 1.1.2. Other Observational Constraints Presently, the Sun is experiencing only a negligible amount of mass loss: the solar wind removes mass at a rate ∼ 3×10⁻¹⁴ M⊙ yr−1 . If this mass loss rate had been constant over the last 4.5 Gyr, the young Sun would have been more massive by only ∼ 10−4 M⊙. The contemporary solar wind has been observed only for a few decades, and has been found to be a highly variable phenomenon — all properties, including flux, velocity, and composition vary significantly (Geiss & Bochsler 1991). The lunar surface material carries the signature of the solar wind irradiation over the past several Gyr; measurements of noble gas isotopes in lunar samples suggest that the average solar wind flux over the past ∼ 3 Gyr was an order of magnitude higher than it is today (Geiss 1973; Geiss & Bochsler 1991; Kerridge et al. 1991). This implies a total solar mass loss of ∼ 10−3 M⊙ over the past 3 to 4 Gyr (the age of the oldest available lunar material). Some older, solar-flare irradiated grains from meteorites imply an early solar flare activity about 103 times that of the present Sun (Caffee, Hohenberg, & Swindle 1987); the associated solar wind may have been enhanced by a similar factor of ∼ 103 , most likely during the first ∼ 1 Gyr of the Sun’s life on the main sequence (Whitmire et al. 1995), implying a total mass loss during this first 1 Gyr period of as much as ∼ 0.03 M⊙ (if the average mass loss rate throughout that period was indeed ∼ 103 times the present rate of 3 × 10⁻¹⁴ M⊙yr−1 ). Such a change in the solar mass would be sufficient to cause a significant increase in the luminosity of the young Sun. Since the Sun is a typical main sequence star, it is reasonable to assume that mass loss rates in the young Sun would be similar to those in other young solar-type main sequence stars. There have been several attempts to measure mass loss in early main sequence stars. It is observationally a very challenging task. Brown et al. (1990) attempted to obtain mass loss rates for 17 young main sequence stars somewhat hotter and more massive than the Sun (A and F dwarfs), finding upper limits to the mass loss rates of 10−10 to 10−9 M⊙/yr; these limits are even less constraining than the highest solar mass loss rate suggested by the meteoritic and lunar data. Gaidos, G¨udel, & Blake (2000) used 3.6 cm VLA observations to place more
  • 5. – 5 – stringent upper limits of ˙M 5 × 10⁻¹¹ M⊙ yr−1 on mass loss rates of three young main sequence stars of roughly solar mass (π01 UMa, κ1 Cet, and β Com) — as discussed in § 2.1, the largest initial solar mass that we consider, namely 1.07 M⊙, would require early solar mass loss rates that are marginally consistent with these more stringent limits. Wood et al. (2001) recently obtained HST observations of H I Lyα absorption from the region where the stellar wind collides with the interstellar medium, using these to measure the stellar wind from the sun-like star α Cen. They found a mass loss rate roughly twice as large as that of the Sun; note that α Cen is slightly older than the Sun (with an age of ∼ 5 Gyr), as well as being very slightly more massive (M ≈ 1.08 M⊙). They also found an upper limit roughly ten times lower for its cooler, less massive companion Proxima Cen. A similar method had earlier been used by Wood & Linsky (1998) to look at four other main sequence stars cooler and less massive than the Sun (finding stellar winds of roughly the same order of magnitude as the solar wind). Such a method applied to young, Sun-like stars holds promise for placing stringent limits on early main sequence mass loss. Very recently, Wood et al. (2002) demonstrated that mass loss rates in GK dwarfs (measured using the above method) are generally correlated with their X-ray flux (measured by ROSAT, and using the HIPPARCOS distances). For 7 of the 9 stars they looked at, there was a fairly tight correlation, with ˙M ∝ F1.15±0.20 X over a range of 2 orders of magnitude in ˙M and FX. They then used the estimates from Ayres (1997) of the correlation of X-ray flux with rotational velocity FX ∝ V 2.9±0.3 rot and of rotational velocity with age Vrot ∝ t−0.6±0.1 to obtain the first empirically derived relation describing the mass-loss evolution of cool main-sequence stars like the Sun, namely, ˙M ∝ t−2.00±0.52 . They point out that the above correlations do not really apply to very young stars (age 0.3 Gyr), and assume instead that the maximum mass loss rate at early times corresponds to the maximum X-ray flux observed in Sun-like stars, namely, 103 times the solar value. Given the Sun’s present mass loss rate of ˙M ∼ 3 × 10⁻¹⁴ M⊙ yr−1 , this would imply total solar mass loss of order 0.01 M⊙ (albeit with an uncertainty of a factor of 5 or so), with most of this mass loss taking place in the first fraction of a Gyr of the Sun’s lifetime. The effects of such a mass loss law will be investigated in more detail in a future paper (A. I. Boothroyd & I.-J. Sackmann, in preparation), but we make some rough estimates of the probable effects in § 3 and § 4. The observed depletion of lithium in the Sun provides a stringent upper limit to the total solar mass loss of ∆M ∼ 0.1 M⊙; i.e., the initial solar mass Mi (4.5 Gyr ago) is constrained to be Mi 1.1 M⊙ (Boothroyd et al. 1991). However, this is much too generous an upper limit. There are additional mechanisms that can deplete solar lithium. One mechanism, namely, pre-main-sequence lithium depletion (during the Sun’s initial contraction phase), was taken into account in our mass-losing solar models (for the standard Sun, this depletion was a factor of ∼ 20, as discussed below and in our companion paper “Our Sun IV” [Boothroyd & Sackmann 2002]). Another mechanism is rotation-induced turbulent mixing, which probably is the major cause of the main-sequence lithium depletion; however, rotation models have free parameters, and can be fitted to any required amount of solar lithium depletion (see, e.g., Schatzman 1977; Lebreton & Maeder 1987; Pinsonneault et al. 1989; Charbonnel, Vauclair, & Zahn 1992; Richard et al. 1996). Also, it has been shown that mass loss cannot be the major contributor to the observed lithium depletions in the young Hyades cluster (Swenson & Faulkner 1992); this constraint is discussed in more detail in § 1.1.3 below. An even more stringent upper limit to the Sun’s initial mass is imposed by the requirement that the early Earth not lose its water via a moist greenhouse effect, which would occur if the solar flux at Earth were more than 10% higher than its present value (Kasting 1988) — a moist greenhouse occurs when the stratosphere becomes wet, and H2O is lost through UV dissociation and the subsequent loss of hydrogen to space. This solar flux limit corresponds to an upper limit on the Sun’s initial mass of Mi 1.07 M⊙, which
  • 6. – 6 – is the most stringent upper limit on the Sun’s initial mass. The only strong lower limit on Mi comes from the fact that the Sun is converting matter into energy and radiating it away; ∆E = L∆t = ∆Mc2 , where ∆E is the total energy radiated away, L is the average solar luminosity (including the neutrino luminosity) ∆t is the ∼ 4.5 Gyr duration of the nuclear burning, ∆M is the amount of mass converted into energy, and c is the speed of light (note that elsewhere in the paper we use “c” to denote the adiabatic sound speed). At present, mass is radiated away as photons and neutrinos at a rate slightly over twice the solar wind mass loss rate. For the standard solar model, the Sun’s average luminosity over the last 4.5 Gyr was about 0.85 times its present luminosity. It follows that ∆M ≈ 3 × 10⁻⁴ M⊙ from radiation losses alone (i.e., that Mi 1.0003 M⊙). Such a minor amount of mass loss has a negligible effect on the early solar luminosity. There are also considerations that put soft lower limits on the Sun’s initial mass Mi. If the present observed solar wind rate of ∼ 3 × 10⁻¹⁴ M⊙/yr had been constant over the Sun’s history, the total amount of solar wind mass loss would have been only ∼ 1.4 × 10⁻⁴ M⊙; including the ∆M ≈ 3 × 10⁻⁴ M⊙ from radiation losses would imply Mi ∼ 1.0004 M⊙. However, measurements of the noble gases implanted in lunar samples suggest an average solar wind flux over the past ∼ 3 Gyr an order of magnitude higher than at present, (Geiss 1973; Geiss & Bochsler 1991; Kerridge et al. 1991), implying a total solar mass loss over that period of ∼ 0.001 M⊙, i.e., a solar mass 3 Gyr ago of M(−3 Gyr) ∼ 1.001 M⊙ — note that M(−t) is used to refer to the solar mass at t years before the present. The ∼ 3 Gyr age of these lunar rocks means that they place no limits on earlier solar mass loss, so that all one can say is that Mi ≥ M(−3 Gyr). Older, solar-flare irradiated grains from meteorites imply early solar flare activity about 103 times that of the present Sun (Caffee et al. 1987), which might possibly correspond to similarly high mass loss rates during the first ∼ 1 Gyr period of the Sun’s life, but cannot be used to provide any sort of limit. The semi-empirical mass loss formula recently presented by Wood et al. (2002) suggests total solar mass loss of order 0.01 M⊙, but with an uncertainty of about a factor of 5, as discussed above. Another limit on the Sun’s initial mass comes from the requirement that Mars was warm enough for liquid water to exist 3.8 Gyr ago (at the end of the late heavy bombardment period). According to Kasting (1991) and Kasting et al. (1993), this requires a solar flux (at Mars) 3.8 Gyr ago at least 13% larger than that from the standard solar model, in order to make it possible for a CO2 greenhouse effect on Mars to be able raise the temperature to 0◦ C. Such an increase in flux would correspond to a mass of the Sun at that time of M(−3.8 Gyr) 1.018 M⊙. Since the lunar rock measurements constrain the Sun’s mass ∼ 3 Gyr ago to be M(−3 Gyr) ∼ 1.001 M⊙, the Sun’s average mass loss rate between 3.8 and 3 Gyr ago would be ˙M 2 × 10⁻¹¹ M⊙/yr. If this same mass loss rate also occurred throughout the period from the Sun’s birth ∼ 4.6 Gyr ago until 3.8 Gyr ago, this would imply an initial solar mass of Mi 1.033 M⊙. Note that this lower limit assumes that the only greenhouse effect on early Mars is due to CO2. If a smog-shielded ammonia greenhouse could exist on early Mars, such as that proposed for the early Earth by Sagan & Chyba (1997), then this lower limit on Mi might be softened or eliminated. 1.1.3. The Swenson-Faulkner Hyades Mass Loss Constraint Swenson & Faulkner (1992) established that mass loss could not be the major cause of the main- sequence lithium depletion for stars in the Hyades cluster. Their result has frequently been mis-quoted and misunderstood; it has often been used to rule out the possibility of mass loss during the Sun’s early main sequence phase. However, their result does not rule out relatively small amounts of mass loss for either the
  • 7. – 7 – Hyades or the Sun. For the Hyades cluster, which is 0.6 Gyr old, lithium abundances in many stars have been observed, exhibiting a fairly tight relationship between a star’s lithium abundance and its surface temperature — the observed lithium abundance drops off steeply with decreasing surface temperature, below ∼ 6000 K. Swenson & Faulkner (1992) considered lithium depletion due both to pre-main-sequence burning and to main sequence mass loss. They found that the observed lithium-temperature relationship could not be accounted for by pre-main-sequence lithium depletion alone, but that it could be accounted for fairly well if one added main sequence mass loss. However, they found that all the stars with surface temperatures below 5500 K would then have to have nearly identical initial masses (with a wide range of mass loss rates). Such a distribution of initial stellar masses, with a high, narrow peak in the distribution near 1.1 M⊙, is unrealistic. This argument has been widely misquoted, to rule out early main sequence mass loss in stars (including the Sun). The Swenson-Faulkner conclusion applies only if one is trying to match the Hyades lithium depletions without including rotation-induced mixing. As soon as one includes the latter as a major component, one can reproduce the observed lithium-temperature relation of Hyades stars by choosing suitable values for the adjustable parameters in the rotational mixing formalism (see, e.g., Schatzman 1977; Lebreton & Maeder 1987; Pinsonneault et al. 1989; Charbonnel et al. 1992; Richard et al. 1996). Stellar rotation is ubiquitous in young stars, and is commonly assumed to be the cause of all main sequence lithium depletion; the presence of a relatively small amount of mass loss merely requires that the large lithium depletion due to rotation be decreased by a small amount (by small changes in the adjustable parameters for rotational mixing). For the Hyades, even a mass loss as large as ∆M = 0.07 M⊙ in a star near 1 M⊙ would imply a lithium depletion factor due to mass loss alone of only ∼ 5, (according to the models of Swenson & Faulkner 1992), and would still require a depletion factor due to rotational mixing of ∼ 15 in order to reproduce the observed lithium-temperature relation. For the Sun, pre-main sequence burning yields a lithium depletion factor of order 20 (Boothroyd & Sackmann 2002); as discussed in § 3.2.1, combining pre-main sequence lithium burning with an early solar mass loss of ∆M = 0.07 M⊙ increases this by less than a factor of 2, i.e., a combined lithium depletion factor of ∼ 30 − 40, still much smaller than the total observed lithium depletion of 160 ± 40 (Grevesse & Sauval 1998). Rotation would be responsible for the remaining lithium depletion. Mass loss of order ∆M = 0.07 M⊙ or less is consistent with the Hyades lithium observations, i.e., does not require an unrealistic initial stellar mass distribution. In their later work, Swenson et al. (1994) found they were able to reproduce the Hyades lithium- temperature relation by pre-main-sequence depletion alone, provided that the oxygen abundance was as- sumed to be at the upper limit of the observed range (and using the most up-to-date OPAL and Alexander opacities). However, other clusters such as NGC 752, M67, or NGC 188 cannot be explained via pre-main- sequence lithium depletion alone — their observed lithium depletions are much larger than those of the Hyades (see, e.g., Hobbs & Pilachowski 1988; Balachandran 1995), while their pre-main-sequence depletions would be significantly smaller (due to their lower metallicities). The same is true of the Sun. In other words, the observed lithium depletions demand main sequence depletion, which would be largely due to rotation-induced mixing, with possibly a small effect from mass loss as well.
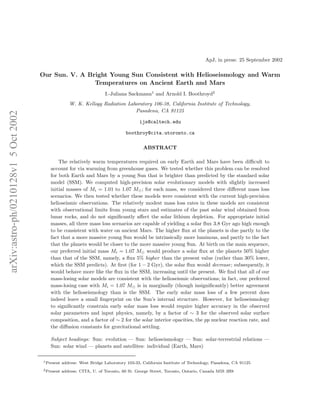
  • 8. – 8 – 1e-14 1e-13 1e-12 1e-11 1e-10 0 0.5 1 1.5 2 2.5 3 3.5 4 4.5 Solarmasslossrate(MO•yr-1 ) time (Gyr) 1.07 exp 1.01 exp 1.07 step 1.01 step 1.07 linear 1.01 linear π01 UMa κ 1 Cet β Com Exponential mass loss: Mi = 1.07 MO• Exponential mass loss: Mi = 1.01 MO• Step-function mass loss: Mi = 1.07 MO• Step-function mass loss: Mi = 1.01 MO• Linear mass loss: Mi = 1.07 MO• Linear mass loss: Mi = 1.01 MO• Fig. 1.— Mass loss rates as a function of time for our “exponential,” “step-function,” and “linear” solar mass loss cases. The lowest and the highest mass loss cases that we considered are shown (Mi = 1.01 and 1.07 M⊙, respectively). Mass loss upper limits for the young Sun-like stars π01 UMa, κ1 Cet, and β Com are from Gaidos et al. (2000). 2. Methods 2.1. Mass Loss of the Young Sun We computed mass-losing solar models having initial masses Mi = 1.01, 1.02, 1.03, 1.04, 1.05, 1.06, and 1.07 M⊙; as discussed in § 1.1.2, an initial mass of 1.07 M⊙ is the upper limit consistent with the requirement that the young Earth not lose its water via a moist greenhouse effect (Kasting 1988). We considered three different forms for early solar mass loss, which we call “exponential,” “step-function,” and “linear”; for each of these, two limiting cases are displayed in Figure 1 (i.e., cases with initial solar masses of 1.01 and 1.07 M⊙). In the “exponential” mass loss case, the mass loss rate starts out high and declines exponentially, with an initial mass loss rate ˙M0 and decay time constant τ chosen such as to give the present observed solar mass loss rate of ˙M = 3 × 10⁻¹⁴ M⊙ yr−1 at the Sun’s present age. In other words, ˙M(t) = ˙Mi e−t/τ , with ˙Mi = 1.33 × 10⁻¹¹ to 1.27 × 10⁻¹⁰ M⊙ yr−1 and τ = 0.755 to 0.551 Gyr, for initial solar masses of 1.01 to 1.07 M⊙, respectively. This exponential mass loss case is our most conservative one: a simple mass loss scenario that is still reasonably consistent with the observed lunar mass loss constraint. This scenario yields average mass loss rates over the past 3 Gyr of 13 to 42 times the present value, for initial solar masses of 1.01 to 1.07 M⊙, respectively. These average mass loss values are reasonably consistent with measurements of noble gases in lunar rocks, which suggest a mass loss rate an order-of-magnitude higher than the present value. Since Figure 1 is a log-linear plot, these “exponential” mass loss cases appear as straight lines. The “step-function” mass loss rate was chosen to have a constant high value during the period before the lunar rock observations apply, namely, the first 1.6 Gyr of the Sun’s life; over the remaining 3 Gyr of the
  • 9. – 9 – Sun’s life (up to the present), a mass loss rate averaging ten times the present value was assumed, declining linearly over this period to reach the present solar mass loss rate at the present solar age. This is the most extreme case which is still consistent with the observed lunar rock mass loss constraints: it keeps the solar flux as high as possible for as long as possible. For the first 1.6 Gyr, this scenario has constant mass loss rates of ˙M = 5.69 × 10⁻¹² to 4.32 × 10⁻¹¹ M⊙ yr−1 , for initial solar masses of 1.01 to 1.07 M⊙, respectively. In the “linear” mass loss case, the mass loss rate starts out high and declines slowly and linearly, to reach the present solar mass loss rate at the present solar age. This was chosen as our most radical case, with maximum impact on the Sun’s internal structure. Due to the linear decline, the mass loss rate remains high throughout most of the Sun’s lifetime, remaining of the same order as the initial mass loss rate ( ˙Mi = 4.35 × 10⁻¹² to 3.04 × 10⁻¹¹ M⊙ yr−1 , for initial solar masses of 1.01 to 1.07 M⊙, respectively). During the past 3 Gyr, the mass loss rate for this “linear” case is much higher than for the other mass loss cases above, violating the observed lunar mass loss constraints (the “linear” case has average mass loss rates over the past 3 Gyr of 50 to 330 times the present rate, for initial solar masses of 1.01 to 1.07 M⊙, respectively). The “linear” mass loss cases appear as curved lines in Figure 1. 2.2. Physical Inputs to our Solar Models The solar evolution program is discussed in detail in our companion paper “Our Sun IV” (Boothroyd & Sackmann 2002); we provide only a brief summary here. We used the OPAL equation of state (Rogers et al. 1996), extended to lower temperatures by the MHD equation of state (D¨appen et al. 1988). The 1995 OPAL opacities (Iglesias & Rogers 1996) were used for log T > 4; since these opacities (as well as both sets of equation of state tables) were based on the heavy element composition of Grevesse & Noels (1993), this mixture was used in order to obtain self-consistent solar models (along with their recommended value Z/X = 0.0245 in the present solar envelope). At lower temperatures (log T < 4), the Alexander & Ferguson (1994) molecular opacities were used. Both the equation of state and the opacities were interpolated in metallicity as well as in hydrogen abundance, temperature, and density, in order to take into account metallicity variations due to diffusion and nuclear burning. For the “exponential” mass loss cases, we also computed an alternate set of solar models based on the recent solar composition observations of Grevesse & Sauval (1998), which yield Z/X = 0.023 in the present solar envelope; for this composition, we obtained appropriate OPAL opacities via the online opacity computation feature of the OPAL web page3 . Also, in these models we performed the switchover between the OPAL and MHD equations of state at log T ∼ 4 (rather than at log ρ ∼ −2, which corresponds to log T ∼ 5.5 in the Sun). As discussed in Boothroyd & Sackmann (2002), the switchover region between the two equations of state was wide enough, and the equations of state were similar enough in the chosen switchover regions, that artifacts introduced by the switchover should not be significant compared to the size of the inconsistencies in the OPAL equation of state. We used the NACRE nuclear reaction rate compilation (Angulo et al. 1999), supplemented by the 7 Be electron capture rates of Gruzinov & Bahcall (1997). Weak screening (Salpeter 1955) was used — note that it is a very good approximation to the exact quantum mechanical solution for solar conditions (see, e.g., Bahcall, Chen, & Kamionkowski 1998; Gruzinov & Bahcall 1998). All of the stable isotopes up to and including 18 O were considered in detail, except for deuterium (which was assumed to have been burned 3http://www-phys.llnl.gov/Research/OPAL/
  • 10. – 10 – to 3 He). The other isotopes up to 28 Si were included in the code, but not in the nuclear reaction network, since there are no significant effects under solar conditions (except for 19 F, which was assumed to be in CNO-cycle nuclear equilibrium for nuclear rate purposes). Neutrino capture cross sections were taken from Bahcall & Ulrich (1988), except for the 8 B-neutrino cross section for capture on 37 Cl, where the more recent value (5% higher) of Aufderheide et al. (1994) was used. A set of subroutines4 were kindly provided to us (M. H. Pinsonneault 1999, private communication) that take into account the diffusion (gravitational settling) of helium and heavy elements relative to hydrogen (see also Thoul, Bahcall, & Loeb 1994; Bahcall, Pinsonneault, & Wasserburg 1995). A present solar mass of M⊙ = 1.9891 × 1033 g (Cohen & Taylor 1986) was used, and a solar radius at the photosphere (τ = 2/3) of R⊙ = 695.98 Mm (Ulrich & Rhodes 1983; Guenther et al. 1992). Our solar luminosity value of L⊙ = 3.854 × 1033 erg s−1 (Sackmann, Boothroyd, & Kraemer 1993) is close (less than 1-σ) to the more recent value of Bahcall et al. (2001); as discussed in our companion “Our Sun V” paper (Boothroyd & Sackmann 2002), such a luminosity difference has negligible effect on the solar structure (and only a minor effect on the neutrino rates). We used a total solar age of t⊙ = 4.6 Gyr, measured from the Sun’s birth on the pre-main-sequence Hayashi track; this is only just outside the range 4.55 Gyr < t⊙ < 4.59 Gyr (in effect, t⊙ = 4.57±0.01 Gyr) allowed by meteoritic ages (Bahcall et al. 1995), sufficiently close that a more precise age value would have had very little effect on the solar structure and helioseismology (see Boothroyd & Sackmann 2002). Note that the earlier total solar (and solar system) age estimate τss = 4.53 ± 0.03 Gyr of Guenther (1989) is consistent with the limits of Bahcall et al. (1995). Our models took about 40 Myr to reach the zero age main sequence (ZAMS), the point at which nuclear reactions in the core provide essentially all the Sun’s luminosity, and the pre-main-sequence contraction stops; this pre-main-sequence timescale implies that the total solar age t⊙ used in this paper can be converted into a main sequence solar lifetime by subtracting about 0.04 Gyr (this was also pointed out by Guenther 1989). We investigated the effects of using two different zonings. Our coarse-zoned solar models had about 2000 spatial zones in the model, and about 200 time steps in the evolution from the zero-age main sequence to the present solar age (plus about 800 time steps on the pre-main-sequence), comparable to other work in this field (e.g., a factor of 2 more than Morel et al. 1997); mass-losing solar models might require several times as many timesteps, due to the constraint that mass loss effects be kept small over one timestep. Typically, these models were converged to match the solar luminosity, radius, and surface Z/X value to within a few parts in 105 ; a few cases where convergence was slow reached only about a part in 104 . Because the inconsistencies in the mass-losing solar models of Morel et al. (1997) had suggested the possibility that such models might tend to have numerical inaccuracies larger than in standard solar models, as discussed in § 1.1.1, we also computed a number of fine-zoned models, with 10 000 spatial zones and 1500 main-sequence time steps (plus 6000 pre-main-sequence time steps) — a factor of 5 increase in both spatial and temporal precision. It was indeed more difficult to converge mass-losing solar models to precise solar luminosity, radius, and surface Z/X values — the standard solar models were converged to these values with an accuracy nearly a factor of ten better than the typical mass-losing models — but comparing the last few models in a convergence sequence revealed no untoward effects. Considering the much larger amounts of CPU-time required, there seemed to be no point in attempting to match the solar luminosity, radius, and surface Z/X values any better for fine-zoned cases than for coarse-zoned ones. (A fine-zoned converged mass-losing solar model took a few weeks of CPU-time on a fairly high-performance ES40 computer, as compared to about half a day for a coarse-zoned case, while a standard solar model without mass loss took only about a fifth as long in each 4These subroutines are available from Bahcall’s web page: http://www.sns.ias.edu/∼jnb/
  • 11. – 11 – case; these times were roughly tripled on a 450 MHz Pentium III PC.) As discussed in our companion “Our Sun IV” paper (Boothroyd & Sackmann 2002), even the worst of the above convergence accuracies has a negligible effect on the solar sound speed profile: up to 1 or 2 parts in 104 in the convective envelope, and a few parts in 105 below it. The fine-zoned mass-losing models differed from the corresponding coarse-zoned ones by the same negligibly small systematic shift (less than a part in 104 in the sound speed) that had been found in standard solar models (see Boothroyd & Sackmann 2002); we concluded that our properly converged coarse-zoned mass-losing models are perfectly adequate, and do not suffer from the problems encountered by the mass-losing solar models of Morel et al. (1997). Even the largest of the mass loss rates we considered (3 orders of magnitude larger than the present solar wind) is still quite small in absolute terms (for example, asymptotic giant branch stars encounter mass loss rates 6 orders of magnitude larger still, and high-mass main sequence stars also have very high mass loss rates). Nonetheless, over a reasonable model timestep, such mass loss would cause a mass layer near the solar surface to move outwards significantly. We therefore used an outer boundary condition for our models at a point ∼ 10−3 M⊙ inwards from the solar surface, computing sets of static envelopes for the region exterior to this point (and requiring timesteps short enough that changes at this outer boundary point remained small from one timestep to the next). Since the mass loss timescales for these outer layers are always at least 4 orders of magnitude longer than their thermal timescales, this should be a good approximation; and ignoring energy changes in this small outer region should introduce fractional errors in the solar luminosity at the level of 10−6 or less. Test cases where this outer boundary point was chosen differently showed no effect, as expected. We compared our solar models to profiles of the solar sound speed c⊙, density ρ⊙, and adiabatic index (Γ1)⊙ obtained from the helioseismic reference model of Basu et al. (2000)5 , which they obtained by inversion from the helioseismic frequency observations. In the inversion process, a standard solar model is required, but Basu et al. (2000) demonstrated that the resulting c⊙ and ρ⊙ profiles of the helioseismic reference model are relatively insensitive to uncertainties in the standard solar model used for this purpose (except for uncertainties in R⊙). They estimated a net uncertainty of few parts in 104 for the sound speed c⊙ and adiabatic index (Γ1)⊙, and a few parts in 103 for the density ρ⊙. However, in the Sun’s core (r 0.1 R⊙), systematic uncertainties in the helioseismic sound profile are increased by a factor of ∼ 5; this was demonstrated by Bahcall et al. (2001), who compared helioseismic inversions of different helioseismic data sets. We used their comparison to estimate the r-dependence of the systematic error in c⊙ in the core and in the convective envelope (namely, a fractional systematic error decreasing linearly from 0.0013 at r = 0.05 R⊙ to 0.0003 at r = 0.2 R⊙, constant from there to r = 0.72; R⊙, then increasing linearly to 0.00052 at r = 0.94; R⊙). For c⊙, this systematic error can be significantly larger than the statistical errors quoted in Table 2 of Basu et al. (2000), and we combined the two in quadrature to get the total fractional error (σc/c) for the purpose of calculating weighted rms differences — the rms fractional difference in c is given by [(∆c/c)/(σc/c)]2 / [1/(σc/c)]2 1/2 . For (Γ1)⊙ and ρ⊙, the systematic errors are comparable to or smaller than the statistical ones, and the statistical errors sufficed for calculating weighted rms differences. We present all our sound speed and density profiles in terms of differences relative to the observed helioseismic reference profiles. This choice of presentation not only allows one to see the effects of the choice of initial mass and mass loss type, but also the extent to which the models agree with the helioseismic 5From the denser-grid machine-readable form of their Table 2, at http://www.sns.ias.edu/∼jnb/
  • 12. – 12 – observations. 3. Results and Discussion For comparison with our solar mass loss rates, we used the most recent observed upper limits on stellar mass loss rates from three young Sun-like stars (namely, ˙M 5 × 10⁻¹¹ M⊙ yr−1 , from π01 UMa, κ1 Cet, and β Com), as presented by Gaidos et al. (2000). Even our highest mass loss cases are very close to being consistent with these limits, as is illustrated in Figure 1. 3.1. Testing Mass Loss Models Via Helioseismology 3.1.1. Sound Speed and Density Profiles We present in Figure 2 profiles of the adiabatic sound speed differences δc/c ≡ (c⊙ −cmodel)/c⊙; profiles of the density differences δρ/ρ ≡ (ρ⊙ − ρmodel)/ρ⊙ are available online6 . Note that we use “δ” to denote differences between the helioseismic profile and one of our models, and “∆” to denote differences between two of our models with different input parameters — the “δ” values are the profiles plotted in Figure 2, while the “∆” values refer to the difference between one plotted curve and another. Solar masses as a function of time for the corresponding cases are presented in Figure 3, and solar fluxes at the planets (relative to their present values) are presented in Figure 4. Since the prominent peak at r ∼ 0.7 R⊙ results from the neglect of rotational mixing, we did not require agreement in this region between profiles from our theoretical models and profiles inferred from the helioseismic observations. Nor did we require agreement in core region, since the present helioseismic observations still result in large uncertainties in the inferred profiles there. On the other hand, we aimed for agreement in the regions 0.1 R⊙ r 0.6 R⊙ and 0.72 R⊙ r 0.94 R⊙, where disagreements are due to imperfections in the input physics or uncertainties in the observed solar parameters. This is demonstrated by our variant models of our companion paper “Our Sun IV” (Boothroyd & Sackmann 2002) and of Morel et al. (1997) and Basu et al. (2000). Except around r ∼ 0.7 R⊙ and near the surface, the sound speed profile in our standard solar models with the Grevesse & Noels (1993) composition (heavy solid lines in Fig. 2a, b, c) differ by δc/c 0.001 from the helioseismic sound speed, typical agreement for standard solar models with this composition (see, e.g., Morel et al. 1997; Basu et al. 2000; Bahcall et al. 2001; Turck-Chi`eze et al. 2001; Neuforge-Verheecke et al. 2001). However, if one updates to the more recent solar composition value of Grevesse & Sauval (1998), there is a systematic shift in the sound speed profile in the interior that worsens agreement with helioseismology by a factor of ∼ 2 (heavy solid line in Fig. 2d — differences near the solar surface are due to extending the use of the OPAL equation of state to lower temperatures in this model). This composition effect was also demonstrated by solar models of Neuforge-Verheecke et al. (2001). Even larger systematic effects are allowed by the quoted uncertainties in the solar composition, and (to a lesser extent) the uncertainties in the OPAL opacities, the pp nuclear reaction rate, and the diffusion constants for gravitational settling, as shown in detail in our companion paper “Our Sun IV” (Boothroyd & Sackmann 2002). In Figure 2, the filled circles (connected by light solid lines) indicate the extremes of the range of δc/c profiles found in Boothroyd & Sackmann (2002) for solar models with “reasonable” variations in these 6http://www.krl.caltech.edu/∼aib/papdat.html
  • 13. – 13 – -0.003 -0.002 -0.001 0 0.001 0.002 0.003 0.004 0 0.1 0.2 0.3 0.4 0.5 0.6 0.7 0.8 0.9 1 adiabaticsoundspeedδc/c=(cO•−cmodel)/cO• radius r (RO• ) cases mass loss Exponential (a) Mi = 1.00 MO• Mi = 1.03 MO• Mi = 1.07 MO• range from other effects -0.003 -0.002 -0.001 0 0.001 0.002 0.003 0.004 0 0.1 0.2 0.3 0.4 0.5 0.6 0.7 0.8 0.9 1 adiabaticsoundspeedδc/c=(cO•−cmodel)/cO• radius r (RO• ) cases mass loss Step-function (b) Mi = 1.00 MO• Mi = 1.03 MO• Mi = 1.07 MO• range from other effects -0.003 -0.002 -0.001 0 0.001 0.002 0.003 0.004 0 0.1 0.2 0.3 0.4 0.5 0.6 0.7 0.8 0.9 1 adiabaticsoundspeedδc/c=(cO•−cmodel)/cO• radius r (RO• ) cases mass loss Linear (c) Mi = 1.00 MO• Mi = 1.03 MO• Mi = 1.07 MO• range from other effects -0.003 -0.002 -0.001 0 0.001 0.002 0.003 0.004 0 0.1 0.2 0.3 0.4 0.5 0.6 0.7 0.8 0.9 1 adiabaticsoundspeedδc/c=(cO•−cmodel)/cO• radius r (RO• ) OPAL eos down GS98 composition, Exponential cases: to 104 K (d) Mi = 1.00 MO• Mi = 1.03 MO• Mi = 1.07 MO• range from other effects Fig. 2.— The effects of mass loss on the adiabatic sound speed c for (a) exponential, (b) step-function, and (c) linear mass loss cases; (d) shows exponential mass loss cases, as in (a), except that it uses the more recent “GS98” composition of Grevesse & Sauval (1998) (with appropriate OPAL opacities) instead of the “GN93” composition of Grevesse & Noels (1993), and the OPAL equation of state is used at log T 4 (rather than at log ρ −2, which corresponds to log T 5.5). The heavy solid line is the reference standard solar model (no mass loss); the errorbars give the statistical error in the inferred helioseismic profile. Mass-losing cases are shown for initial solar masses Mi = 1.01 M⊙ (close dot-dashed line), Mi = 1.02 M⊙ (wide dot-dashed line), Mi = 1.03 M⊙ (heavy dotted line), Mi = 1.04 M⊙ (double-dotted line), Mi = 1.05 M⊙ (triple-dotted line), Mi = 1.06 M⊙ (quadruple-dotted line), and Mi = 1.07 M⊙ (heavy dashed line). The filled circles (connected by light solid line) show the range of variation in δc/c found to arise from reasonable variations in solar initial parameters, from our companion paper “Our Sun IV” (Boothroyd & Sackmann 2002).
  • 14. – 14 – input parameters (i.e., variations allowed by the quoted uncertainties). In the comvective envelope, the largest effects on the sound speed profile arises from the uncertainties in the observed solar radius and in the equation of state; in the bulk of the solar interior, the largest effects arise from uncertainties in the observed solar surface composition; in the core, the largest effect arises from the uncertainty in the pp nuclear reaction rate (Boothroyd & Sackmann 2002). Figure 2a, d demonstrates that all of our “exponential” mass loss models agree better with the he- lioseismic observations than the standard solar model, which has no mass loss (i.e., they lie closer to the zero line of perfect agreement). However, this improvement is clearly not significant: even for our most extreme “exponential” mass loss case (with Mi = 1.07 M⊙), the effect is only about one third as large as the maximum effect allowed by variations in other input solar parameters (also shown in Fig. 2). The rms sound speed differences provide a numerical measure of the extent of the above agreement between a given theoretical model and the profile inferred from helioseismic observations; these rms values for each of our mass-losing cases are given in Table 1 (for completeness, the fine-zoned cases are presented as well as the coarse-zoned ones, although the latter proved to be quite accurate enough, as discussed in § 2.2). The differences rms{δc/c} relative to the helioseismic sound speed profile are shown both for the entire Sun and for the region r < 0.6 R⊙ (where the latter region excludes the peak near r ∼ 0.7 R⊙ that results from neglect of rotation-induced mixing, and the envelope which is sensitive mostly to the solar radius and the equation of state); unlike the sound speed, the density profile does not respond in a localized way to local variations in the solar models, so only the rms{δρ/ρ} over the entire Sun is shown. The differences rms{∆c/c} (and rms{∆ρ/ρ}) relative to the corresponding theoretical standard (non-mass-losing) solar model are shown for the entire Sun, since they measure the differential effects of mass loss. Table 1 shows that the “exponential” Mi = 1.07 M⊙ cases have rms{δc/c} errors about 30% smaller than the corresponding standard solar models, but again this difference is not significant compared to the large variations that can arise from uncertainties in the other input solar parameters (shown in the last line of Table 1). This is perhaps most easily seen by comparing the relative rms measures: the “exponential” cases differ by rms{∆c/c} 0.0007 from their corresponding standard solar model, while the shifts in the sound speed profile from uncertainties in other input parameters can be as large as rms{∆c/c} ∼ 0.0018, nearly three times as large. In summary, none of our “exponential” mass loss cases with initial solar masses Mi ≤ 1.07 M⊙ can be ruled out by helioseismological observations; in fact, all other things being equal, these helioseismological observations slightly favor the “exponential” mass loss case with highest of our initial solar masses (Mi = 1.07 M⊙), although this is not statistically significant, as shown by Figure 2a, d and the rms values in Table 1. Detailed investigation of the effects of the semi-empirical mass loss law ˙M ∝ t−2.00±0.52 recently pre- sented by Wood et al. (2002) and discussed in § 1.1.2 above must wait for a future paper (A. I. Boothroyd & I.-J. Sackmann, in preparation). However, the total amount of mass lost by the Sun would be comparable to or smaller than that in our “exponential” mass loss case, and the evolution of the mass loss rate as a function of time would be not too dissimilar (in both cases, most of the mass loss occurs at quite early times). Thus a t−2 mass loss case should yield an effect on the solar sound speed profile similar to (or smaller than) that of our “exponential” mass loss cases of Figure 2a, d. Figure 2b presents our results for our “step-function” mass loss models; recall that this type of mass loss was chosen as the most extreme possibility that remains consistent with all the observational mass loss constraints (see § 2.1). Since the Sun remains more massive for a longer period in this case than for
  • 15. – 15 – 0.99 1 1.01 1.02 1.03 1.04 1.05 1.06 1.07 -4.5 -4 -3.5 -3 -2.5 -2 -1.5 -1 -0.5 0 SolarMass(relativetopresent) time (Gyr before present) (a)Exponential mass loss cases Mi = 1.07 MO• Mi = 1.06 MO• Mi = 1.05 MO• Mi = 1.04 MO• Mi = 1.03 MO• Mi = 1.02 MO• Mi = 1.01 MO• Mi = 1.00 MO• 0.99 1 1.01 1.02 1.03 1.04 1.05 1.06 1.07 -4.5 -4 -3.5 -3 -2.5 -2 -1.5 -1 -0.5 0 SolarMass(relativetopresent) time (Gyr before present) (b)Step-function mass loss cases Mi = 1.07 MO• Mi = 1.06 MO• Mi = 1.05 MO• Mi = 1.04 MO• Mi = 1.03 MO• Mi = 1.02 MO• Mi = 1.01 MO• Mi = 1.00 MO• 0.99 1 1.01 1.02 1.03 1.04 1.05 1.06 1.07 -4.5 -4 -3.5 -3 -2.5 -2 -1.5 -1 -0.5 0 SolarMass(relativetopresent) time (Gyr before present) (c)Linear mass loss cases Mi = 1.07 MO• Mi = 1.06 MO• Mi = 1.05 MO• Mi = 1.04 MO• Mi = 1.03 MO• Mi = 1.02 MO• Mi = 1.01 MO• Mi = 1.00 MO• Fig. 3.— Solar mass as a function of time for (a) exponential, (b) step-function, and (c) linear mass loss cases. the “exponential” mass loss cases (compare Fig. 3b with Fig. 3a), there is more of an impact on the Sun’s internal structure (compare Fig. 2b with Fig. 2a). Again, the mass-losing models with higher initial masses fit slightly (but not significantly) better than the standard non-mass-losing model, as shown by Figure 2b and the rms values in Table 1. Even our most extreme “step-function” case (Mi = 1.07 M⊙) differs from the standard solar model by an rms{∆c/c} 0.0010, as compared to 0.0018 from other uncertainties. As in the “exponential” mass loss case, none of the “step-function” mass loss cases can be ruled out by helioseismic observations. Figure 2c presents our results for the radical “linear” mass loss models; recall that these models violate the solar wind constraints from the lunar rock observations by about an order of magnitude (see § 2.1). Since the Sun remains remains more massive for a very long time compared to the other mass loss cases (compare Fig. 3c with Fig. 3a, b), there is even more of an impact on the Sun’s internal structure (compare Fig. 2c with Fig. 2a, b). Intermediate Mi values have the lowest rms{∆c/c} values, though again none of the differences are significant; but the most extreme “linear” Mi = 1.07 M⊙ differs from the standard solar model by rms{∆c/c} ∼ 0.0016, nearly as large as the largest effect of 0.0018 from other uncertainties. Even these radical “linear” mass loss cases cannot yet be ruled out by comparisons with the helioseismic observations.
  • 16. – 16 – 3.1.2. Position of Convection and Surface Helium Abundance Helioseismic observations measure the position of the base of the Sun’s convective envelope, namely Rce = 0.713±0.001 R⊙ (Basu & Antia 1997), and the surface helium abundance, namely, a mass fraction Ye ≈ 0.245 ± 0.005 (see discussion in our companion paper “Our Sun IV”: Boothroyd & Sackmann 2002). The values of Rce and Ye for both our reference standard solar model and for all of our mass-losing models are shown in Table 1. The mass-losing cases all have values of Rce and Ye very close to those of the standard solar model, all of them being consistent with the helioseismic observations. 3.2. Other Effects of Modest Mass Loss 3.2.1. Solar Lithium Depletion The lithium depletion in a main sequence star, relative to its initial lithium abundance, can result from three different causes. (1) There can be significant lithium depletion from pre-main-sequence lithium burning at early times, when the convective envelope reaches deep into the star. (2) Rotationally induced mixing on the main sequence can transport lithium down from the convective envelope to regions hot enough for lithium burning. (3) Mass loss on the main sequence can cause the convective envelope to move inwards and engulf lithium-depleted regions. The Sun’s initial lithium abundance is assumed to be equal to the meteoritic abundance, and the deple- tion factor fLi is obtained by comparing this initial abundance with the present observed solar photospheric lithium abundance. This observed solar lithium depletion factor is fLi = 160 ± 40 (Grevesse & Sauval 1998). For pre-main-sequence lithium depletion, our reference standard solar model predicts a lithium depletion factor of fLi ∼ 24, although this is very sensitive to the solar metallicity (i.e., Z/X value, as well as uncer- tainties in diffusion) and to the choice of low-temperature molecular opacities; values of fLi from 11 to 70 can be obtained (see our companion paper “Our Sun IV”: Boothroyd & Sackmann 2002). For rotation-induced main sequence lithium depletion, there is no theoretical prediction; instead, the observed main sequence lithium depletion is used to constrain the free parameters in the theoretical treatment (see, e.g., Schatzman 1977; Lebreton & Maeder 1987; Pinsonneault et al. 1989; Charbonnel et al. 1992; Richard et al. 1996). For main sequence mass loss, the extent of main sequence lithium depletion depends primarily on the initial solar mass, and only weakly on the timescale of mass loss. Boothroyd et al. (1991) used the observed solar lithium depletion to obtain a limit on solar main sequence mass loss, finding that the maximum mass loss allowed was 0.1 M⊙ (i.e., a maximum initial solar mass of Mi ≈ 1.1 M⊙). However, as discussed in § 1, such an extreme mass loss case violates the constraint from the requirement that the early Earth not lose its water via a moist greenhouse effect, which would occur for Mi > 1.07 M⊙. This constraint is based on a cloud-free climate model; a very slight increase in Mi might be allowed if clouds were taken into account. As the Sun’s initial mass is increased above 1 M⊙, there are two competing effects. Higher initial masses have less pre-main-sequence lithium depletion; on the other hand, the higher the initial mass, the more mass loss has to take place, and thus the more lithium depletion takes place on the main sequence (as the convective envelope sheds lithium-rich material from the surface and engulfs lithium-depleted material from below). As may be seen from Table 1, for initial solar masses in the range 1.01 M⊙ ≤ Mi 1.04 M⊙, the first of these effects dominates, and the total lithium depletion is slightly less than in the standard (non-mass-losing) model; slightly stronger rotation-induced mixing would be required in order to account for the observed lithium depletion. For masses Mi 1.05 M⊙, the mass loss dominates; however, even for our
  • 17. – 17 – most extreme mass loss cases (Mi = 1.07 M⊙), the total lithium depletion (from pre-main-sequence burning plus mass loss effects) is only fLi ∼ 30 − 50. This is at most factor of 2 more lithium depletion than in the standard (non-mass-losing) model with fLi ∼ 24. The modest amount of mass loss considered here (∆M ≤ 0.07 M⊙) has only a minor effect on the extent of solar lithium depletion — adding even the maximum possible mass loss only increases the lithium depletion by a factor of 2, relative to the depletion on the pre-main-sequence. This effect is smaller than the factor-of-2.5 effects on pre-main-sequence lithium depletion caused by uncertainties in other physical parameters, as discussed above and in our companion paper “Our Sun IV” (Boothroyd & Sackmann 2002). In these mass-losing models, rotational mixing would still be required, to account for the majority of the Sun’s main-sequence lithium depletion; therefore the arguments of Swenson et al. (1994) (who showed that mass loss could not be responsible for the majority of the observed Hyades lithium depletion) are not applicable, as discussed in § 1.1.3. The observed solar lithium depletion thus cannot be used to constrain these mass-losing solar models. 3.2.2. Solar Beryllium Depletion The observed solar beryllium abundance is log ε(9 Be) = 1.40±0.09, consistent with no depletion relative to the meteoritic value of log ε(9 Be) = 1.42 ± 0.04. The uncertainties given for these values imply that solar beryllium cannot have been depleted by more than a factor of 2 (3-σ upper limit). A standard solar model has negligible beryllium depletion (∼ 1%); our mass-losing solar models predict slightly larger depletions, but are still all consistent with the observational limit. The most extreme of the “exponential” mass loss cases (Mi = 1.07 M⊙) depleted beryllium by a relatively small amount (a factor of 1.17). Even the most extreme of the “step-function” and “linear” mass loss cases yielded only ∼ 2-σ beryllium depletion factors (of 1.53 and 1.63, respectively); the Mi = 1.04 M⊙ cases depleted beryllium by negligible amounts, less than 3%. In other words, all the mass losing cases deplete beryllium by significantly less than the observational upper limit of a factor of 2. 3.2.3. Neutrino Fluxes As may be seen from Table 1, the modest mass loss considered here has almost no effect on the predicted solar neutrino fluxes. Variations are at most a few percent in the predicted 8 B flux and in the predicted capture rate for the chlorine experiment (as compared to uncertainties of ∼ 30% from other causes), and less than a percent in the predicted capture rate for the gallium experiment (as compared to uncertainties of at least several percent from other causes) — the other sources of uncertainty in neutrino fluxes are discussed elsewhere (see, e.g., Bahcall et al. 1995, 2001; Boothroyd & Sackmann 2002). 3.3. The Young Earth and the Solar Flux At present, an airless, rapidly-rotating body at Earth’s orbit would have a temperature of −18◦ C (255 K), if it had Earth’s present albedo and emissivity (Sagan & Chyba 1997), but the Earth’s present mean surface temperature is observed to be +15◦ C (288 K). In other words, at present the greenhouse effect raises Earth’s surface temperature by 33◦ C. The main greenhouse gases in the Earth’s atmosphere are CO2 and
  • 18. – 18 – H2O. If the atmospheric CO2 abundance were constant (at its present value), and the H2O abundance were determined by its equilibrium vapor pressure, then 2 Gyr ago the Earth’s surface temperature would have been below 0◦ C (Sagan & Mullen 1972; Sagan 1977; Pollack 1979). If the early Earth’s surface temperature were below the freezing point of water, extensive glaciation would be expected; such glaciation would raise the Earth’s albedo, delaying the time when the surface temperature reached 0◦ C. In other words, one would expect Earth to be fully glaciated as recently as 1 Gyr in the past (North 1975; Wang & Stoner 1980). On the other hand, a number of independent observations indicate that the Earth was at least warm enough for liquid water to exist as far back as 4 Gyr ago. Sedimentary rocks, which are laid down under water, have been dated to at least 4 Gyr ago (Bowring et al. 1989; Nutman et al. 1984). Liquid water is necessary to explain the existence of the widespread microorganisms whose fossils are found in rocks dated as far back as 3.8 Gyr ago (Cogley & Henderson-Sellers 1984; Mojzsis et al. 1996; Eiler et al. 1997). Tidal or intertidal stromatolite fossils have been dated to ∼ 3.5 Gyr ago, alluvial detrital uraninite grains as far back as 3 Gyr, and turbidites and ripple marks have been dated as far back as 3.5 Gyr (Eriksson 1982). In fact, there is evidence not only that liquid water existed on the early Earth, but also that Earth was considerably warmer in the past than it is today. To start with, there is no evidence of glaciation before 2.7 Gyr ago (Kasting 1989), and it has been suggested that tillites prior to 2 Gyr ago are actually due to impacts rather than glaciers (Oberbeck et al. 1993). Archaeobacteria exhibit extreme thermophilic trends (Woese 1987). High ocean temperatures of ∼ 40◦ C in the period 2.6 to 3.5 Gyr ago are suggested by sulphur isotope measurements (Ohmotu & Felder 1987). Average surface temperatures of tens of degrees Celsius in the period 2.5 to 3.5 Gyr ago are indicated by deuterium to 18 O ratios (Knauth & Epstein 1976). Temperatures as high as 80◦ C in the period ∼ 3.8 Gyr ago are suggested by differences in 18 O isotopic data between coexisting cherts and phosphates (Karhu & Epstein 1986), although the results are subject to interpretation. The above “weak Sun paradox”, of a faint young Sun and a young Earth warm enough for liquid water, has traditionally been explained by invoking a much stronger greenhouse effect for ancient Earth. This would be driven by extremely high (i.e., non-constant) CO2 concentrations in Earth’s early atmosphere, with partial CO2 pressures between 0.2 and 10 bars 4.5 Gyr ago (Pollack 1979; Kuhn & Kasting 1983; Kasting & Ackerman 1986; Kasting 1987). Qualitatively, high CO2 concentrations can be justified on the basis of theoretical feedback mechanisms linking mineral dissolution to liquid water and thus to atmospheric CO2 (Walker, Hays, & Kasting 1981). Although such massive amounts of CO2 in the Earth’s early atmosphere are a possible solution to the “weak Sun paradox”, they are not mandated; there is little experimental evidence available on which to base a choice of CO2 concentration (Canuto et al. 1983; Kuhn, Walker, & Marshall 1989). Indeed, very high concentrations may prove to be inconsistent with derived weathering rates (Holland, Lazar, & McCaffrey 1986). The recent work of Rye et al. (1995) places an upper limit of 0.04 bar on the partial pressure of CO2 in the period from 2.75 to 2.2 Gyr ago, based on the absence of siderite in paleosols; earlier work by Holland & Zbinden (1986) estimated a partial pressure of CO2 of 0.004 bar, but with the same upper limit of 0.04 bar. For Earth surface temperatures between 5 and 20◦ C during that period, climate models predict a partial pressure of CO2 between 0.03 and 0.3 bar (Kasting 1987), barely consistent with the upper limit of 0.04 bar. In other words, there is little evidence for a strong CO2 greenhouse effect on ancient Earth. Actual measurements of CO2 abundances are available only for relatively recent times, i.e., only for the last ∼ 0.45 Gyr (see, e.g., Crowley & Berner 2001; Retallack 2001). These latter measurements show major variations in the CO2 abundance over the past 0.45 Gyr. The lowest values are comparable to the present-day CO2 abundance of about 350 ppmV, namely, 0.00035 bar (or the pre-industrial-age value of
  • 19. – 19 – ∼ 300 ppmV — note that “ppmV” refers to parts per million by volume); the highest values measured over the last 0.45 Gyr are ∼ 5000 ppmV. However, from these measurements, there is no clear evidence of a long-term trend of higher CO2 abundances in the relatively recent past (i.e., the last 0.4 Gyr). A non-CO2 greenhouse has been suggested for the early Earth (Kasting 1982; Lovelock 1988). Recently, Sagan & Chyba (1997) calculated that a strong greenhouse contribution from ammonia was possible, if a concentration of [NH3] ∼ 10−5 could be maintained. Normally, the ammonia would be photodissociated by solar UV flux on a timescale of 10 years. They pointed out that ammonia could be shielded from the UV radiation by high-altitude organic solids produced from photolysis of methane — a photochemical smog, similar to that observed in the upper atmosphere of Titan (Ragas & Pollack 1980). However, the ammonia lifetime depends sensitively on two parameters, the fraction f of the methane irradiation products that are organic solids, and the sedimentation timescale t of the smog; Sagan & Chyba (1997) take as reasonable values f 0.1 and 0.5 yr t 3 yr. For f 0.5, or t ∼ 3 yr, the ammonia lifetime is long enough for the required ammonia concentration to be maintained, given a reasonable amount of resupply. However, for f ∼ 1 and t 1 yr, the ammonia lifetime is less than 200 yr, which would require excessively large amounts of ammonia production to maintain the required ammonia greenhouse effect. Sagan & Chyba (1997) also note that an atmosphere rich in N2, with minor CO2 and CH4 components, could have adequate self-shielding of NH3 from photodissociation (allowing an ammonia greenhouse), only as long as the ratio CH4/CO2 1 was maintained. In other words, for the early Earth, a smog-shielded ammonia greenhouse is a viable solution to the “weak Sun paradox” under certain conditions, but fails under others. As discussed above, it is not clear whether the greenhouse effect could suffice to warm the early Earth. A bright young Sun, with stronger illumination of the young Earth than from the standard solar model, would require a less extreme early greenhouse effect to prevent the early Earth from freezing over. 3.4. The Young Mars and the Solar Flux For Mars, there are also indications of higher surface temperatures in the past, that are even harder to explain by a greenhouse effect. There is evidence of large scale flow of liquid water ∼ 3.8 Gyr ago, from the drainage channels and valley networks visible on the heavily cratered ancient surface of Mars (Pollack et al. 1987; Carr 1996); there is some evidence for lakes (Goldspiel & Squyres 1991; Parker et al. 1993), and possibly even oceans 3 to 4 Gyr ago (Schaefer 1990; Baker et al. 1991). Even if the channels were formed by subsurface sapping of groundwater, Martian surface temperatures significantly higher than today would have been required for liquid water to be present near the surface; if the suggested evidence of glacial markings were confirmed, this would require temperatures high enough for precipitation to occur (Whitmire et al. 1995). Kasting (1991) demonstrated that there is an upper limit to the greenhouse warming of Mars that is possible from CO2. He showed that the maximum possible greenhouse warming occurs at a Martian surface CO2 pressure of 5 bars — with more CO2, the added greenhouse warming is outweighed by the cooling effects of increased CO2 condensation in the upper Martian atmosphere. He demonstrated that the requirement of liquid water on Mars, i.e., a surface temperature of at least 273◦ K, demands a solar flux value S ≥ 0.86 (where S is the solar flux relative to its present value), even with the most favorable greenhouse warming case of a CO2 pressure of 5 bars. At 3.8 Gyr ago, when liquid water is thought to have existed on Mars, the standard solar model yields a value of S = 0.75 (see Fig. 4), totally insufficient relative to Kasting’s minimum value of 0.86. Kasting (1991) states that the uncertainties in his Martian climate model might
  • 20. – 20 – push the limiting value of S from 0.86 down to 0.80 (albeit for an unreasonably low Martian albedo), but even this lower S requirement is incompatible with the standard solar model. The standard solar model does not reach this extreme limit of S = 0.80 until 2.9 Gyr ago, and reaches S = 0.86 later still, at 1.9 Gyr ago (see Fig. 4) — in either case, far too late to account for liquid water on Mars 3.8 Gyr ago. With CO2 pressures either lower or higher than 5 bar, Kasting (1991) shows that even higher solar flux values would be required to yield liquid water. He presents the solar flux required to obtain liquid water as a function of the CO2 pressure: e.g., a pressure of 3 bar would require S 0.92, and a pressure of 10 bar would require S 0.90. The standard solar model is totally incapable of yielding such high fluxes 3.8 Gyr ago (see Fig. 4). In other words, for a standard solar model, CO2 greenhouse warming cannot under any circumstances yield liquid water on early Mars. A preliminary study by Yung, Nair, & Gerstell (1997) suggested the possibility that relatively small amounts of atmospheric SO2 (∼ 10−7 bar) might have served as a powerful source of heating in the upper atmosphere of early Mars (due to its strong absorption in the near UV), which might have been sufficient to prevent the condensation of CO2 (though they noted that SO2 in the presence of liquid water would produce H2SO4, which would lead to some countervailing cooling). Murphy & Bass (1998) pointed out a more important effect of the H2SO4: even ∼ 10−11 bar of SO2 in the Martian atmosphere, 4 orders of magnitude less than proposed by Yung et al. (1997), would result in a pH acidic enough to attack solid rocks and precipitate gypsum (CaSO4*2H2O), removing the SO2 from the atmosphere. Some temperature increase on early Mars is expected from geothermal heating (Squyres 1993), but by itself it is insufficient (Whitmire et al. 1995). With the above greenhouse and geothermal heating apparently incapable of yielding liquid water on early Mars, given the illumination from a standard solar model, let us consider the possibility of a non- standard, brighter young Sun. Figure 4 presents the relative flux values S throughout the Sun’s past history yielded by our mass-losing solar models with initial masses from Mi = 1.01 to 1.07 M⊙ (as well as that from a standard solar model). The requirement that the early Earth not lose its water via a moist greenhouse effect leads to an upper limit of S ≤ 1.1, corresponding to the upper edge of the figures. The lower luminosity constraints from the requirement that liquid water be present 3.8 Gyr ago on early Mars are shown by the vertical arrows; the heavy double arrow corresponds to the limit S ≥ 0.86 obtained by Kasting (1991), and the lighter single arrow to his extreme (less probable) limit S ≥ 0.80. Figure 4a presents the solar flux S at Earth and Mars (relative to their present flux) from the time of solar system formation until the present, for our “exponential” mass loss cases; the flux for the standard solar model (without mass loss) is also shown, by the solid line. Note that the mass loss time scale is between 0.755 and 0.551 Gyr, with initial mass loss rates from 1.33 × 10⁻¹¹ to 1.27 × 10⁻¹⁰ M⊙ yr−1 , for initial masses from 1.01 to 1.07 M⊙, respectively. The exponential decline as a function of time of these mass loss rates means that they are generally consistent with the observations of π01 UMa, κ1 Cet, and β Com presented by Gaidos et al. (2000), who obtained upper limits of 5×10⁻¹¹ , 4×10⁻¹¹ , and 4×10⁻¹¹ M⊙ yr−1 , respectively, for the mass loss rates of these three young Sun-like stars (note that the Mi = 1.07 M⊙ case is only marginally consistent, lying very slightly above the π01 UMa limit: see Fig. 1). Our results demonstrate that, for the “exponential” mass loss cases, the Mi = 1.07 M⊙ case — and only this case — is marginally consistent with the Kasting (1991) Mars flux requirement S 0.86 at an age of ∼ 3.8 Gyr ago; if the Martian surface CO2 pressure 3.8 Gyr ago was either much lower or much higher than 5 bar, even the Mi = 1.07 M⊙ case would be ruled out. (If the unlikely extreme Kasting flux limit of S 0.80 is used, initial masses 1.03 M⊙ Mi 1.07 M⊙ would be permissible for a CO2 pressure of 5 bars, and the Mi = 1.07 M⊙ case would be marginally compatible with pressures between ∼ 3 and ∼ 12 bar.)
  • 21. – 21 – 0.7 0.75 0.8 0.85 0.9 0.95 1 1.05 1.1 -4.5 -4 -3.5 -3 -2.5 -2 -1.5 -1 -0.5 0 SolarFluxatEarthorMars(relativetopresent) time (Gyr before present) Marslimits 1.07 1.00 (a)Exponential mass loss cases Mi = 1.07 MO• Mi = 1.06 MO• Mi = 1.05 MO• Mi = 1.04 MO• Mi = 1.03 MO• Mi = 1.02 MO• Mi = 1.01 MO• Mi = 1.00 MO• 0.7 0.75 0.8 0.85 0.9 0.95 1 1.05 1.1 -4.5 -4 -3.5 -3 -2.5 -2 -1.5 -1 -0.5 0 SolarFluxatEarthorMars(relativetopresent) time (Gyr before present) 1.07 1.00 (b)Step-function mass loss cases Mi = 1.07 MO• Mi = 1.06 MO• Mi = 1.05 MO• Mi = 1.04 MO• Mi = 1.03 MO• Mi = 1.02 MO• Mi = 1.01 MO• Mi = 1.00 MO• 0.7 0.75 0.8 0.85 0.9 0.95 1 1.05 1.1 -4.5 -4 -3.5 -3 -2.5 -2 -1.5 -1 -0.5 0 SolarFluxatEarthorMars(relativetopresent) time (Gyr before present) 1.07 1.00 (c)Linear mass loss cases Mi = 1.07 MO• Mi = 1.06 MO• Mi = 1.05 MO• Mi = 1.04 MO• Mi = 1.03 MO• Mi = 1.02 MO• Mi = 1.01 MO• Mi = 1.00 MO• Fig. 4.— Solar flux at the planets as a function of time (relative to the present flux), for (a) exponential, (b) step-function, and (c) linear mass loss cases. Heavy double arrows give the lower flux limit of Kasting (1991) for the presence of water on early Mars; light single arrows give his extreme lower flux limit (for a model with an unrealistically low Martian surface albedo). Since the semi-empirical mass loss law ˙M ∝ t−2.00±0.52 recently presented by Wood et al. (2002) is strongly peaked at early times (as discussed in § 1.1.2), it tends to yield a relatively small solar mass ∼ 3.8 Gyr ago. A t−2 mass loss relation, normalized by the present solar mass loss rate, would yield M(−3.8 Gyr) ∼ 1.001 M⊙; by tweaking parameters to their extreme limits, one might obtain M(−3.8 Gyr) ∼ 1.02 M⊙. Comparing the flux relations in Figure 4 with the solar mass as a function of time in Figure 2, one can estimate that a solar mass of M(−3.8 Gyr) 1.018 M⊙ is needed in order to satisfy the Kasting (1991) Mars flux requirement S(−3.8 Gyr) 0.86. Thus the mass loss formula of Wood et al. (2002) might possibly be capable of satisfying the Mars flux requirement. This possibility will be tested in a future paper (A. I. Boothroyd & I.-J. Sackmann, in preparation). Figure 4b presents the extreme “step-function” mass loss case. This case has a constant mass loss rate for the first 1.6 Gyr ( ˙M = 5.69 × 10⁻¹² to 4.32 × 10⁻¹¹ M⊙ yr−1 , for initial solar masses of 1.01 to 1.07 M⊙, respectively), and a low mass loss rate thereafter. These mass loss rates are all consistent with the stellar mass loss observations of Gaidos et al. (2000) for π01 UMa, κ1 Cet, and β Com quoted above. These “step-function” cases have a longer mass loss timescale than the “exponential” one, and thus yield a
  • 22. – 22 – higher solar flux for the first 1.6 Gyr. (Due to the way the “step-function” cases were defined, after the first 1.6 Gyr their solar flux is very close to that of the standard solar model.) Our results demonstrate that, for this extreme “step-function” mass loss case, initial masses 1.04 M⊙ Mi 1.07 M⊙ are capable of yielding liquid water on Mars until 3.8 Gyr ago. Figure 4c similarly presents the radical “linear” mass loss case. This case has a high initial mass loss rate ( ˙M = 4.35 × 10⁻¹² to 3.04 × 10⁻¹¹ M⊙ yr−1 , for initial solar masses of 1.01 to 1.07 M⊙, respectively), which remains relatively high throughout much of the Sun’s lifetime (since it declines linearly with time to reach the present solar mass loss rate at the present time). These mass loss cases are consistent with the stellar mass loss observations of Gaidos et al. (2000) for π01 UMa, κ1 Cet, and β Com quoted above. However, they are not consistent with the lunar rock observations of the solar wind over the past 3 Gyr, violating this latter constraint by an order of magnitude. Our results demonstrate that, for this radical “linear” mass loss case, initial masses 1.03 M⊙ Mi 1.07 M⊙ are capable of yielding liquid water on Mars until 3.8 Gyr ago. The lower end of this range is mildly (but not significantly) favored by the helioseismology; note that such cases with Mi ∼ 1.04 M⊙ have remarkably constant solar flux over the first 3 Gyr. 3.5. The Favored Cases of a Bright Young Sun A mass-losing solar model will always be brighter at birth than the standard solar model, since the luminosity LZAMS at the zero age main sequence (ZAMS) is roughly proportional to the mass to the fourth power (LZAMS ∝ M4 i ). For a mass-losing Sun, the orbital radii of the planets varies inversely with the solar mass (ri ∝ 1/Mi, due to conservation of angular momentum); the initial flux at the planets is thus proportional to the sixth power of the initial solar mass (FZAMS ∝ LZAMS/r2 i ∝ M6 i ). Figure 4 illustrates the solar flux at the planets as a function of time, demonstrating how much higher the early solar flux at the planets is in the mass-losing cases than in the standard (non-mass-losing) model. For clarity, only the flux for our “preferred” initial masses for each type of mass loss are illustrated in Figure 5. Our preferred “exponential” case (with Mi = 1.07 M⊙) predicts a solar flux at the planets about 5% higher at birth than at present, considerably higher than that indicated by the standard solar model (which predicts a flux 29% lower than at present). At 3.8 Gyr ago, the flux for our “exponential” case would have been only 16% lower than at present (cf. 25% for the standard model). For our preferred “step-function” case (with Mi = 1.04 M⊙), the flux at the planets would have been only 10% lower at birth than at present (cf. 29% for the standard model); at 3.8 Gyr ago, the flux would have been only 14% lower than at present (cf. 25% for the standard model). For these “exponential” and “step-function” cases, the flux at the planets for the past 3 billion years would be essentially the same as that predicted by the standard solar model. Our radical “linear” case (with Mi = 1.04 M⊙) would have had an almost constant solar flux at the planets for the first 3 Gyr, namely, only 11% lower than at present (cf. 29% to 12% lower for the standard model); for this case, the flux would be close to that predicted by the standard solar model only during the last billion years. Figure 6 presents the evolution in the HR diagram of our preferred exponential and step-function mass- losing cases (heavy dashed and dot-dashed curves, respectively); these cases are in agreement with the helioseismic observations, with the existence of water on early Mars, and with the lunar rock observations of solar mass loss. (A radical linear case, agreeing with the first two of these constraints but disagreeing with the third one, is shown by the light dotted curve.) For comparison, the standard solar model is also displayed (solid line). Figure 6 illustrates that the early evolution of mass-losing solar models is in the
  • 23. – 23 – 0.7 0.8 0.9 1 -4.5 -4 -3.5 -3 -2.5 -2 -1.5 -1 -0.5 0 time (Gyr before present) (c) linear Preferred SolarFluxatEarthorMars(relativetopresent) Mi = 1.04 MO• Mi = 1.00 MO• 0.7 0.8 0.9 1 (b) step-function Preferred Mi = 1.04 MO• Mi = 1.00 MO• 0.7 0.8 0.9 1 (b) step-function Preferred 0.7 0.8 0.9 1 (b) step-function Preferred 0.7 0.8 0.9 1 (a) exponential Preferred Mi = 1.07 MO• Mi = 1.00 MO• 0.7 0.8 0.9 1 (a) exponential Preferred 0.7 0.8 0.9 1 (a) exponential Preferred Fig. 5.— Solar flux at the planets (relative to the present flux) as a function of time for our preferred initial masses, for each type of mass loss that we considered. Heavy double arrows give the lower flux limit of Kasting (1991) for the presence of water on early Mars; light single arrows give his extreme lower flux limit (for a model with an unrealistically low Martian surface albedo). opposite direction in the HR diagram to the standard solar model: the mass-losing models initially become less luminous and slightly redder (instead of more luminous and slightly bluer). Figure 6 also illustrates that in the past, the Sun’s surface temperature changed only by negligible amounts (1 or 2%), both for the standard and the mass losing cases, in contrast to the relatively large changes in the luminosity. 4. Conclusions A slightly higher initial solar mass, producing a brighter young Sun, turns out to be a viable explanation for warm temperatures on early Earth and Mars, that otherwise are difficult to account for (particularly for Mars). Such a higher initial solar mass leaves a fingerprint on the Sun’s present internal structure that is large enough to be detectable in principle via helioseismic observations. Our computations demonstrated that all 21 of the mass-losing solar models that we considered were consistent with the helioseismic observations; in fact, our preferred mass-losing cases were in marginally (though not significantly) better agreement with the helioseismology than the standard solar model was. However, there are still significant uncertainties in the
  • 24. – 24 – -0.15 -0.1 -0.05 0 3.7553.763.765 0.7 0.75 0.8 0.85 0.9 0.95 1.0 56505700575058005850 log(L/LO•) LuminosityL(LO•) log Te Effective Temperature Te (K) 1.07 ZAMS 1.04 ZAMS 1.00 ZAMS present Sun 1.04 1.07 1.04 linear Preferred mass loss cases Mi = 1.00 MO• (Standard Sun: no mass loss) Mi = 1.07 MO• Exponential mass loss Mi = 1.04 MO• Step-function mass loss Mi = 1.04 MO• Linear mass loss Fig. 6.— Evolution in the H-R diagram of the standard solar model, and of our preferred mass loss cases for each type of mass loss considered. The “ZAMS” points shown are actually ∼ 50 Myr subsequent to the start of nuclear burning on the main sequence, i.e., the rapid loop due to initial CN-cycle burning is omitted for clarity. observed solar composition and in the input physics on which the solar models are based; these uncertainties have a slightly larger effect on the Sun’s present internal structure than the fingerprint left from early solar mass loss. Future improvements by a factor of 2 or so in the accuracy of these input parameters could reduce the size of the uncertainties below the level of the fingerprints left by a more massive, brighter young Sun, allowing one to determine whether early solar mass loss took place or not. Also urgently needed are more measurements of mass loss rates from other young stars similar to the young Sun, and more measurements from our solar system that can be used to estimate the solar wind in the past. We are indebted to Prof. Marc H. Pinsonneault for helpful discussions on diffusion and for providing us with his diffusion code. We are grateful to Prof. Sarbani Basu for discussions of helioseismology, and for providing us with the current helioseismic reference model; we are also grateful to Prof. Dimitri M. Mihalas, for providing us with his equation-of-state code. We wish to thank Prof. Charles A. Barnes, Prof. Yuk L. Yung, and Dr. Mimi F. Gerstell for thoughtful discussions and encouragement. We wish to acknowledge the support provided by Prof. Thomas A. Tombrello, Chairman of the Division of Physics, Math, and Astronomy, and Prof. Robert D. McKeown, Head of the W. K. Kellogg Radiation Laboratory. One of us (I.-J. S.) wishes to thank Alexandra R. Christy, her daughter, and Prof. Robert F. Christy, her husband, for their supportiveness, and Robert F. Christy for critical analysis and helpful comments. One of us (A. I. B.) wishes to thank Prof. Peter G. Martin and Prof. J. Richard Bond for their support, and M. Elaine Boothroyd, his wife, for her patience and encouragement. This work was supported by a grant NAG5-7166 from the Sun- Earth Connection Program of the Supporting Research and Technology and Suborbital Program in Solar Physics of the National Aeronautics and Space Administration, and by the National Science Foundation grant NSF-0071856 to the Kellogg Radiation Laboratory.
  • 25. – 25 – REFERENCES Alexander, D. R., & Ferguson, J. W. 1994, ApJ, 437, 879 Angulo, C. et al. 1999, Nucl. Phys. A, 656, 3 Aufderheide, M. B., Bloom, S. B., Resler, D. A., & Goodman, C. D. 1994, Phys. Rev. C, 49, 678 Ayres, T. R. 1997, Geophys. Res., 102, 1641 Bahcall, J. N., Chen, X. L., & Kamionkowski, M. 1998, Phys. Rev. C, 57, 2756 Bahcall, J. N., Pinsonneault, M. H., & Basu, S. 2001, ApJ, 555, 990 Bahcall, J. N., Pinsonneault, M. H., & Wasserburg, G. J. 1995, Rev. Mod. Phys., 67, 781 Bahcall, J. N., & Ulrich, R. K. 1988, Rev. Mod. Phys., 60, 297 Baker, V. R., Strom, R. G., Gulick, V. C., Kargel, J. S., Komatsu, G., & Kale, V. S. 1991, Nature, 352, 589 Balachandran, S. 1995, ApJ, 446, 203 Basu, S., & Antia H. M. 1997, MNRAS, 287, 189 Basu, S., Pinsonneault, M. H., & Bahcall, J. N. 2000, ApJ, 529, 1084 Boothroyd, A. I., & Sackmann, I.-J. 2002, ApJ, in press (Our Sun V) Boothroyd, A. I., Sackmann, I.-J., & Fowler, W. A. 1991, ApJ, 377, 318 Bowring, S. A., Williams, I. S., & Compston, W. 1989, Geology, 17, 971 Brown, A., Veal´e, A., Judge, P., Bookbinder, J. A., & Hubeny, I. 1990, ApJ, 361, 320 Brun, A. S., Turck-Chi`eze, S., & Zahn, J. P. 1999, ApJ, 525, 1032 Caffee, M., Hohenberg, C., & Swindle, T. 1987, ApJ, 313, L31 Canuto, V. M., Levine, J. S., Augustsson, T. R., Imhoff, C. L., & Giampapa, M. S. 1983, Nature, 305, 281 Carr, M. H. 1996, Water on Mars (New York: Oxford Univ. Press) Charbonnel, C., Vauclair, S., & Zahn, J.-P. 1992, A&A, 255, 191 Christensen-Dalsgaard, J., & D¨appen, W. 1992, A&A Rev., 4, 267 Cogley, J. G., & Henderson-Sellers, A. 1984, Rev. Geophys. Space Phys., 22, 131 Cohen, E. R., & Taylor, B. N. 1986, Codata Bulletin No. 63 (New York: Pergamon) Cox, A. N., Guzik, J. A., & Kidman, R. B. 1989, ApJ, 342, 1187 Cox, A. N., & Stewart, J. N. 1970, ApJS, 19, 243 Crowley, T. J., & Berner, R. A. 2001, Science, 292, 870 D¨appen, W., Mihalas, D., Hummer, D. G., & Mihalas, B. 1988, ApJ, 332, 261
  • 26. – 26 – Eiler, J. M., Mojzsis, S. J., & Arrhenius, G. 1997, Nature, 386, 665 Eriksson, K. A. 1982, Tectonophysics, 81, 179 Gaidos, E. J., G¨udel, M., & Blake, G. A. 2000, Geophys. Res. Lett., 27, 501 Geiss, J. 1973, in Proc. 13th Intl. Cosmic Ray Conf., vol. 5 (Denver: Univ. of Denver), 3375 Geiss, J., & Bochsler, P. 1991, in The Sun in Time, ed. C. Sonnett, M. Giampapa, & M. Matthews (Tucson: Univ. Arizona Press), 98 Goldspiel, J., & Squyres, S. W. 1991, Icarus, 89, 392 Grevesse, N., & Noels, A. 1993, in Origin and Evolution of the Elements, ed. N. Prantzos, E. Vangioni-Flam, & M. Cass´e (Cambridge: Cambridge Univ. Press), 15 Grevesse, N., & Sauval, A. J. 1998, Space Sci. Rev., 85, 161 Gruzinov, A. V., & Bahcall, J. N. 1997, ApJ, 490, 437 Gruzinov, A. V., & Bahcall, J. N. 1998, ApJ, 504, 996 Guenther, D. B. 1989, ApJ, 339, 1156 Guenther, D. B., Demarque, P., Kim, Y.-C., & Pinsonneault, M. H. 1992, ApJ, 387, 372 Guzik, J. A., & Cox, A. N. 1995, ApJ, 448, 905 Guzik, J. A., Willson, L. A., & Brunish, W. M. 1987, ApJ, 319, 957 Hobbs, L. M., & Pilachowski, C. 1988, ApJ, 334, 734 Holland, H. D., Lazar, B., & McCaffrey, M. 1986, Nature, 320, 27 Holland, H. D., & Zbinden, E. A. 1986, Paleosols and the evolution of the atmosphere, Part I., in Physical and Chemical Weathering in Geochemical Cycles, ed. A. Lerman & M. Meybeck (NATO ASI Institute) Iben, I., Jr. 1975, ApJ, 196, 546 Iglesias, C. A., & Rogers, F. J. 1996, ApJ, 464, 943 Karhu, J., & Epstein, S. 1986, Geochim. Cosmochim. Acta, 50, 1745 Kasting, J. 1982, J. Geophys. Res., 87, 3091 Kasting, J. 1987, Precambrian Res., 34, 205 Kasting, J. 1988, Icarus, 74, 472 Kasting, J. 1989, Palaeogeogr. Palaeoclimat. Palaeocol., 75, 83 Kasting, J. 1991, Icarus, 94, 1 Kasting, J., & Ackerman, T. P. 1986, Science, 234, 1383 Kasting, J. F., Whitmire, D. P., & Reynolds, R. T. 1993, Icarus, 101, 108
  • 27. – 27 – Kerridge, J. F., Signer, P., Wieler, R., Becker, R. H., & Pepin, R. O. 1991, in The Sun in Time, ed. C. Sonnett, M. Giampapa, & M. Matthews (Tucson: Univ. Arizona Press), 389 Knauth, L. P., & Epstein, S. 1976, Geochim. Cosmochim. Acta, 40, 1095 Kuhn, W. R., & Kasting, J. F. 1983, Nature, 301, 53 Kuhn, W. R., Walker, J. C. G., & Marshall, H. G. 1989, J. Geophys. Res., 94, 11129 Lebreton, Y., & Maeder, A. 1987, A&A, 175, 99 Lovelock, J. 1988, The Ages of Gaia (London: Norton), chap. 4 Michaud, G., & Proffitt, C. R. 1993, in IAU Symp. 137, Inside the Stars, ed. A. Baglin & W. W. Weiss (San Francisco: ASP), 246 Mojzsis, S. J., Arrhenius, G., McKeegan, K. D., Harrison, T. M., Nutman, A. P., & Friend, C. R. L. 1996, Nature, 384, 55; —. 1997, Nature, 386, 738 (Erratum) Morel, P., Provost, J., & Berthomieu, G. 1997, A&A, 327, 349 Murphy, W. M., & Bass, D. S. 1998, BAAS, 30, DPS Abstract 11.03 Neuforge-Verheecke, C., Goriely, S., Guzik, J. A., Swenson, F. J., & Bradley, P. A. 2001, ApJ, 550, 493 North, G. R. 1975, J. Atmos. Sci., 32, 2033 Nutman, A. P., Allaart, J. H., Bridgwater, D., Dimroth, E., & Rosing, M. 1984, Precambrian Res., 25, 365 Oberbeck, V. R., Marshall, J. R., & Aggarwal, H. R. 1993, J. Geol., 101, 1 Ohmotu, H., & Felder, R. P. 1987, Nature, 328, 244 Parker, T. J., Gorsline, D. S., Saunders, R. S., Pieri, D. C., & Schneeberger, D. M. 1993, J. Geophys. Res., 95, 11061 Pinsonneault, M. H., Kawaler, S. D., Sofia, S., & Demarque, P. 1989, ApJ, 338, 424 Pollack, J. B. 1979, Icarus, 37, 479 Pollack, J. B., Kasting, J. F., Richardson, S. M., & Poliakoff, K. 1987, Icarus, 71, 203 Proffitt, C. R., & Michaud, G. 1991, ApJ, 380, 238 Ragas, K., & Pollack, J. B. 1980, Icarus, 41, 119 Retallack, G. J. 2001, Nature, 411, 287 Richard, O., Vauclair, S., Charbonnel, C., & Dziembowski, W. A. 1996, ApJ, 312, 1000 Rogers, F. J., & Iglesias, C. A. 1992, ApJS, 79, 507 Rogers, F. J., Swenson, F. J., & Iglesias, C. A. 1996, ApJ, 456, 902 Rye, R., Kuo, P. H., & Holland, H. D. 1995, Nature, 378, 603 Sackmann, I.-J., Boothroyd, A. I., & Kraemer, K. E. 1993, ApJ, 418, 457
  • 28. – 28 – Sagan, C. 1977, Nature, 269, 224 Sagan, C., & Chyba, C. 1997, Science, 276, 1217 Sagan, C., & Mullen, G. 1972, Science, 177, 52 Salpeter, E. E. 1955, ApJ, 121, 161 Schaefer, M. W. 1990, J. Geophys. Res., 95, 14291 Schatzman, E. 1977, A&A, 56, 211 Squyres, S. 1993, MSATT LPI Workshop on Early Mars: How Warm and How Wet?, LPI Tech. Report No. 93-03, Part 1 Swenson, F. J., & Faulkner, J. 1992, ApJ, 395, 654 Swenson, F. J., Faulkner, J., Iglesias, C. A., Rogers, F. J., & Alexander, D. R. 1994, ApJ, 422, L79 Thoul, A. A., Bahcall, J. N., & Loeb, A. 1994, ApJ, 421, 828 Turck-Chi`eze, S., Nghiem, P, Couvidat, S., & Turcotte, S. 2001, Sol. Phys., 200, 323 Ulrich, R. K., & Rhodes, E. R., Jr. 1983, ApJ, 265, 551 Walker, J. C. G., Hays, P. B., & Kasting, J. F. 1981, J. Geophys. Res., 86, 9776 Wang, W. C., & Stoner, P. H. 1980, J. Atmos. Sci., 37, 545 Whitmire, D. P., Doyle, L. R., Reynolds, R. T., & Matese, J. J. 1995, J. Geo. Res. Planets, 100, 5457 Willson, L. A., Bowen, G. H., & Struck-Marcel, C. 1987, Comm. Ap., 12, 17 Woese, C. 1987, Microbiol. Rev., 51, 221 Wood, B. E., & Linsky, J. L. 1998, ApJ, 492, 788 Wood, B. E., Linsky, J. L., M¨uller, H.-R., & Zank, G. P. 2001, ApJ, 547, L49 Wood, B. E., M¨uller, H.-R., Zank, G. P., & Linsky, J. L. 2002, ApJ, 574, 412 Yung, Y. L., Nair, H., & Gerstell, M. F. 1997, Icarus, 130, 222 This preprint was prepared with the AAS LATEX macros v5.0.