SlideShare a Scribd company logo
1 of 30
Download to read offline
Not enough growth in inventory means spring market sales slow
A total of 637 properties sold in the Victoria Real Estate Board region this April, 22.7 per cent fewer than the 824
properties sold in April 2022 but an 8 per cent increase from March 2023. Sales of condominiums were down 21.8 per
cent from April 2022 with 205 units sold. Sales of single family homes decreased 19.4 per cent from April 2022 with 325
sold.
“Sales numbers for this April are more moderate than the higher levels we’ve seen in recent years,” said Victoria Real
Estate Board Chair Graden Sol. “We are in a familiar market pattern, where the majority of sales for the year occur in
the spring. While we’ve seen an increase in sales over the previous month, we’re not expecting a return to record setting
activity. Our inventory levels continue to be very low and new properties are slow to come onto market. More inventory is
needed to balance the supply against spring demand. The good news is that prices have stabilized for now. If listings do
not pick up over this season, there is a risk that the price stabilization could turn and we could see prices increase.”
There were 2,043 active listings for sale on the Victoria Real Estate Board Multiple Listing Service® at the end of
April 2023, an increase of 3.7 per cent compared to the previous month of March and a 49.7 per cent
increase from the 1,365 active listings for sale at the end of April 2022.
“Though we are seeing multiple offers in our market, these situations are dependent on a number of factors including
price, competition, area, condition of home, etc.,” adds Sol. “This means sellers should seek clarity on what to expect
during their transaction as this spring market continues to evolve. Overall, consumer confidence in the market has
returned. Accurately priced homes are selling quickly and close to list price. Your REALTOR® can help you understand
the pulse of the market should you be contemplating buying or selling this spring.”
The Multiple Listing Service® Home Price Index benchmark value for a single family home in the Victoria Core in
April 2022 was $1,424,900. The benchmark value for the same home in April 2023 decreased by 11.3 per cent to
$1,264,200, which is up from March’s value of $1,236,200. The MLS® HPI benchmark value for a condominium in the
Victoria Core area in April 2022 was $630,200, while the benchmark value for the same condominium in April 2023
decreased by 10.3 per cent to $565,000, which is up from the March value of $560,300.
About the Victoria Real Estate Board – Founded in 1921, the Victoria Real Estate Board is a key player in the
development of standards and innovative programs to enhance the professionalism of REALTORS®. The Victoria Real
Estate Board represents 1,608 local Realtors. If you are thinking about buying or selling a home, connect with your local
Realtor for detailed information on the Victoria and area housing market.
Single family homes Condominiums Townhomes
April 2023 total sales
Compared to April 2022 sales
MLS® HPI
325
$1,264,200
205
-19.4% -21.8%
82
-19.6%
$565,000 $826,000
*Victoria Core
Sales by Property Type
Single Family Greater Victoria
Single Family Other Areas
Single Family Total All Areas
Condo Apartment
Row/Townhouse
Manufactured Home
Total Residential
Total Sales
Active Listings
Units Median$
Average$
LY%
LM% LY%
LM% LY%
LM% Units Median$
Average$ Units Median$
Average$
April 2023
317
205
82
9
621
325
637
8
2,043
266
197
67
15
560
281
590
15
1,970
393
262
102
15
782
403
824
10
1,365
$1,291,399
$620,606
$786,010
$352,222
$1,288,146
$1,159,250
$1,195,000
$540,000
$739,540
$320,000
$1,195,000
$1,060,000
$1,241,248
$628,230
$774,710
$338,667
$1,225,446
$945,226
$1,100,000
$569,500
$750,000
$317,500
$1,080,000
$950,000
$1,434,415
$666,733
$946,319
$355,569
$1,432,298
$1,349,101
$1,250,000
$601,000
$890,000
$302,729
$1,251,000
$1,320,000
19.2%
4.1%
22.4%
-40.0%
10.9%
15.7%
8.0%
-46.7%
3.7%
-19.3%
-21.8%
-19.6%
-40.0%
-20.6%
-19.4%
-22.7%
-20.0%
49.7%
4.0%
-1.2%
1.5%
4.0%
5.1%
22.6%
-10.0%
-6.9%
-16.9%
-0.9%
-10.1%
-14.1%
8.6%
-5.2%
-1.4%
0.8%
10.6%
11.6%
-4.4%
-10.1%
-16.9%
5.7%
-4.5%
-19.7%
March 2023 April 2022
Legend
Units: net number of listings sold
LM%: percentage change since Last Month
LY%: percentage change since This Month Last Year
Average$: average selling price
Median$: median selling price
Total Residential: includes sales of residential property types
Total Sales: includes sales of all property types
Active Listings: total listings of all types on the market at midnight on the last day of the month
This Month Last Month
Produced: 01-May-2023
April 2023
Previous Periods Comparison
This Month Last Year
Page 1 of 1
Victoria Real Estate Board Multiple Listing Service ®
April 2023
Statistics Package for Media
Victoria Real Estate Board April 2023 Statistics - page 2
Previous Periods Comparison of Unit Sales, Average Prices and Median Prices
Previous Periods Comparison of MLS® HPI Benchmark Prices and MLS® HPI Index Values
6DOHVWR$FWLYH/LVWLQJV5DWLR
The ratio of counts of total residential sales over total active residential listings for the last 25 months
$SULO
Produced: 01-May-2023


$SU
0D
-XQ
-XO
$XJ
6HS
2FW
1RY
'HF
-DQ
)HE
0DU
$SU
0D
-XQ
-XO
$XJ
6HS
2FW
1RY
'HF
-DQ
)HE
0DU
$SU
7KH6DOHVWR$FWLYH/LVWLQJV5DWLR
7KLV FKDUWWUDFNVWKHUDWLRRIWRWDOUHVLGHQWLDOVDOHVRYHUWRWDODFWLYHUHVLGHQWLDOOLVWLQJVDWPRQWKHQGIRU
HDFKRIWKHODVWPRQWKV
7KHDFWLYHOLVWLQJFRXQWDQGWKHVDOHVFRXQWFDQEHYLHZHGDVLQGLFDWRUVRIKRXVLQJVXSSODQG
GHPDQGUHVSHFWLYHO2EVHUYLQJWKHUDWLREHWZHHQWKHPFDQWKXVKHOSLQGLFDWHDEXHUV PDUNHW
ZKHUHWKHUHLVVXVWDLQHGGRZQZDUGSUHVVXUHRQSULFHVDQGDVHOOHUV PDUNHWZKHUHWKHUHLV
VXVWDLQHGXSZDUGSUHVVXUHRQSULFHV
%DVHGRQDUHJUHVVLRQDQDOVLVSHUIRUPHGEWKH(FRQRPLFV'HSDUWPHQWRIWKH%5HDO(VWDWH
$VVRFLDWLRQLQHDFKPDUNHWDUHDRIWKHSURYLQFHWKH6DOHVWR$FWLYH/LVWLQJV5DWLRIRU9LFWRULDFDQEH
LQWHUSUHWHGDVIROORZV
 EHORZWKHUHLVGRZQZDUGSUHVVXUHRQSULFHV EXHUV PDUNHW
 DERYHWKHUHLVXSZDUGSUHVVXUHRQSULFHV VHOOHUV PDUNHW
Sales to Active Listings Ratio
This chart tracks the ratio of total residential sales over total active residential listings at month-end for each of
the last 25 months.
Based on a regression analysis performed by the economics department at the BC Real Estate Association in
each market area of the province, the Sales to Active Listings Ratio for Victoria can be interpreted as follows:
- below 14%, there is downward pressure on prices (buyers' market)
- above 20%, there is upward pressure on prices (sellers' market)
- in the 14-20% range, there is little pressure on prices either way (balanced market)
Victoria Real Estate Board April 2023 Statistics - page 3
Total new MLS® listings and total MLS® sales for entire district
The Victoria Real Estate Board uses the MLS® Home Price Index (MLS® HPI) to report on market
trends. The MLS® HPI uses the concept of a benchmark home, a notional home with common
attributes of typical homes in a defined area.
Through the analysis of over fifteen years of Victoria Real Estate Board MLS® sales data, the MLS®
HPI defined benchmark homes for Victoria in each category (single family homes, townhouses,
condos) and for each neighbourhood. The benchmark starting point was 2005, where each type of
property and neighbourhood was assigned an index value of 100.
*The HPI reporting herein is based on the SOLD date.
Victoria Real Estate Board April 2023 Statistics - page 4
MLS® HPI benchmark and value - Single Family Homes
MLS® HPI benchmark and value - Condominium / Apartments
Victoria Real Estate Board April 2023 Statistics - page 5
Note: Areas with insufficient sales are not included in the HPI.
Source: Victoria Real Estate Board
April 2023 1 Month Ago 3 Months Ago 6 Months Ago 12 Months Ago 3 Years Ago 5 Years Ago January 2005
Victoria REB – SF-All
Victoria – SF-All
Victoria West – SF-All
Oak Bay – SF-All
Esquimalt – SF-All
View Royal – SF-All
Saanich East – SF-All
Saanich West – SF-All
Sooke – SF-All
Langford – SF-All
Metchosin – SF-All
Colwood – SF-All
Highlands – SF-All
North Saanich – SF-All
Sidney – SF-All
Central Saanich – SF-All
ML Malahat  Area –
SF-All
GI Gulf Islands – SF-All
$998,600
$991,800
$989,100
$986,700
$984,700
$983,700
$975,700
$975,200
$974,900
$974,100
$969,800
$966,900
$965,000
$962,400
$962,300
$952,900
$949,800
$946,300
$945,600
$934,800
$925,900
$925,400
$924,500
$924,400
$907,300
$905,100
$882,900
$875,600
$868,600 $858,500
$855,700
$853,400 $851,700
$850,800
$847,100
$839,900 $836,200
$819,200
$816,600
$812,500
$800,600
$775,200
$773,000
$760,400 $752,700
$748,000
$745,400
$744,000
$737,900
$734,400
$730,700
$719,100
$709,300
$705,400
$700,600
$693,500
$689,800
$680,900
$661,900
$614,100
$600,100
$579,000
$576,800
$554,400
$538,400
$475,900
$473,800
$469,000
$436,800
$417,900
$384,500
$370,800
$355,800
$336,900
$330,600
$327,600
$319,700
$303,500
$303,200
$302,700
$294,100
$288,400
$270,400
$1,935,500 $1,925,500
$1,764,800 $1,757,000
$1,714,600
$1,537,300
$1,526,000
$1,442,300
$1,432,300
$1,423,600
$1,419,000
$1,401,800
$1,379,400
$1,375,400
$1,371,400
$1,366,700
$1,356,700
$1,354,700
$1,347,900
$1,336,500
$1,326,600 $1,322,500
$1,311,200
$1,305,000
$1,290,300
$1,280,000
$1,275,400
$1,275,400 $1,262,300
$1,250,000
$1,243,100
$1,214,600
$1,214,100
$1,206,200
$1,201,800
$1,193,600
$1,170,400
$1,157,800
$1,154,600
$1,127,500
$1,123,800 $1,117,400
$1,109,400
$1,108,100
$1,098,100
$1,085,300
$1,084,700
$1,077,300
$1,068,800
$1,066,700
$1,059,100
$1,057,900
$1,055,900
$1,049,600 $1,044,600
$1,042,900
$1,039,900
$1,007,000
$1,003,600
$1,003,500
$1,002,700
Benchmark Price by Timeframe and Property Type
Value or percent change
Value
Percent change
HPI or Benchmark Price
HPI
Benchmark Price
1. Area Group
VREB District Summary
3. Area/Property Type Selection
All
2. Property Type
– Single Family-All (SF-All)
Note: Areas with insufficient sales are not included in the HPI.
Source: Victoria Real Estate Board
April 2023 1 Month Ago 3 Months Ago 6 Months Ago 12 Months Ago 3 Years Ago 5 Years Ago January 2005
Victoria REB – SF-All
Victoria – SF-All
Victoria West – SF-All
Oak Bay – SF-All
Esquimalt – SF-All
View Royal – SF-All
Saanich East – SF-All
Saanich West – SF-All
Sooke – SF-All
Langford – SF-All
Metchosin – SF-All
Colwood – SF-All
Highlands – SF-All
North Saanich – SF-All
Sidney – SF-All
Central Saanich – SF-All
ML Malahat  Area –
SF-All
GI Gulf Islands – SF-All
370.6
368.8
366.5
356.7
355.4
355.3
352.7
350.2
349.4
346.3
345.1
344.0
342.4
335.2
333.7
332.1
331.5
327.2
325.4
325.1
324.5
324.4
324.2
323.8
323.3
323.0
323.0
322.5
321.9
320.9
320.6
320.4
320.4
318.9
318.3
318.3
317.4
315.9
315.6 315.0
314.8
314.0
313.7
313.3
310.6
308.7
308.6
308.6
308.5
306.3
305.4
305.2
305.0
304.9
304.4
303.7
303.6 303.3
303.1
302.8
302.1
301.3
300.2
299.1
299.0
298.9
298.8
298.8
298.2
297.7 296.8
296.7
295.0
294.4
294.1
294.1 292.8
292.4
292.4
292.3
291.2 289.9
285.7
280.8
280.3
275.5
269.1
250.5
249.7
248.0
245.9
245.6
241.4
240.4
238.2
237.2
236.7
234.5
233.1
233.0
229.2
228.7
228.4
223.2
222.0
220.9
220.8
217.3
216.5
215.9
215.8
215.0
214.1
212.9
208.0
207.8
207.0
206.2
199.1
198.9
198.8
196.5
194.5
192.2
190.0 156.1 100.0
100.0
100.0
100.0
100.0
100.0
100.0
100.0
100.0
100.0
100.0
100.0
100.0
100.0
100.0
100.0
100.0
100.0
HPI by Timeframe and Property Type
Value or percent change
Value
Percent change
HPI or Benchmark Price
HPI
Benchmark Price
1. Area Group
VREB District Summary
3. Area/Property Type Selection
All
2. Property Type
– Single Family-All (SF-All)
Note: Areas with insufficient sales are not included in the HPI.
Source: Victoria Real Estate Board
April 2023 1 Month Ago 3 Months Ago 6 Months Ago 12 Months Ago 3 Years Ago 5 Years Ago January 2005
Victoria REB – Con
Victoria – Con
Victoria West – Con
Oak Bay – Con
Esquimalt – Con
View Royal – Con
Saanich East – Con
Saanich West – Con
Sooke – Con
Langford – Con
Colwood – Con
North Saanich – Con
Sidney – Con
Central Saanich – Con
$871,400
$825,500
$817,300
$799,500
$798,400
$769,900
$765,700
$758,400 $757,000
$750,100 $747,600
$747,000
$716,800
$710,600 $684,600
$678,000
$670,000
$660,000
$657,900
$643,100 $629,800
$629,400
$622,700
$620,100
$618,900
$617,700
$612,100
$611,300 $607,100
$601,100
$597,800
$596,700
$596,700
$592,600
$588,500
$585,000
$580,800
$572,000
$571,000
$569,900
$569,400
$568,200
$566,700
$566,500
$565,500
$564,500
$562,700
$558,100
$556,700
$556,100 $552,100
$550,000
$549,100
$549,100
$548,400
$546,100
$538,500
$538,000
$535,900
$535,300
$531,600
$530,500
$523,600
$522,000
$517,600
$517,100
$514,000
$513,800
$513,100
$507,400
$505,200
$488,200
$476,900
$472,800
$470,700
$464,500
$462,200
$459,100
$456,600
$453,300
$448,700
$448,600
$446,300
$440,800
$432,300
$429,200
$412,600
$404,800
$401,600
$401,200
$396,000
$386,100
$376,700
$376,600
$370,600
$340,000
$300,500
$285,500
$275,600
$234,200
$231,100
$199,200
$195,700
$195,500
$169,900
$167,000
$159,100
$152,000
$150,200
$143,700
$131,400
$115,000
Benchmark Price by Timeframe and Property Type
Value or percent change
Value
Percent change
HPI or Benchmark Price
HPI
Benchmark Price
1. Area Group
VREB District Summary
3. Area/Property Type Selection
All
2. Property Type
– Condo Apartment (Con)
Note: Areas with insufficient sales are not included in the HPI.
Source: Victoria Real Estate Board
April 2023 1 Month Ago 3 Months Ago 6 Months Ago 12 Months Ago 3 Years Ago 5 Years Ago January 2005
Victoria REB – Con
Victoria – Con
Victoria West – Con
Oak Bay – Con
Esquimalt – Con
View Royal – Con
Saanich East – Con
Saanich West – Con
Sooke – Con
Langford – Con
Colwood – Con
North Saanich – Con
Sidney – Con
Central Saanich – Con
424.5
423.7
417.9 415.6
414.7 409.3
404.2
403.9
403.7
399.2
391.0
388.2
382.7
377.1
375.7
375.0
372.7
365.6
364.4
364.3
359.9
358.2
357.7
357.2
357.1
356.2
354.3
353.9
351.2
349.5
349.0
347.0
344.6
343.4
342.4
340.9
340.2
340.2
337.6
336.9
336.4
336.2
335.4
333.1
332.3
328.6
328.5
324.6 323.5
321.9
321.8
320.9
320.5
318.5
316.9
312.7 310.5
306.1
303.4
301.4
300.1
298.7
295.4
293.4
292.3
287.1
285.8 283.9
282.0
280.0
279.2
271.7
268.2
265.6 265.1
264.9
264.2
264.0
264.0
261.6
261.3
253.0
250.7
247.8
242.8
242.7
242.4
241.8
239.7
236.2
233.6
231.6
226.4
225.3
224.0
216.7
204.9 192.1
100.0
100.0
100.0
100.0
100.0
100.0
100.0
100.0
100.0
100.0
100.0
100.0
100.0
100.0
HPI by Timeframe and Property Type
Value or percent change
Value
Percent change
HPI or Benchmark Price
HPI
Benchmark Price
1. Area Group
VREB District Summary
3. Area/Property Type Selection
All
2. Property Type
– Condo Apartment (Con)
Note: Areas with insufficient sales are not included in the HPI.
Source: Victoria Real Estate Board
April 2023 1 Month Ago 3 Months Ago 6 Months Ago 12 Months Ago 3 Years Ago 5 Years Ago January 2005
Victoria REB – Twn
Victoria – Twn
Victoria West – Twn
Esquimalt – Twn
View Royal – Twn
Saanich East – Twn
Saanich West – Twn
Sooke – Twn
Langford – Twn
Colwood – Twn
Sidney – Twn
Central Saanich – Twn
ML Malahat  Area – Twn
GI Gulf Islands – Twn
$921,600
$920,300 $918,700
$910,300
$899,000
$890,200
$885,200
$882,900 $881,200
$874,400
$858,300
$855,300
$855,300
$847,200
$841,600
$834,100
$821,400
$816,000
$815,200
$808,800
$802,500
$802,500
$801,400
$800,300
$794,500
$790,500
$790,200
$785,100
$781,500
$781,200
$778,200
$775,000
$773,500
$773,200
$766,200
$765,400
$763,800
$762,500
$757,300
$753,200
$749,700 $749,300
$749,300
$748,300
$745,800
$740,600
$735,700 $735,200
$733,700
$732,100
$721,400
$719,700
$715,100
$715,000
$712,100
$711,800
$709,200
$703,100
$700,200
$697,400
$694,700
$691,600
$691,600
$689,600
$687,500
$681,000
$673,600
$668,700
$665,800
$646,400
$646,400
$645,300
$642,600
$632,800
$616,200
$575,700
$567,000
$565,600
$563,700
$558,200
$557,500
$545,900
$539,100
$532,500
$524,000
$523,600
$522,700
$518,500
$483,600
$478,600
$475,600
$471,900
$471,500
$466,700
$455,200
$434,300
$434,200
$421,900
$321,500
$295,200
$288,500
$258,200
$254,800
$245,700
$244,300
$240,700
$232,300
$221,100
$219,500
$213,400
$212,000
$201,100
Benchmark Price by Timeframe and Property Type
Value or percent change
Value
Percent change
HPI or Benchmark Price
HPI
Benchmark Price
1. Area Group
VREB District Summary
3. Area/Property Type Selection
All
2. Property Type
– Townhouse (Twn)
Note: Areas with insufficient sales are not included in the HPI.
Source: Victoria Real Estate Board
April 2023 1 Month Ago 3 Months Ago 6 Months Ago 12 Months Ago 3 Years Ago 5 Years Ago January 2005
Victoria REB – Twn
Victoria – Twn
Victoria West – Twn
Esquimalt – Twn
View Royal – Twn
Saanich East – Twn
Saanich West – Twn
Sooke – Twn
Langford – Twn
Colwood – Twn
Sidney – Twn
Central Saanich – Twn
ML Malahat  Area – Twn
GI Gulf Islands – Twn
414.7 405.6
403.3
386.0
382.0
376.6
374.2
372.8 372.6
362.3
357.3
354.0
349.8
349.3
348.1
345.5
344.5
343.1
335.1
334.5 330.3
329.2
327.6
326.2
326.2
325.3
323.6
323.4
322.1
320.3
318.1
317.9
316.7 316.5
315.4
312.6
311.8 311.2
310.8
310.8
309.8
305.3
304.2
304.1
302.4
300.7
300.4
296.2
294.5
294.1
293.2
292.1
291.7
290.8
290.0
289.8
287.3
286.7
285.6
282.6
279.6
275.4
274.6 274.1
273.9
269.7
268.6
266.0
262.9
262.3
254.3
250.1
245.5
234.7
231.5
230.8
228.1
225.5
223.5
223.2
220.9
219.4
219.1
218.6
218.3
216.0
214.7
211.1
206.2
205.1
204.7
199.9
198.8
193.2
191.7
190.8
181.5
180.4
100.0
100.0
100.0
100.0
100.0
100.0
100.0
100.0
100.0
100.0
100.0
100.0
100.0
100.0
HPI by Timeframe and Property Type
Value or percent change
Value
Percent change
HPI or Benchmark Price
HPI
Benchmark Price
1. Area Group
VREB District Summary
3. Area/Property Type Selection
All
2. Property Type
– Townhouse (Twn)
Note: Areas with insufficient sales are not included in the HPI.
Source: Victoria Real Estate Board
Victoria REB – SF-All Core – SF-All Westshore – SF-All Peninsula – SF-All
Select Date Range:
All values
Jan
2003
Jan
2005
Jan
2007
Jan
2009
Jan
2011
Jan
2013
Jan
2015
Jan
2017
Jan
2019
Jan
2021
Jan
2023
Benchmark
Price
($)
200,000
400,000
600,000
800,000
1,000,000
1,200,000
1,400,000
Benchmark Price Performance over Time
1. Area Group
VREB Area Summary
3. Area/Property Type Selection
Multiple values
2. Property Type
– Single Family-All (SF-All)
HPI or Benchmark Price
HPI
Benchmark Price
Adding labels
Hold Ctrl (Cmd) and select points on the chart to show multiple date/value labels
Note: Areas with insufficient sales are not included in the HPI.
Source: Victoria Real Estate Board
Victoria REB – Con Core – Con Westshore – Con Peninsula – Con
Select Date Range:
All values
Jan
2003
Jan
2005
Jan
2007
Jan
2009
Jan
2011
Jan
2013
Jan
2015
Jan
2017
Jan
2019
Jan
2021
Jan
2023
Benchmark
Price
($)
100,000
200,000
300,000
400,000
500,000
600,000
Benchmark Price Performance over Time
1. Area Group
VREB Area Summary
3. Area/Property Type Selection
All
2. Property Type
– Condo Apartment (Con)
HPI or Benchmark Price
HPI
Benchmark Price
Adding labels
Hold Ctrl (Cmd) and select points on the chart to show multiple date/value labels
Note: Areas with insufficient sales are not included in the HPI.
Source: Victoria Real Estate Board
Victoria REB – Twn Core – Twn Westshore – Twn Peninsula – Twn
Select Date Range:
All values
Jan
2003
Jan
2005
Jan
2007
Jan
2009
Jan
2011
Jan
2013
Jan
2015
Jan
2017
Jan
2019
Jan
2021
Jan
2023
Benchmark
Price
($)
200,000
300,000
400,000
500,000
600,000
700,000
800,000
900,000
Benchmark Price Performance over Time
1. Area Group
VREB Area Summary
3. Area/Property Type Selection
Multiple values
2. Property Type
– Townhouse (Twn)
HPI or Benchmark Price
HPI
Benchmark Price
Adding labels
Hold Ctrl (Cmd) and select points on the chart to show multiple date/value labels
Note: Areas with insufficient sales are not included in the HPI.
Source: Victoria Real Estate Board
Victoria REB – SF-All Victoria REB – Twn Victoria REB – Con
Select Date Range:
All values
Jan
2003
Jan
2005
Jan
2007
Jan
2009
Jan
2011
Jan
2013
Jan
2015
Jan
2017
Jan
2019
Jan
2021
Jan
2023
Benchmark
Price
($)
200,000
400,000
600,000
800,000
1,000,000
1,200,000
Benchmark Price Performance over Time
1. Area Group
VREB Area Summary
3. Area/Property Type Selection
Multiple values
2. Property Type
Multiple values
HPI or Benchmark Price
HPI
Benchmark Price
Adding labels
Hold Ctrl (Cmd) and select points on the chart to show multiple date/value labels
Monthly Sales Summary (Mark I)
Residential Waterfront Properties Integrated Into Their Own Districts
Units Total Volume
April 2023
District
Produced: 01-May-2023
Residential
Single Family Detached
l
Greater Victoria
Victoria / Victoria West 38 $49,747,049
Oak Bay 26 $50,494,600
Esquimalt 9 $10,224,261
View Royal 10 $11,690,500
Saanich East 58 $80,172,650
Saanich West 29 $35,353,217
Central Saanich 8 $13,805,301
North Saanich 10 $15,131,900
Sidney 9 $9,767,400
Highlands 2 $2,615,000
Colwood 19 $24,150,900
Langford 41 $46,995,594
Metchosin 3 $3,135,000
Sooke 25 $22,565,150
Gulf Islands 30 $33,524,834
Total Greater Victoria 317 $409,373,356
Other Areas
Malahat  Area 8 $9,274,000
Total Other Areas 8 $9,274,000
Total Single Family Detached 325 $418,647,356
Condo Apartment
l
Greater Victoria
Victoria / Victoria West 77 $47,944,159
Oak Bay 6 $8,458,000
Esquimalt 12 $7,420,700
View Royal 8 $4,453,299
Saanich East 31 $19,081,900
Saanich West 9 $3,855,000
Central Saanich 4 $2,553,000
Sidney 10 $6,408,000
Colwood 5 $2,596,900
Langford 39 $22,365,818
Sooke 2 $740,000
Gulf Islands 1 $485,000
Total Greater Victoria 204 $126,361,776
Other Areas
UpIsland / Mainland 1 $862,500
Total Other Areas 1 $862,500
Total Condo Apartment 205 $127,224,276
Page 1 of 3
Victoria Real Estate Board Multiple Listing Service ®
Monthly Sales Summary (Mark I)
Residential Waterfront Properties Integrated Into Their Own Districts
Units Total Volume
April 2023
District
Produced: 01-May-2023
Row/Townhouse
l
Greater Victoria
Victoria / Victoria West 20 $15,952,600
Esquimalt 4 $2,850,500
View Royal 3 $2,268,500
Saanich East 8 $7,631,000
Saanich West 5 $4,548,000
Central Saanich 2 $1,589,000
North Saanich 1 $950,000
Sidney 10 $7,393,500
Colwood 4 $2,806,000
Langford 24 $17,963,693
Sooke 1 $500,000
Total Greater Victoria 82 $64,452,793
Total Row/Townhouse 82 $64,452,793
Manufactured Home
l
Greater Victoria
View Royal 3 $840,000
Central Saanich 3 $1,085,000
Sidney 2 $995,000
Gulf Islands 1 $250,000
Total Greater Victoria 9 $3,170,000
Total Manufactured Home 9 $3,170,000
Total Residential 621 $613,494,425
Page 2 of 3
Victoria Real Estate Board Multiple Listing Service ®
Monthly Sales Summary (Mark I)
Residential Waterfront Properties Integrated Into Their Own Districts
Units Total Volume
April 2023
District
Produced: 01-May-2023
$626,130,955
637
Grand Totals
Other Property
Lots  Acreage
l
Greater Victoria
Victoria / Victoria West 1 $828,920
Saanich East 1 $935,000
Sooke 3 $1,700,000
Gulf Islands 1 $595,000
Total Greater Victoria 6 $4,058,920
Other Areas
Malahat  Area 1 $550,000
Total Other Areas 1 $550,000
Total Lots  Acreage 7 $4,608,920
9 $8,027,610
Other Commercial Properties
l
Page 3 of 3
Victoria Real Estate Board Multiple Listing Service ®
Monthly Sales Summary (Mark II)
Waterfront Properties Segregated Into a 'Waterfront' District
Units Total Volume
April 2023
District
Produced: 01-May-2023
Residential
Single Family Detached
l
Greater Victoria
Victoria 36 $47,821,549
Victoria West 2 $1,925,500
Oak Bay 26 $50,494,600
Esquimalt 9 $10,224,261
View Royal 10 $11,690,500
Saanich East 58 $80,172,650
Saanich West 28 $33,783,217
Central Saanich 8 $13,805,301
North Saanich 10 $15,131,900
Sidney 9 $9,767,400
Highlands 2 $2,615,000
Colwood 19 $24,150,900
Langford 41 $46,995,594
Metchosin 3 $3,135,000
Sooke 22 $18,720,250
Gulf Islands 25 $28,689,834
Waterfront (all districts) 9 $10,249,900
Total Greater Victoria 317 $409,373,356
Other Areas
Malahat  Area 7 $7,749,000
Waterfront (all districts) 1 $1,525,000
Total Other Areas 8 $9,274,000
Total Single Family Detached 325 $418,647,356
Condo Apartment
l
Greater Victoria
Victoria 62 $36,166,759
Victoria West 9 $5,967,900
Oak Bay 5 $7,679,000
Esquimalt 11 $5,420,700
View Royal 8 $4,453,299
Saanich East 30 $17,921,900
Saanich West 8 $3,356,000
Central Saanich 2 $1,085,000
Sidney 8 $5,253,000
Colwood 5 $2,596,900
Langford 39 $22,365,818
Gulf Islands 1 $485,000
Waterfront (all districts) 16 $13,610,500
Total Greater Victoria 204 $126,361,776
Other Areas
UpIsland / Mainland 1 $862,500
Total Other Areas 1 $862,500
Total Condo Apartment 205 $127,224,276
Page 1 of 3
Victoria Real Estate Board Multiple Listing Service ®
Monthly Sales Summary (Mark II)
Waterfront Properties Segregated Into a 'Waterfront' District
Units Total Volume
April 2023
District
Produced: 01-May-2023
Row/Townhouse
l
Greater Victoria
Victoria 16 $12,797,600
Victoria West 2 $1,680,000
Esquimalt 4 $2,850,500
View Royal 2 $1,508,500
Saanich East 8 $7,631,000
Saanich West 5 $4,548,000
Central Saanich 2 $1,589,000
North Saanich 1 $950,000
Sidney 10 $7,393,500
Colwood 4 $2,806,000
Langford 24 $17,963,693
Sooke 1 $500,000
Waterfront (all districts) 3 $2,235,000
Total Greater Victoria 82 $64,452,793
Total Row/Townhouse 82 $64,452,793
Manufactured Home
l
Greater Victoria
View Royal 3 $840,000
Central Saanich 3 $1,085,000
Sidney 2 $995,000
Gulf Islands 1 $250,000
Total Greater Victoria 9 $3,170,000
Total Manufactured Home 9 $3,170,000
Total Residential 621 $613,494,425
Page 2 of 3
Victoria Real Estate Board Multiple Listing Service ®
Monthly Sales Summary (Mark II)
Waterfront Properties Segregated Into a 'Waterfront' District
Units Total Volume
April 2023
District
Produced: 01-May-2023
$626,130,955
637
Grand Totals
Other Property
Lots  Acreage
l
Greater Victoria
Victoria / Victoria West 1 $828,920
Saanich East 1 $935,000
Sooke 3 $1,700,000
Gulf Islands 1 $595,000
Total Greater Victoria 6 $4,058,920
Other Areas
Malahat  Area 1 $550,000
Total Other Areas 1 $550,000
Total Lots  Acreage 7 $4,608,920
9 $8,027,610
Other Commercial Properties
l
Page 3 of 3
Victoria Real Estate Board Multiple Listing Service ®
Sales to Active Listings Ratio
The ratio of counts of total residential sales over total active residential listings for the last 25 months
April 2023
Produced: 01-May-2023
10%
20%
30%
40%
50%
60%
70%
80%
90%
100%
110%
120%
Apr
2021
May
2021
Jun
2021
Jul
2021
Aug
2021
Sep
2021
Oct
2021
Nov
2021
Dec
2021
Jan
2022
Feb
2022
Mar
2022
Apr
2022
May
2022
Jun
2022
Jul
2022
Aug
2022
Sep
2022
Oct
2022
Nov
2022
Dec
2022
Jan
2023
Feb
2023
Mar
2023
Apr
2023
The Sales to Active Listings Ratio
This chart tracks the ratio of total residential sales over total active residential listings at month-end for
each of the last 25 months.
The active listing count and the sales count can be viewed as indicators of housing supply and
demand respectively. Observing the ratio between them can thus help indicate a buyers' market,
where there is sustained downward pressure on prices, and a sellers' market, where there is
sustained upward pressure on prices.
Based on a regression analysis performed by the Economics Department of the BC Real Estate
Association in each market area of the province, the Sales to Active Listings Ratio for Victoria can be
interpreted as follows:
- below 14%, there is downward pressure on prices (buyers' market)
- above 20%, there is upward pressure on prices (sellers' market)
- in the 14-20% range, there is little pressure on prices either way (balanced market)
Victoria Real Estate Board Multiple Listing Service ® Page 1 of 1
Monthly Comparative Activity By Property Type
Includes All MLS® Property Types
April 2023
Current Month
This Year % Change
Last Year
Year To Date
This Year % Change
Last Year
Produced: 01-May-2023
Single Family - Residential
Units Listed 368
Units Sold 256
Sell/List Ratio 70
Sales Dollars $329,988,522
Average Price / Unit $1,289,018
Price Ratio 99
Days To Sell 33
Active Listings at Month End 566
%
%
556
325
58
$445,500,476
$1,370,771
103
14
417
%
%
-34
-21
-26
-6
146
36
%
%
%
%
%
%
1308
746
57
$917,446,413
$1,229,821
98
38
%
%
1575
1052
67
$1,453,632,785
$1,381,780
106
13
%
%
-17
-29
-37
-11
200
%
%
%
%
%
Single Family - Residential Waterfront
Units Listed 49
Units Sold 6
Sell/List Ratio 12
Sales Dollars $10,507,500
Average Price / Unit $1,751,250
Price Ratio 96
Days To Sell 90
Active Listings at Month End 124
%
%
46
23
50
$60,544,525
$2,632,371
99
20
76
%
%
7
-74
-83
-33
348
63
%
%
%
%
%
%
133
33
25
$76,369,500
$2,314,227
93
70
%
%
124
62
50
$162,827,977
$2,626,258
99
39
%
%
7
-47
-53
-12
82
%
%
%
%
%
Single Family - Residential Acreage
Units Listed 58
Units Sold 33
Sell/List Ratio 57
Sales Dollars $49,474,734
Average Price / Unit $1,499,234
Price Ratio 95
Days To Sell 62
Active Listings at Month End 117
%
%
50
25
50
$41,769,899
$1,670,796
100
30
64
%
%
16
32
18
-10
109
83
%
%
%
%
%
%
191
85
45
$121,325,634
$1,427,360
95
65
%
%
146
82
56
$133,374,499
$1,626,518
100
30
%
%
31
4
-9
-12
115
%
%
%
%
%
Condo Apartment
Units Listed 298
Units Sold 205
Sell/List Ratio 69
Sales Dollars $127,224,276
Average Price / Unit $620,606
Price Ratio 98
Days To Sell 32
Active Listings at Month End 480
%
%
386
262
68
$174,683,990
$666,733
103
13
285
%
%
-23
-22
-27
-7
159
68
%
%
%
%
%
%
1151
664
58
$405,483,279
$610,668
98
35
%
%
1286
996
77
$672,053,907
$674,753
104
15
%
%
-10
-33
-40
-9
124
%
%
%
%
%
Page 1 of 8
Victoria Real Estate Board Multiple Listing Service ®
Monthly Comparative Activity By Property Type
Includes All MLS® Property Types
April 2023
Current Month
This Year % Change
Last Year
Year To Date
This Year % Change
Last Year
Produced: 01-May-2023
Row/Townhouse
Units Listed 103
Units Sold 82
Sell/List Ratio 80
Sales Dollars $64,452,793
Average Price / Unit $786,010
Price Ratio 99
Days To Sell 38
Active Listings at Month End 154
%
%
132
101
77
$95,419,582
$944,748
106
10
83
%
%
-22
-19
-32
-17
289
86
%
%
%
%
%
%
390
231
59
$176,329,934
$763,333
99
38
%
%
421
328
78
$297,070,610
$905,703
106
16
%
%
-7
-30
-41
-16
141
%
%
%
%
%
Half Duplex (Up and Down)
Units Listed 1
Units Sold 1
Sell/List Ratio 100
Sales Dollars $1,485,000
Average Price / Unit $1,485,000
Price Ratio 99
Days To Sell 13
Active Listings at Month End 2
%
%
3
2
67
$2,677,000
$1,338,500
96
25
3
%
%
-67
-50
-45
11
-47
-33
%
%
%
%
%
%
5
2
40
$2,100,000
$1,050,000
100
16
%
%
6
4
67
$5,301,000
$1,325,250
95
121
%
%
-17
-50
-60
-21
-87
%
%
%
%
%
Half Duplex (Side by Side)
Units Listed 30
Units Sold 17
Sell/List Ratio 57
Sales Dollars $14,081,800
Average Price / Unit $828,341
Price Ratio 99
Days To Sell 23
Active Listings at Month End 42
%
%
38
17
45
$15,702,400
$923,671
105
9
34
%
%
-21
0
-10
-10
142
24
%
%
%
%
%
%
89
57
64
$49,712,338
$872,146
100
29
%
%
110
68
62
$62,343,299
$916,813
107
12
%
%
-19
-16
-20
-5
134
%
%
%
%
%
Half Duplex (Front and Back)
Units Listed 4
Units Sold 2
Sell/List Ratio 50
Sales Dollars $1,766,400
Average Price / Unit $883,200
Price Ratio 98
Days To Sell 65
Active Listings at Month End 4
%
%
7
4
57
$3,783,800
$945,950
97
29
4
%
%
-43
-50
-53
-7
121
0
%
%
%
%
%
%
11
7
64
$6,470,500
$924,357
99
34
%
%
18
7
39
$6,319,800
$902,829
103
20
%
%
-39
0
2
2
67
%
%
%
%
%
Page 2 of 8
Victoria Real Estate Board Multiple Listing Service ®
Monthly Comparative Activity By Property Type
Includes All MLS® Property Types
April 2023
Current Month
This Year % Change
Last Year
Year To Date
This Year % Change
Last Year
Produced: 01-May-2023
Recreational
Units Listed 3
Units Sold 4
Sell/List Ratio 133
Sales Dollars $1,267,400
Average Price / Unit $316,850
Price Ratio 93
Days To Sell 55
Active Listings at Month End 9
%
%
5
2
40
$648,000
$324,000
100
22
11
%
%
-40
100
96
-2
153
-18
%
%
%
%
%
%
11
6
55
$1,624,900
$270,817
93
52
%
%
15
9
60
$2,691,250
$299,028
96
55
%
%
-27
-33
-40
-9
-6
%
%
%
%
%
Manufactured Home
Units Listed 23
Units Sold 9
Sell/List Ratio 39
Sales Dollars $3,170,000
Average Price / Unit $352,222
Price Ratio 97
Days To Sell 33
Active Listings at Month End 41
%
%
30
15
50
$5,333,528
$355,569
101
27
43
%
%
-23
-40
-41
-1
24
-5
%
%
%
%
%
%
70
39
56
$13,439,500
$344,603
96
57
%
%
94
59
63
$20,213,629
$342,604
100
31
%
%
-26
-34
-34
1
83
%
%
%
%
%
Residential Lots
Units Listed 20
Units Sold 3
Sell/List Ratio 15
Sales Dollars $2,188,920
Average Price / Unit $729,640
Price Ratio 97
Days To Sell 36
Active Listings at Month End 95
%
%
35
12
34
$7,201,700
$600,142
99
14
53
%
%
-43
-75
-70
22
158
79
%
%
%
%
%
%
99
14
14
$9,315,920
$665,423
96
88
%
%
106
56
53
$32,097,746
$573,174
99
26
%
%
-7
-75
-71
16
246
%
%
%
%
%
Residential Lots - Waterfront
Units Listed 2
Units Sold 0
Sell/List Ratio
Sales Dollars $0
Average Price / Unit
Price Ratio
Days To Sell
Active Listings at Month End 13
%
%
6
2
33
$2,032,500
$1,016,250
95
57
11
%
%
-67
-100
-100
18
%
%
%
%
%
%
8
1
13
$1,250,000
$1,250,000
93
21
%
%
16
4
25
$3,665,500
$916,375
101
27
%
%
-50
-75
-66
36
-22
%
%
%
%
%
Page 3 of 8
Victoria Real Estate Board Multiple Listing Service ®
Monthly Comparative Activity By Property Type
Includes All MLS® Property Types
April 2023
Current Month
This Year % Change
Last Year
Year To Date
This Year % Change
Last Year
Produced: 01-May-2023
Residential Acreage
Units Listed 10
Units Sold 3
Sell/List Ratio 30
Sales Dollars $1,670,000
Average Price / Unit $556,667
Price Ratio 97
Days To Sell 29
Active Listings at Month End 51
%
%
12
10
83
$10,816,400
$1,081,640
87
70
34
%
%
-17
-70
-85
-49
-58
50
%
%
%
%
%
%
36
9
25
$6,456,000
$717,333
98
89
%
%
44
26
59
$23,055,800
$886,762
94
87
%
%
-18
-65
-72
-19
2
%
%
%
%
%
Residential Acreage - Waterfront
Units Listed 5
Units Sold 1
Sell/List Ratio 20
Sales Dollars $750,000
Average Price / Unit $750,000
Price Ratio 77
Days To Sell 440
Active Listings at Month End 27
%
%
3
0
$0
5
%
%
67
440
%
%
%
%
%
%
14
2
14
$3,500,000
$1,750,000
88
249
%
%
7
3
43
$2,014,000
$671,333
96
134
%
%
100
-33
74
161
86
%
%
%
%
%
Revenue - Duplex/Triplex
Units Listed 8
Units Sold 6
Sell/List Ratio 75
Sales Dollars $10,076,000
Average Price / Unit $1,679,333
Price Ratio 98
Days To Sell 31
Active Listings at Month End 9
%
%
9
6
67
$7,695,000
$1,282,500
102
11
14
%
%
-11
0
31
31
173
-36
%
%
%
%
%
%
21
10
48
$15,972,000
$1,597,200
96
40
%
%
35
20
57
$27,846,000
$1,392,300
105
12
%
%
-40
-50
-43
15
242
%
%
%
%
%
Revenue - Multi Units
Units Listed 3
Units Sold 2
Sell/List Ratio 67
Sales Dollars $3,847,500
Average Price / Unit $1,923,750
Price Ratio 96
Days To Sell 51
Active Listings at Month End 15
%
%
9
3
33
$4,350,000
$1,450,000
100
24
19
%
%
-67
-33
-12
33
113
-21
%
%
%
%
%
%
16
7
44
$10,077,500
$1,439,643
95
86
%
%
36
10
28
$14,372,000
$1,437,200
102
50
%
%
-56
-30
-30
0
72
%
%
%
%
%
Page 4 of 8
Victoria Real Estate Board Multiple Listing Service ®
Monthly Comparative Activity By Property Type
Includes All MLS® Property Types
April 2023
Current Month
This Year % Change
Last Year
Year To Date
This Year % Change
Last Year
Produced: 01-May-2023
Revenue - Apartment Block
Units Listed 0
Units Sold 0
Sell/List Ratio
Sales Dollars $0
Average Price / Unit
Price Ratio
Days To Sell
Active Listings at Month End 0
%
%
0
0
$0
0
%
%
%
%
%
%
%
%
0
0
$0
%
%
0
0
$0
%
%
%
%
%
%
%
Revenue - Commercial
Units Listed 13
Units Sold 1
Sell/List Ratio 8
Sales Dollars $4,125,000
Average Price / Unit $4,125,000
Price Ratio 92
Days To Sell 72
Active Listings at Month End 47
%
%
7
5
71
$9,513,900
$1,902,780
95
73
23
%
%
86
-80
-57
117
-2
104
%
%
%
%
%
%
47
10
21
$9,354,180
$935,418
93
62
%
%
29
18
62
$30,201,112
$1,677,840
97
58
%
%
62
-44
-69
-44
7
%
%
%
%
%
Revenue - Industrial
Units Listed 1
Units Sold 0
Sell/List Ratio
Sales Dollars $0
Average Price / Unit
Price Ratio
Days To Sell
Active Listings at Month End 19
%
%
1
1
100
$925,000
$925,000
103
41
8
%
%
0
-100
-100
138
%
%
%
%
%
%
13
3
23
$3,175,000
$1,058,333
96
151
%
%
15
15
100
$12,058,600
$803,907
100
36
%
%
-13
-80
-74
32
324
%
%
%
%
%
Business with Land  Building
Units Listed 1
Units Sold 0
Sell/List Ratio
Sales Dollars $0
Average Price / Unit
Price Ratio
Days To Sell
Active Listings at Month End 4
%
%
1
0
$0
6
%
%
0
-33
%
%
%
%
%
%
3
0
0
$0
%
%
4
0
0
$0
%
%
-25 %
%
%
%
%
Page 5 of 8
Victoria Real Estate Board Multiple Listing Service ®
Monthly Comparative Activity By Property Type
Includes All MLS® Property Types
April 2023
Current Month
This Year % Change
Last Year
Year To Date
This Year % Change
Last Year
Produced: 01-May-2023
Business Only
Units Listed 9
Units Sold 1
Sell/List Ratio 11
Sales Dollars $55,000
Average Price / Unit $55,000
Price Ratio 73
Days To Sell 44
Active Listings at Month End 64
%
%
12
2
17
$235,000
$117,500
78
272
58
%
%
-25
-50
-77
-53
-84
10
%
%
%
%
%
%
46
13
28
$1,813,000
$139,462
85
122
%
%
42
6
14
$1,040,000
$173,333
87
145
%
%
10
117
74
-20
-16
%
%
%
%
%
Motel/Hotel
Units Listed 0
Units Sold 0
Sell/List Ratio
Sales Dollars $0
Average Price / Unit
Price Ratio
Days To Sell
Active Listings at Month End 0
%
%
0
0
$0
0
%
%
%
%
%
%
%
%
0
0
$0
%
%
0
0
$0
%
%
%
%
%
%
%
Lease - Office
Units Listed 4
Units Sold 1
Sell/List Ratio 25
Sales Dollars $22
Average Price / Unit $22
Price Ratio 122
Days To Sell 101
Active Listings at Month End 71
%
%
11
1
9
$17
$17
100
30
51
%
%
-64
0
29
29
237
39
%
%
%
%
%
%
42
14
33
$4,164
$297
99
102
%
%
37
9
24
$70,053
$7,784
45039
82
%
%
14
56
-94
-96
24
%
%
%
%
%
Lease - Retail
Units Listed 14
Units Sold 2
Sell/List Ratio 14
Sales Dollars $57
Average Price / Unit $29
Price Ratio 99
Days To Sell 195
Active Listings at Month End 52
%
%
5
4
80
$90
$22
101
99
37
%
%
180
-50
-36
27
98
41
%
%
%
%
%
%
34
6
18
$153
$26
99
159
%
%
26
10
38
$245
$24
98
94
%
%
31
-40
-38
4
70
%
%
%
%
%
Page 6 of 8
Victoria Real Estate Board Multiple Listing Service ®
Monthly Comparative Activity By Property Type
Includes All MLS® Property Types
April 2023
Current Month
This Year % Change
Last Year
Year To Date
This Year % Change
Last Year
Produced: 01-May-2023
Lease - Warehouse
Units Listed 0
Units Sold 0
Sell/List Ratio
Sales Dollars $0
Average Price / Unit
Price Ratio
Days To Sell
Active Listings at Month End 0
%
%
0
0
$0
0
%
%
%
%
%
%
%
%
0
0
$0
%
%
0
0
$0
%
%
%
%
%
%
%
Lease - Industrial
Units Listed 4
Units Sold 1
Sell/List Ratio 25
Sales Dollars $18
Average Price / Unit $18
Price Ratio 100
Days To Sell 70
Active Listings at Month End 21
%
%
1
2
200
$38
$19
96
78
2
%
%
300
-50
-53
-6
-10
950
%
%
%
%
%
%
22
5
23
$99
$20
4
58
%
%
3
2
67
$38
$19
96
78
%
%
633
150
159
3
-25
%
%
%
%
%
Lease - Other
Units Listed 0
Units Sold 1
Sell/List Ratio
Sales Dollars $13
Average Price / Unit $13
Price Ratio 100
Days To Sell 80
Active Listings at Month End 2
%
%
0
0
$0
3
%
%
-33
%
%
%
%
%
%
3
1
33
$13
$13
100
80
%
%
0
1
$23
$23
100
157
%
%
0
-46
-46
-49
%
%
%
%
%
Commercial Land
Units Listed 5
Units Sold 0
Sell/List Ratio
Sales Dollars $0
Average Price / Unit
Price Ratio
Days To Sell
Active Listings at Month End 14
%
%
3
0
$0
21
%
%
67
-33
%
%
%
%
%
%
7
0
0
$0
%
%
14
2
14
$18,025,000
$9,012,500
99
131
%
%
-50
-100
-100
%
%
%
%
%
Page 7 of 8
Victoria Real Estate Board Multiple Listing Service ®
Monthly Comparative Activity By Property Type
Includes All MLS® Property Types
April 2023
Current Month
This Year % Change
Last Year
Year To Date
This Year % Change
Last Year
Produced: 01-May-2023
Units Listed 1036
Units Sold 637
Sell/List Ratio 61
Sales Dollars $626,130,955
Average Price / Unit $982,937
Price Ratio 98
Days To Sell 37
Active Listings at Month End 2043
%
%
Grand Totals
1368
824
60
$888,832,845
$1,078,681
103
16
1365
%
%
-24
-23
-30
-9
130
50
%
%
%
%
%
%
3770
1965
52
$1,831,220,027
$931,919
98
42
%
%
4209
2849
68
$2,980,274,873
$1,046,078
104
18
%
%
-10
-31
-39
-11
126
%
%
%
%
%
Page 8 of 8
Victoria Real Estate Board Multiple Listing Service ®

More Related Content

Similar to VREB April 2023 Stats.pdf

VREB July 2020 Statistics
VREB July 2020 StatisticsVREB July 2020 Statistics
VREB July 2020 StatisticsVicky Aulakh
 
VREB Sept 2020 Stats
VREB Sept 2020 StatsVREB Sept 2020 Stats
VREB Sept 2020 StatsVicky Aulakh
 
VREB August 2020 Stats
VREB August 2020 Stats VREB August 2020 Stats
VREB August 2020 Stats Vicky Aulakh
 
VREB April 2022 Stats Package .pdf
VREB April 2022 Stats Package .pdfVREB April 2022 Stats Package .pdf
VREB April 2022 Stats Package .pdfVicky Aulakh
 
VREB October 2020 Statistics Package
VREB October 2020 Statistics PackageVREB October 2020 Statistics Package
VREB October 2020 Statistics PackageVicky Aulakh
 
Vreb may 2020 stats
Vreb may 2020 statsVreb may 2020 stats
Vreb may 2020 statsVicky Aulakh
 
VREB November 2022 Statistics
VREB November 2022 Statistics VREB November 2022 Statistics
VREB November 2022 Statistics VickyAulakh1
 
Vreb august 2019 stats package
Vreb august 2019 stats package Vreb august 2019 stats package
Vreb august 2019 stats package Vicky Aulakh
 
Vreb news releasefull
Vreb news releasefullVreb news releasefull
Vreb news releasefullVicky Aulakh
 
Victoria Real Estate Board June 2021 Statistics
Victoria Real Estate Board June 2021 StatisticsVictoria Real Estate Board June 2021 Statistics
Victoria Real Estate Board June 2021 StatisticsVicky Aulakh
 
Victoria Real Estate Board Statistics Package January 2022
Victoria Real Estate Board Statistics Package January 2022Victoria Real Estate Board Statistics Package January 2022
Victoria Real Estate Board Statistics Package January 2022VickyAulakh1
 
VREB August 2022 Statistics Package
VREB August 2022 Statistics Package VREB August 2022 Statistics Package
VREB August 2022 Statistics Package VickyAulakh1
 
Victoria Real Estate Board Monthly Statistics Package September 2023.pdf
Victoria Real Estate Board Monthly Statistics Package September 2023.pdfVictoria Real Estate Board Monthly Statistics Package September 2023.pdf
Victoria Real Estate Board Monthly Statistics Package September 2023.pdfVickyAulakh1
 
Victoria Real Estate Board Statistics January 2021
Victoria Real Estate Board Statistics January 2021Victoria Real Estate Board Statistics January 2021
Victoria Real Estate Board Statistics January 2021Vicky Aulakh
 
Victoria Real Estate Board July 2021 Statistics
Victoria Real Estate Board July 2021 StatisticsVictoria Real Estate Board July 2021 Statistics
Victoria Real Estate Board July 2021 StatisticsVicky Aulakh
 
VREB September 2021 Statistics Package
VREB September 2021 Statistics Package VREB September 2021 Statistics Package
VREB September 2021 Statistics Package VickyAulakh1
 
Victoria Real Estate Board April 2021 Statistics
Victoria Real Estate Board April 2021 StatisticsVictoria Real Estate Board April 2021 Statistics
Victoria Real Estate Board April 2021 StatisticsVicky Aulakh
 
Victoria Real Estate Board March 2021 Statistics Package
Victoria Real Estate Board March 2021 Statistics PackageVictoria Real Estate Board March 2021 Statistics Package
Victoria Real Estate Board March 2021 Statistics PackageVicky Aulakh
 

Similar to VREB April 2023 Stats.pdf (20)

VREB July 2020 Statistics
VREB July 2020 StatisticsVREB July 2020 Statistics
VREB July 2020 Statistics
 
VREB Sept 2020 Stats
VREB Sept 2020 StatsVREB Sept 2020 Stats
VREB Sept 2020 Stats
 
VREB August 2020 Stats
VREB August 2020 Stats VREB August 2020 Stats
VREB August 2020 Stats
 
VREB April 2022 Stats Package .pdf
VREB April 2022 Stats Package .pdfVREB April 2022 Stats Package .pdf
VREB April 2022 Stats Package .pdf
 
VREB October 2020 Statistics Package
VREB October 2020 Statistics PackageVREB October 2020 Statistics Package
VREB October 2020 Statistics Package
 
Vreb may 2020 stats
Vreb may 2020 statsVreb may 2020 stats
Vreb may 2020 stats
 
VREB November 2022 Statistics
VREB November 2022 Statistics VREB November 2022 Statistics
VREB November 2022 Statistics
 
VREB July 2022
VREB July 2022VREB July 2022
VREB July 2022
 
Vreb august 2019 stats package
Vreb august 2019 stats package Vreb august 2019 stats package
Vreb august 2019 stats package
 
Vreb news releasefull
Vreb news releasefullVreb news releasefull
Vreb news releasefull
 
Victoria Real Estate Board June 2021 Statistics
Victoria Real Estate Board June 2021 StatisticsVictoria Real Estate Board June 2021 Statistics
Victoria Real Estate Board June 2021 Statistics
 
Victoria Real Estate Board Statistics Package January 2022
Victoria Real Estate Board Statistics Package January 2022Victoria Real Estate Board Statistics Package January 2022
Victoria Real Estate Board Statistics Package January 2022
 
VREB August 2022 Statistics Package
VREB August 2022 Statistics Package VREB August 2022 Statistics Package
VREB August 2022 Statistics Package
 
Victoria Real Estate Board Monthly Statistics Package September 2023.pdf
Victoria Real Estate Board Monthly Statistics Package September 2023.pdfVictoria Real Estate Board Monthly Statistics Package September 2023.pdf
Victoria Real Estate Board Monthly Statistics Package September 2023.pdf
 
Victoria Real Estate Board Statistics January 2021
Victoria Real Estate Board Statistics January 2021Victoria Real Estate Board Statistics January 2021
Victoria Real Estate Board Statistics January 2021
 
Vreb july 2019
Vreb july 2019 Vreb july 2019
Vreb july 2019
 
Victoria Real Estate Board July 2021 Statistics
Victoria Real Estate Board July 2021 StatisticsVictoria Real Estate Board July 2021 Statistics
Victoria Real Estate Board July 2021 Statistics
 
VREB September 2021 Statistics Package
VREB September 2021 Statistics Package VREB September 2021 Statistics Package
VREB September 2021 Statistics Package
 
Victoria Real Estate Board April 2021 Statistics
Victoria Real Estate Board April 2021 StatisticsVictoria Real Estate Board April 2021 Statistics
Victoria Real Estate Board April 2021 Statistics
 
Victoria Real Estate Board March 2021 Statistics Package
Victoria Real Estate Board March 2021 Statistics PackageVictoria Real Estate Board March 2021 Statistics Package
Victoria Real Estate Board March 2021 Statistics Package
 

More from VickyAulakh1

NIDO by Wanson Group Floor Plan Set 2024
NIDO by Wanson Group Floor Plan Set 2024NIDO by Wanson Group Floor Plan Set 2024
NIDO by Wanson Group Floor Plan Set 2024VickyAulakh1
 
Portico by Wanson Group Floor Plans 2024
Portico by Wanson Group Floor Plans 2024Portico by Wanson Group Floor Plans 2024
Portico by Wanson Group Floor Plans 2024VickyAulakh1
 
Portico By Wanson Group Floor Plans 2024
Portico By Wanson Group Floor Plans 2024Portico By Wanson Group Floor Plans 2024
Portico By Wanson Group Floor Plans 2024VickyAulakh1
 
The Trails North Vancouver Floor Plans Feb 25, 2024
The Trails North Vancouver Floor Plans Feb 25, 2024The Trails North Vancouver Floor Plans Feb 25, 2024
The Trails North Vancouver Floor Plans Feb 25, 2024VickyAulakh1
 
AMAYA LIVING Surrey FLOOR PLANS by Panorama West Group
AMAYA LIVING Surrey FLOOR PLANS by Panorama West GroupAMAYA LIVING Surrey FLOOR PLANS by Panorama West Group
AMAYA LIVING Surrey FLOOR PLANS by Panorama West GroupVickyAulakh1
 
Willow Walk Oakridge Townhome & Garden Flat Floor Plans
Willow Walk Oakridge Townhome & Garden Flat Floor PlansWillow Walk Oakridge Townhome & Garden Flat Floor Plans
Willow Walk Oakridge Townhome & Garden Flat Floor PlansVickyAulakh1
 
JUNO Surrey By Streetside Developments Floor Plans
JUNO Surrey By Streetside Developments Floor PlansJUNO Surrey By Streetside Developments Floor Plans
JUNO Surrey By Streetside Developments Floor PlansVickyAulakh1
 
SKA+Building+2+Floorplan+-+Web+-+Current.pdf
SKA+Building+2+Floorplan+-+Web+-+Current.pdfSKA+Building+2+Floorplan+-+Web+-+Current.pdf
SKA+Building+2+Floorplan+-+Web+-+Current.pdfVickyAulakh1
 
Nolita-Floorplans.pdf
Nolita-Floorplans.pdfNolita-Floorplans.pdf
Nolita-Floorplans.pdfVickyAulakh1
 
Adore 49 Floor Plans.pdf
Adore 49 Floor Plans.pdfAdore 49 Floor Plans.pdf
Adore 49 Floor Plans.pdfVickyAulakh1
 
Citizen Burnaby Floor Plans
Citizen Burnaby Floor PlansCitizen Burnaby Floor Plans
Citizen Burnaby Floor PlansVickyAulakh1
 
April 2023 Okanagan Statistics Graphs.pdf
April 2023 Okanagan Statistics Graphs.pdfApril 2023 Okanagan Statistics Graphs.pdf
April 2023 Okanagan Statistics Graphs.pdfVickyAulakh1
 
FVREB April 2023 Statistics Package.pdf
FVREB April 2023 Statistics Package.pdfFVREB April 2023 Statistics Package.pdf
FVREB April 2023 Statistics Package.pdfVickyAulakh1
 
Okanagan Statistics Reports March 2023
Okanagan Statistics Reports March 2023Okanagan Statistics Reports March 2023
Okanagan Statistics Reports March 2023VickyAulakh1
 
FVREB March 2023 Statistics Package.pdf
FVREB March 2023 Statistics Package.pdfFVREB March 2023 Statistics Package.pdf
FVREB March 2023 Statistics Package.pdfVickyAulakh1
 
Central Okangan Monthly Statistics - February 2023.pdf
Central Okangan Monthly Statistics - February 2023.pdfCentral Okangan Monthly Statistics - February 2023.pdf
Central Okangan Monthly Statistics - February 2023.pdfVickyAulakh1
 
FVREB Feb 2023 Statistics Package.pdf
FVREB Feb 2023 Statistics Package.pdfFVREB Feb 2023 Statistics Package.pdf
FVREB Feb 2023 Statistics Package.pdfVickyAulakh1
 
January 2023 Okanagan Statistics with charts and graphs
January 2023 Okanagan Statistics with charts and graphsJanuary 2023 Okanagan Statistics with charts and graphs
January 2023 Okanagan Statistics with charts and graphsVickyAulakh1
 
FVREB January 2023 Statistics Package
FVREB January 2023 Statistics PackageFVREB January 2023 Statistics Package
FVREB January 2023 Statistics PackageVickyAulakh1
 
BCREA December 2022.pdf
BCREA December 2022.pdfBCREA December 2022.pdf
BCREA December 2022.pdfVickyAulakh1
 

More from VickyAulakh1 (20)

NIDO by Wanson Group Floor Plan Set 2024
NIDO by Wanson Group Floor Plan Set 2024NIDO by Wanson Group Floor Plan Set 2024
NIDO by Wanson Group Floor Plan Set 2024
 
Portico by Wanson Group Floor Plans 2024
Portico by Wanson Group Floor Plans 2024Portico by Wanson Group Floor Plans 2024
Portico by Wanson Group Floor Plans 2024
 
Portico By Wanson Group Floor Plans 2024
Portico By Wanson Group Floor Plans 2024Portico By Wanson Group Floor Plans 2024
Portico By Wanson Group Floor Plans 2024
 
The Trails North Vancouver Floor Plans Feb 25, 2024
The Trails North Vancouver Floor Plans Feb 25, 2024The Trails North Vancouver Floor Plans Feb 25, 2024
The Trails North Vancouver Floor Plans Feb 25, 2024
 
AMAYA LIVING Surrey FLOOR PLANS by Panorama West Group
AMAYA LIVING Surrey FLOOR PLANS by Panorama West GroupAMAYA LIVING Surrey FLOOR PLANS by Panorama West Group
AMAYA LIVING Surrey FLOOR PLANS by Panorama West Group
 
Willow Walk Oakridge Townhome & Garden Flat Floor Plans
Willow Walk Oakridge Townhome & Garden Flat Floor PlansWillow Walk Oakridge Townhome & Garden Flat Floor Plans
Willow Walk Oakridge Townhome & Garden Flat Floor Plans
 
JUNO Surrey By Streetside Developments Floor Plans
JUNO Surrey By Streetside Developments Floor PlansJUNO Surrey By Streetside Developments Floor Plans
JUNO Surrey By Streetside Developments Floor Plans
 
SKA+Building+2+Floorplan+-+Web+-+Current.pdf
SKA+Building+2+Floorplan+-+Web+-+Current.pdfSKA+Building+2+Floorplan+-+Web+-+Current.pdf
SKA+Building+2+Floorplan+-+Web+-+Current.pdf
 
Nolita-Floorplans.pdf
Nolita-Floorplans.pdfNolita-Floorplans.pdf
Nolita-Floorplans.pdf
 
Adore 49 Floor Plans.pdf
Adore 49 Floor Plans.pdfAdore 49 Floor Plans.pdf
Adore 49 Floor Plans.pdf
 
Citizen Burnaby Floor Plans
Citizen Burnaby Floor PlansCitizen Burnaby Floor Plans
Citizen Burnaby Floor Plans
 
April 2023 Okanagan Statistics Graphs.pdf
April 2023 Okanagan Statistics Graphs.pdfApril 2023 Okanagan Statistics Graphs.pdf
April 2023 Okanagan Statistics Graphs.pdf
 
FVREB April 2023 Statistics Package.pdf
FVREB April 2023 Statistics Package.pdfFVREB April 2023 Statistics Package.pdf
FVREB April 2023 Statistics Package.pdf
 
Okanagan Statistics Reports March 2023
Okanagan Statistics Reports March 2023Okanagan Statistics Reports March 2023
Okanagan Statistics Reports March 2023
 
FVREB March 2023 Statistics Package.pdf
FVREB March 2023 Statistics Package.pdfFVREB March 2023 Statistics Package.pdf
FVREB March 2023 Statistics Package.pdf
 
Central Okangan Monthly Statistics - February 2023.pdf
Central Okangan Monthly Statistics - February 2023.pdfCentral Okangan Monthly Statistics - February 2023.pdf
Central Okangan Monthly Statistics - February 2023.pdf
 
FVREB Feb 2023 Statistics Package.pdf
FVREB Feb 2023 Statistics Package.pdfFVREB Feb 2023 Statistics Package.pdf
FVREB Feb 2023 Statistics Package.pdf
 
January 2023 Okanagan Statistics with charts and graphs
January 2023 Okanagan Statistics with charts and graphsJanuary 2023 Okanagan Statistics with charts and graphs
January 2023 Okanagan Statistics with charts and graphs
 
FVREB January 2023 Statistics Package
FVREB January 2023 Statistics PackageFVREB January 2023 Statistics Package
FVREB January 2023 Statistics Package
 
BCREA December 2022.pdf
BCREA December 2022.pdfBCREA December 2022.pdf
BCREA December 2022.pdf
 

Recently uploaded

Call Girls in Nehru Place Delhi 💯Call Us 🔝8264348440🔝
Call Girls in Nehru Place Delhi 💯Call Us 🔝8264348440🔝Call Girls in Nehru Place Delhi 💯Call Us 🔝8264348440🔝
Call Girls in Nehru Place Delhi 💯Call Us 🔝8264348440🔝soniya singh
 
Low Rate Call Girls in Triveni Complex Delhi Call 9990771857
Low Rate Call Girls in Triveni Complex Delhi Call 9990771857Low Rate Call Girls in Triveni Complex Delhi Call 9990771857
Low Rate Call Girls in Triveni Complex Delhi Call 9990771857delhimodel235
 
Building Dreams: Newman Leech's Visionary Approach to Real Estate Investment
Building Dreams: Newman Leech's Visionary Approach to Real Estate InvestmentBuilding Dreams: Newman Leech's Visionary Approach to Real Estate Investment
Building Dreams: Newman Leech's Visionary Approach to Real Estate InvestmentNewman George Leech
 
Call Girls in laxmi Nagar Delhi 💯Call Us 🔝 9582086666🔝 South Delhi Escorts Se...
Call Girls in laxmi Nagar Delhi 💯Call Us 🔝 9582086666🔝 South Delhi Escorts Se...Call Girls in laxmi Nagar Delhi 💯Call Us 🔝 9582086666🔝 South Delhi Escorts Se...
Call Girls in laxmi Nagar Delhi 💯Call Us 🔝 9582086666🔝 South Delhi Escorts Se...delhimodel235
 
Call Girls In Mayur Vihar-1 Delhi ❤️8860477959 Good Looking Escorts In 24/7 D...
Call Girls In Mayur Vihar-1 Delhi ❤️8860477959 Good Looking Escorts In 24/7 D...Call Girls In Mayur Vihar-1 Delhi ❤️8860477959 Good Looking Escorts In 24/7 D...
Call Girls In Mayur Vihar-1 Delhi ❤️8860477959 Good Looking Escorts In 24/7 D...lizamodels9
 
9990771857 Call Girls in Noida Sector 11 Noida (Call Girls) Delhi
9990771857 Call Girls in Noida Sector 11 Noida (Call Girls) Delhi9990771857 Call Girls in Noida Sector 11 Noida (Call Girls) Delhi
9990771857 Call Girls in Noida Sector 11 Noida (Call Girls) Delhidelhimodel235
 
9990771857 Call Girls in Noida Sector 06 Noida (Call Girls) Delhi
9990771857 Call Girls in Noida Sector 06 Noida (Call Girls) Delhi9990771857 Call Girls in Noida Sector 06 Noida (Call Girls) Delhi
9990771857 Call Girls in Noida Sector 06 Noida (Call Girls) Delhidelhimodel235
 
9990771857 Call Girls in Noida Sector 1 Noida (Call Girls) Delhi
9990771857 Call Girls in Noida Sector 1 Noida (Call Girls) Delhi9990771857 Call Girls in Noida Sector 1 Noida (Call Girls) Delhi
9990771857 Call Girls in Noida Sector 1 Noida (Call Girls) Delhidelhimodel235
 
Call Girls In Vasundhara Ghaziabad ❤️8860477959 Low Rate Escorts Service In 2...
Call Girls In Vasundhara Ghaziabad ❤️8860477959 Low Rate Escorts Service In 2...Call Girls In Vasundhara Ghaziabad ❤️8860477959 Low Rate Escorts Service In 2...
Call Girls In Vasundhara Ghaziabad ❤️8860477959 Low Rate Escorts Service In 2...lizamodels9
 
Rustomjee The Panorama At Pali Hill, Bandra West, Mumbai - Brochure.pdf
Rustomjee The Panorama At Pali Hill, Bandra West, Mumbai - Brochure.pdfRustomjee The Panorama At Pali Hill, Bandra West, Mumbai - Brochure.pdf
Rustomjee The Panorama At Pali Hill, Bandra West, Mumbai - Brochure.pdfmonikasharma630
 
Cashpay_Call Girls In Gaur City Mall Noida ❤️8860477959 Escorts Service In 24...
Cashpay_Call Girls In Gaur City Mall Noida ❤️8860477959 Escorts Service In 24...Cashpay_Call Girls In Gaur City Mall Noida ❤️8860477959 Escorts Service In 24...
Cashpay_Call Girls In Gaur City Mall Noida ❤️8860477959 Escorts Service In 24...lizamodels9
 
Call Girls in Inderpuri Delhi 💯Call Us 🔝8264348440🔝
Call Girls in Inderpuri Delhi 💯Call Us 🔝8264348440🔝Call Girls in Inderpuri Delhi 💯Call Us 🔝8264348440🔝
Call Girls in Inderpuri Delhi 💯Call Us 🔝8264348440🔝soniya singh
 
Listing Turkey Sylvana Istanbul - Bahcesehir
Listing Turkey Sylvana Istanbul - BahcesehirListing Turkey Sylvana Istanbul - Bahcesehir
Listing Turkey Sylvana Istanbul - BahcesehirListing Turkey
 
Call Girls in Pitampura Delhi 💯Call Us 🔝8264348440🔝
Call Girls in Pitampura Delhi 💯Call Us 🔝8264348440🔝Call Girls in Pitampura Delhi 💯Call Us 🔝8264348440🔝
Call Girls in Pitampura Delhi 💯Call Us 🔝8264348440🔝soniya singh
 
Omaxe Dwarka In Delhi E Brochure Pdf
Omaxe Dwarka In Delhi E Brochure     PdfOmaxe Dwarka In Delhi E Brochure     Pdf
Omaxe Dwarka In Delhi E Brochure Pdfashiyadav24
 
Nanke Area Estate commercial ( Dir. Kat Kuo)
Nanke Area Estate commercial ( Dir. Kat Kuo)Nanke Area Estate commercial ( Dir. Kat Kuo)
Nanke Area Estate commercial ( Dir. Kat Kuo)jessica288382
 
Call Girls in Sarai Kale Khan Delhi 💯Call Us 🔝8264348440🔝
Call Girls in Sarai Kale Khan Delhi 💯Call Us 🔝8264348440🔝Call Girls in Sarai Kale Khan Delhi 💯Call Us 🔝8264348440🔝
Call Girls in Sarai Kale Khan Delhi 💯Call Us 🔝8264348440🔝soniya singh
 
Model Call Girl in Shastri Nagar Delhi reach out to us at 🔝8264348440🔝
Model Call Girl in Shastri Nagar Delhi reach out to us at 🔝8264348440🔝Model Call Girl in Shastri Nagar Delhi reach out to us at 🔝8264348440🔝
Model Call Girl in Shastri Nagar Delhi reach out to us at 🔝8264348440🔝soniya singh
 
83770-87607 ۞Call Girls In Near The Park Hotel (Cp) Delhi
83770-87607 ۞Call Girls In Near The Park Hotel (Cp) Delhi83770-87607 ۞Call Girls In Near The Park Hotel (Cp) Delhi
83770-87607 ۞Call Girls In Near The Park Hotel (Cp) Delhidollysharma2066
 

Recently uploaded (20)

Call Girls in Nehru Place Delhi 💯Call Us 🔝8264348440🔝
Call Girls in Nehru Place Delhi 💯Call Us 🔝8264348440🔝Call Girls in Nehru Place Delhi 💯Call Us 🔝8264348440🔝
Call Girls in Nehru Place Delhi 💯Call Us 🔝8264348440🔝
 
Low Rate Call Girls in Triveni Complex Delhi Call 9990771857
Low Rate Call Girls in Triveni Complex Delhi Call 9990771857Low Rate Call Girls in Triveni Complex Delhi Call 9990771857
Low Rate Call Girls in Triveni Complex Delhi Call 9990771857
 
Building Dreams: Newman Leech's Visionary Approach to Real Estate Investment
Building Dreams: Newman Leech's Visionary Approach to Real Estate InvestmentBuilding Dreams: Newman Leech's Visionary Approach to Real Estate Investment
Building Dreams: Newman Leech's Visionary Approach to Real Estate Investment
 
Call Girls in laxmi Nagar Delhi 💯Call Us 🔝 9582086666🔝 South Delhi Escorts Se...
Call Girls in laxmi Nagar Delhi 💯Call Us 🔝 9582086666🔝 South Delhi Escorts Se...Call Girls in laxmi Nagar Delhi 💯Call Us 🔝 9582086666🔝 South Delhi Escorts Se...
Call Girls in laxmi Nagar Delhi 💯Call Us 🔝 9582086666🔝 South Delhi Escorts Se...
 
Call Girls In Mayur Vihar-1 Delhi ❤️8860477959 Good Looking Escorts In 24/7 D...
Call Girls In Mayur Vihar-1 Delhi ❤️8860477959 Good Looking Escorts In 24/7 D...Call Girls In Mayur Vihar-1 Delhi ❤️8860477959 Good Looking Escorts In 24/7 D...
Call Girls In Mayur Vihar-1 Delhi ❤️8860477959 Good Looking Escorts In 24/7 D...
 
9990771857 Call Girls in Noida Sector 11 Noida (Call Girls) Delhi
9990771857 Call Girls in Noida Sector 11 Noida (Call Girls) Delhi9990771857 Call Girls in Noida Sector 11 Noida (Call Girls) Delhi
9990771857 Call Girls in Noida Sector 11 Noida (Call Girls) Delhi
 
9990771857 Call Girls in Noida Sector 06 Noida (Call Girls) Delhi
9990771857 Call Girls in Noida Sector 06 Noida (Call Girls) Delhi9990771857 Call Girls in Noida Sector 06 Noida (Call Girls) Delhi
9990771857 Call Girls in Noida Sector 06 Noida (Call Girls) Delhi
 
9990771857 Call Girls in Noida Sector 1 Noida (Call Girls) Delhi
9990771857 Call Girls in Noida Sector 1 Noida (Call Girls) Delhi9990771857 Call Girls in Noida Sector 1 Noida (Call Girls) Delhi
9990771857 Call Girls in Noida Sector 1 Noida (Call Girls) Delhi
 
Call Girls In Vasundhara Ghaziabad ❤️8860477959 Low Rate Escorts Service In 2...
Call Girls In Vasundhara Ghaziabad ❤️8860477959 Low Rate Escorts Service In 2...Call Girls In Vasundhara Ghaziabad ❤️8860477959 Low Rate Escorts Service In 2...
Call Girls In Vasundhara Ghaziabad ❤️8860477959 Low Rate Escorts Service In 2...
 
Rustomjee The Panorama At Pali Hill, Bandra West, Mumbai - Brochure.pdf
Rustomjee The Panorama At Pali Hill, Bandra West, Mumbai - Brochure.pdfRustomjee The Panorama At Pali Hill, Bandra West, Mumbai - Brochure.pdf
Rustomjee The Panorama At Pali Hill, Bandra West, Mumbai - Brochure.pdf
 
Cashpay_Call Girls In Gaur City Mall Noida ❤️8860477959 Escorts Service In 24...
Cashpay_Call Girls In Gaur City Mall Noida ❤️8860477959 Escorts Service In 24...Cashpay_Call Girls In Gaur City Mall Noida ❤️8860477959 Escorts Service In 24...
Cashpay_Call Girls In Gaur City Mall Noida ❤️8860477959 Escorts Service In 24...
 
Call Girls in Inderpuri Delhi 💯Call Us 🔝8264348440🔝
Call Girls in Inderpuri Delhi 💯Call Us 🔝8264348440🔝Call Girls in Inderpuri Delhi 💯Call Us 🔝8264348440🔝
Call Girls in Inderpuri Delhi 💯Call Us 🔝8264348440🔝
 
Listing Turkey Sylvana Istanbul - Bahcesehir
Listing Turkey Sylvana Istanbul - BahcesehirListing Turkey Sylvana Istanbul - Bahcesehir
Listing Turkey Sylvana Istanbul - Bahcesehir
 
Call Girls in Pitampura Delhi 💯Call Us 🔝8264348440🔝
Call Girls in Pitampura Delhi 💯Call Us 🔝8264348440🔝Call Girls in Pitampura Delhi 💯Call Us 🔝8264348440🔝
Call Girls in Pitampura Delhi 💯Call Us 🔝8264348440🔝
 
Omaxe Dwarka In Delhi E Brochure Pdf
Omaxe Dwarka In Delhi E Brochure     PdfOmaxe Dwarka In Delhi E Brochure     Pdf
Omaxe Dwarka In Delhi E Brochure Pdf
 
Nanke Area Estate commercial ( Dir. Kat Kuo)
Nanke Area Estate commercial ( Dir. Kat Kuo)Nanke Area Estate commercial ( Dir. Kat Kuo)
Nanke Area Estate commercial ( Dir. Kat Kuo)
 
Call Girls in Sarai Kale Khan Delhi 💯Call Us 🔝8264348440🔝
Call Girls in Sarai Kale Khan Delhi 💯Call Us 🔝8264348440🔝Call Girls in Sarai Kale Khan Delhi 💯Call Us 🔝8264348440🔝
Call Girls in Sarai Kale Khan Delhi 💯Call Us 🔝8264348440🔝
 
Model Call Girl in Shastri Nagar Delhi reach out to us at 🔝8264348440🔝
Model Call Girl in Shastri Nagar Delhi reach out to us at 🔝8264348440🔝Model Call Girl in Shastri Nagar Delhi reach out to us at 🔝8264348440🔝
Model Call Girl in Shastri Nagar Delhi reach out to us at 🔝8264348440🔝
 
83770-87607 ۞Call Girls In Near The Park Hotel (Cp) Delhi
83770-87607 ۞Call Girls In Near The Park Hotel (Cp) Delhi83770-87607 ۞Call Girls In Near The Park Hotel (Cp) Delhi
83770-87607 ۞Call Girls In Near The Park Hotel (Cp) Delhi
 
Low Rate Call Girls in Triveni Complex Delhi Call 9873940964
Low Rate Call Girls in Triveni Complex Delhi Call 9873940964Low Rate Call Girls in Triveni Complex Delhi Call 9873940964
Low Rate Call Girls in Triveni Complex Delhi Call 9873940964
 

VREB April 2023 Stats.pdf

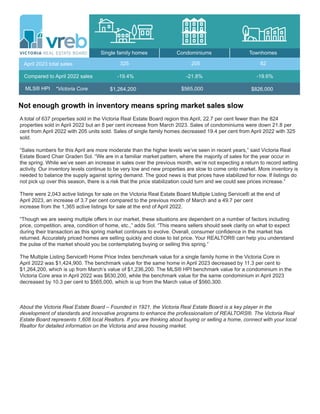
  • 1. Not enough growth in inventory means spring market sales slow A total of 637 properties sold in the Victoria Real Estate Board region this April, 22.7 per cent fewer than the 824 properties sold in April 2022 but an 8 per cent increase from March 2023. Sales of condominiums were down 21.8 per cent from April 2022 with 205 units sold. Sales of single family homes decreased 19.4 per cent from April 2022 with 325 sold. “Sales numbers for this April are more moderate than the higher levels we’ve seen in recent years,” said Victoria Real Estate Board Chair Graden Sol. “We are in a familiar market pattern, where the majority of sales for the year occur in the spring. While we’ve seen an increase in sales over the previous month, we’re not expecting a return to record setting activity. Our inventory levels continue to be very low and new properties are slow to come onto market. More inventory is needed to balance the supply against spring demand. The good news is that prices have stabilized for now. If listings do not pick up over this season, there is a risk that the price stabilization could turn and we could see prices increase.” There were 2,043 active listings for sale on the Victoria Real Estate Board Multiple Listing Service® at the end of April 2023, an increase of 3.7 per cent compared to the previous month of March and a 49.7 per cent increase from the 1,365 active listings for sale at the end of April 2022. “Though we are seeing multiple offers in our market, these situations are dependent on a number of factors including price, competition, area, condition of home, etc.,” adds Sol. “This means sellers should seek clarity on what to expect during their transaction as this spring market continues to evolve. Overall, consumer confidence in the market has returned. Accurately priced homes are selling quickly and close to list price. Your REALTOR® can help you understand the pulse of the market should you be contemplating buying or selling this spring.” The Multiple Listing Service® Home Price Index benchmark value for a single family home in the Victoria Core in April 2022 was $1,424,900. The benchmark value for the same home in April 2023 decreased by 11.3 per cent to $1,264,200, which is up from March’s value of $1,236,200. The MLS® HPI benchmark value for a condominium in the Victoria Core area in April 2022 was $630,200, while the benchmark value for the same condominium in April 2023 decreased by 10.3 per cent to $565,000, which is up from the March value of $560,300. About the Victoria Real Estate Board – Founded in 1921, the Victoria Real Estate Board is a key player in the development of standards and innovative programs to enhance the professionalism of REALTORS®. The Victoria Real Estate Board represents 1,608 local Realtors. If you are thinking about buying or selling a home, connect with your local Realtor for detailed information on the Victoria and area housing market. Single family homes Condominiums Townhomes April 2023 total sales Compared to April 2022 sales MLS® HPI 325 $1,264,200 205 -19.4% -21.8% 82 -19.6% $565,000 $826,000 *Victoria Core
  • 2. Sales by Property Type Single Family Greater Victoria Single Family Other Areas Single Family Total All Areas Condo Apartment Row/Townhouse Manufactured Home Total Residential Total Sales Active Listings Units Median$ Average$ LY% LM% LY% LM% LY% LM% Units Median$ Average$ Units Median$ Average$ April 2023 317 205 82 9 621 325 637 8 2,043 266 197 67 15 560 281 590 15 1,970 393 262 102 15 782 403 824 10 1,365 $1,291,399 $620,606 $786,010 $352,222 $1,288,146 $1,159,250 $1,195,000 $540,000 $739,540 $320,000 $1,195,000 $1,060,000 $1,241,248 $628,230 $774,710 $338,667 $1,225,446 $945,226 $1,100,000 $569,500 $750,000 $317,500 $1,080,000 $950,000 $1,434,415 $666,733 $946,319 $355,569 $1,432,298 $1,349,101 $1,250,000 $601,000 $890,000 $302,729 $1,251,000 $1,320,000 19.2% 4.1% 22.4% -40.0% 10.9% 15.7% 8.0% -46.7% 3.7% -19.3% -21.8% -19.6% -40.0% -20.6% -19.4% -22.7% -20.0% 49.7% 4.0% -1.2% 1.5% 4.0% 5.1% 22.6% -10.0% -6.9% -16.9% -0.9% -10.1% -14.1% 8.6% -5.2% -1.4% 0.8% 10.6% 11.6% -4.4% -10.1% -16.9% 5.7% -4.5% -19.7% March 2023 April 2022 Legend Units: net number of listings sold LM%: percentage change since Last Month LY%: percentage change since This Month Last Year Average$: average selling price Median$: median selling price Total Residential: includes sales of residential property types Total Sales: includes sales of all property types Active Listings: total listings of all types on the market at midnight on the last day of the month This Month Last Month Produced: 01-May-2023 April 2023 Previous Periods Comparison This Month Last Year Page 1 of 1 Victoria Real Estate Board Multiple Listing Service ® April 2023 Statistics Package for Media Victoria Real Estate Board April 2023 Statistics - page 2 Previous Periods Comparison of Unit Sales, Average Prices and Median Prices Previous Periods Comparison of MLS® HPI Benchmark Prices and MLS® HPI Index Values
  • 3. 6DOHVWR$FWLYH/LVWLQJV5DWLR The ratio of counts of total residential sales over total active residential listings for the last 25 months $SULO Produced: 01-May-2023 $SU 0D -XQ -XO $XJ 6HS 2FW 1RY 'HF -DQ )HE 0DU $SU 0D -XQ -XO $XJ 6HS 2FW 1RY 'HF -DQ )HE 0DU $SU 7KH6DOHVWR$FWLYH/LVWLQJV5DWLR 7KLV FKDUWWUDFNVWKHUDWLRRIWRWDOUHVLGHQWLDOVDOHVRYHUWRWDODFWLYHUHVLGHQWLDOOLVWLQJVDWPRQWKHQGIRU HDFKRIWKHODVWPRQWKV 7KHDFWLYHOLVWLQJFRXQWDQGWKHVDOHVFRXQWFDQEHYLHZHGDVLQGLFDWRUVRIKRXVLQJVXSSODQG GHPDQGUHVSHFWLYHO2EVHUYLQJWKHUDWLREHWZHHQWKHPFDQWKXVKHOSLQGLFDWHDEXHUV PDUNHW ZKHUHWKHUHLVVXVWDLQHGGRZQZDUGSUHVVXUHRQSULFHVDQGDVHOOHUV PDUNHWZKHUHWKHUHLV VXVWDLQHGXSZDUGSUHVVXUHRQSULFHV %DVHGRQDUHJUHVVLRQDQDOVLVSHUIRUPHGEWKH(FRQRPLFV'HSDUWPHQWRIWKH%5HDO(VWDWH $VVRFLDWLRQLQHDFKPDUNHWDUHDRIWKHSURYLQFHWKH6DOHVWR$FWLYH/LVWLQJV5DWLRIRU9LFWRULDFDQEH LQWHUSUHWHGDVIROORZV EHORZWKHUHLVGRZQZDUGSUHVVXUHRQSULFHV EXHUV PDUNHW DERYHWKHUHLVXSZDUGSUHVVXUHRQSULFHV VHOOHUV PDUNHW Sales to Active Listings Ratio This chart tracks the ratio of total residential sales over total active residential listings at month-end for each of the last 25 months. Based on a regression analysis performed by the economics department at the BC Real Estate Association in each market area of the province, the Sales to Active Listings Ratio for Victoria can be interpreted as follows: - below 14%, there is downward pressure on prices (buyers' market) - above 20%, there is upward pressure on prices (sellers' market) - in the 14-20% range, there is little pressure on prices either way (balanced market) Victoria Real Estate Board April 2023 Statistics - page 3 Total new MLS® listings and total MLS® sales for entire district
  • 4. The Victoria Real Estate Board uses the MLS® Home Price Index (MLS® HPI) to report on market trends. The MLS® HPI uses the concept of a benchmark home, a notional home with common attributes of typical homes in a defined area. Through the analysis of over fifteen years of Victoria Real Estate Board MLS® sales data, the MLS® HPI defined benchmark homes for Victoria in each category (single family homes, townhouses, condos) and for each neighbourhood. The benchmark starting point was 2005, where each type of property and neighbourhood was assigned an index value of 100. *The HPI reporting herein is based on the SOLD date. Victoria Real Estate Board April 2023 Statistics - page 4 MLS® HPI benchmark and value - Single Family Homes
  • 5. MLS® HPI benchmark and value - Condominium / Apartments Victoria Real Estate Board April 2023 Statistics - page 5
  • 6. Note: Areas with insufficient sales are not included in the HPI. Source: Victoria Real Estate Board April 2023 1 Month Ago 3 Months Ago 6 Months Ago 12 Months Ago 3 Years Ago 5 Years Ago January 2005 Victoria REB – SF-All Victoria – SF-All Victoria West – SF-All Oak Bay – SF-All Esquimalt – SF-All View Royal – SF-All Saanich East – SF-All Saanich West – SF-All Sooke – SF-All Langford – SF-All Metchosin – SF-All Colwood – SF-All Highlands – SF-All North Saanich – SF-All Sidney – SF-All Central Saanich – SF-All ML Malahat Area – SF-All GI Gulf Islands – SF-All $998,600 $991,800 $989,100 $986,700 $984,700 $983,700 $975,700 $975,200 $974,900 $974,100 $969,800 $966,900 $965,000 $962,400 $962,300 $952,900 $949,800 $946,300 $945,600 $934,800 $925,900 $925,400 $924,500 $924,400 $907,300 $905,100 $882,900 $875,600 $868,600 $858,500 $855,700 $853,400 $851,700 $850,800 $847,100 $839,900 $836,200 $819,200 $816,600 $812,500 $800,600 $775,200 $773,000 $760,400 $752,700 $748,000 $745,400 $744,000 $737,900 $734,400 $730,700 $719,100 $709,300 $705,400 $700,600 $693,500 $689,800 $680,900 $661,900 $614,100 $600,100 $579,000 $576,800 $554,400 $538,400 $475,900 $473,800 $469,000 $436,800 $417,900 $384,500 $370,800 $355,800 $336,900 $330,600 $327,600 $319,700 $303,500 $303,200 $302,700 $294,100 $288,400 $270,400 $1,935,500 $1,925,500 $1,764,800 $1,757,000 $1,714,600 $1,537,300 $1,526,000 $1,442,300 $1,432,300 $1,423,600 $1,419,000 $1,401,800 $1,379,400 $1,375,400 $1,371,400 $1,366,700 $1,356,700 $1,354,700 $1,347,900 $1,336,500 $1,326,600 $1,322,500 $1,311,200 $1,305,000 $1,290,300 $1,280,000 $1,275,400 $1,275,400 $1,262,300 $1,250,000 $1,243,100 $1,214,600 $1,214,100 $1,206,200 $1,201,800 $1,193,600 $1,170,400 $1,157,800 $1,154,600 $1,127,500 $1,123,800 $1,117,400 $1,109,400 $1,108,100 $1,098,100 $1,085,300 $1,084,700 $1,077,300 $1,068,800 $1,066,700 $1,059,100 $1,057,900 $1,055,900 $1,049,600 $1,044,600 $1,042,900 $1,039,900 $1,007,000 $1,003,600 $1,003,500 $1,002,700 Benchmark Price by Timeframe and Property Type Value or percent change Value Percent change HPI or Benchmark Price HPI Benchmark Price 1. Area Group VREB District Summary 3. Area/Property Type Selection All 2. Property Type – Single Family-All (SF-All)
  • 7. Note: Areas with insufficient sales are not included in the HPI. Source: Victoria Real Estate Board April 2023 1 Month Ago 3 Months Ago 6 Months Ago 12 Months Ago 3 Years Ago 5 Years Ago January 2005 Victoria REB – SF-All Victoria – SF-All Victoria West – SF-All Oak Bay – SF-All Esquimalt – SF-All View Royal – SF-All Saanich East – SF-All Saanich West – SF-All Sooke – SF-All Langford – SF-All Metchosin – SF-All Colwood – SF-All Highlands – SF-All North Saanich – SF-All Sidney – SF-All Central Saanich – SF-All ML Malahat Area – SF-All GI Gulf Islands – SF-All 370.6 368.8 366.5 356.7 355.4 355.3 352.7 350.2 349.4 346.3 345.1 344.0 342.4 335.2 333.7 332.1 331.5 327.2 325.4 325.1 324.5 324.4 324.2 323.8 323.3 323.0 323.0 322.5 321.9 320.9 320.6 320.4 320.4 318.9 318.3 318.3 317.4 315.9 315.6 315.0 314.8 314.0 313.7 313.3 310.6 308.7 308.6 308.6 308.5 306.3 305.4 305.2 305.0 304.9 304.4 303.7 303.6 303.3 303.1 302.8 302.1 301.3 300.2 299.1 299.0 298.9 298.8 298.8 298.2 297.7 296.8 296.7 295.0 294.4 294.1 294.1 292.8 292.4 292.4 292.3 291.2 289.9 285.7 280.8 280.3 275.5 269.1 250.5 249.7 248.0 245.9 245.6 241.4 240.4 238.2 237.2 236.7 234.5 233.1 233.0 229.2 228.7 228.4 223.2 222.0 220.9 220.8 217.3 216.5 215.9 215.8 215.0 214.1 212.9 208.0 207.8 207.0 206.2 199.1 198.9 198.8 196.5 194.5 192.2 190.0 156.1 100.0 100.0 100.0 100.0 100.0 100.0 100.0 100.0 100.0 100.0 100.0 100.0 100.0 100.0 100.0 100.0 100.0 100.0 HPI by Timeframe and Property Type Value or percent change Value Percent change HPI or Benchmark Price HPI Benchmark Price 1. Area Group VREB District Summary 3. Area/Property Type Selection All 2. Property Type – Single Family-All (SF-All)
  • 8. Note: Areas with insufficient sales are not included in the HPI. Source: Victoria Real Estate Board April 2023 1 Month Ago 3 Months Ago 6 Months Ago 12 Months Ago 3 Years Ago 5 Years Ago January 2005 Victoria REB – Con Victoria – Con Victoria West – Con Oak Bay – Con Esquimalt – Con View Royal – Con Saanich East – Con Saanich West – Con Sooke – Con Langford – Con Colwood – Con North Saanich – Con Sidney – Con Central Saanich – Con $871,400 $825,500 $817,300 $799,500 $798,400 $769,900 $765,700 $758,400 $757,000 $750,100 $747,600 $747,000 $716,800 $710,600 $684,600 $678,000 $670,000 $660,000 $657,900 $643,100 $629,800 $629,400 $622,700 $620,100 $618,900 $617,700 $612,100 $611,300 $607,100 $601,100 $597,800 $596,700 $596,700 $592,600 $588,500 $585,000 $580,800 $572,000 $571,000 $569,900 $569,400 $568,200 $566,700 $566,500 $565,500 $564,500 $562,700 $558,100 $556,700 $556,100 $552,100 $550,000 $549,100 $549,100 $548,400 $546,100 $538,500 $538,000 $535,900 $535,300 $531,600 $530,500 $523,600 $522,000 $517,600 $517,100 $514,000 $513,800 $513,100 $507,400 $505,200 $488,200 $476,900 $472,800 $470,700 $464,500 $462,200 $459,100 $456,600 $453,300 $448,700 $448,600 $446,300 $440,800 $432,300 $429,200 $412,600 $404,800 $401,600 $401,200 $396,000 $386,100 $376,700 $376,600 $370,600 $340,000 $300,500 $285,500 $275,600 $234,200 $231,100 $199,200 $195,700 $195,500 $169,900 $167,000 $159,100 $152,000 $150,200 $143,700 $131,400 $115,000 Benchmark Price by Timeframe and Property Type Value or percent change Value Percent change HPI or Benchmark Price HPI Benchmark Price 1. Area Group VREB District Summary 3. Area/Property Type Selection All 2. Property Type – Condo Apartment (Con)
  • 9. Note: Areas with insufficient sales are not included in the HPI. Source: Victoria Real Estate Board April 2023 1 Month Ago 3 Months Ago 6 Months Ago 12 Months Ago 3 Years Ago 5 Years Ago January 2005 Victoria REB – Con Victoria – Con Victoria West – Con Oak Bay – Con Esquimalt – Con View Royal – Con Saanich East – Con Saanich West – Con Sooke – Con Langford – Con Colwood – Con North Saanich – Con Sidney – Con Central Saanich – Con 424.5 423.7 417.9 415.6 414.7 409.3 404.2 403.9 403.7 399.2 391.0 388.2 382.7 377.1 375.7 375.0 372.7 365.6 364.4 364.3 359.9 358.2 357.7 357.2 357.1 356.2 354.3 353.9 351.2 349.5 349.0 347.0 344.6 343.4 342.4 340.9 340.2 340.2 337.6 336.9 336.4 336.2 335.4 333.1 332.3 328.6 328.5 324.6 323.5 321.9 321.8 320.9 320.5 318.5 316.9 312.7 310.5 306.1 303.4 301.4 300.1 298.7 295.4 293.4 292.3 287.1 285.8 283.9 282.0 280.0 279.2 271.7 268.2 265.6 265.1 264.9 264.2 264.0 264.0 261.6 261.3 253.0 250.7 247.8 242.8 242.7 242.4 241.8 239.7 236.2 233.6 231.6 226.4 225.3 224.0 216.7 204.9 192.1 100.0 100.0 100.0 100.0 100.0 100.0 100.0 100.0 100.0 100.0 100.0 100.0 100.0 100.0 HPI by Timeframe and Property Type Value or percent change Value Percent change HPI or Benchmark Price HPI Benchmark Price 1. Area Group VREB District Summary 3. Area/Property Type Selection All 2. Property Type – Condo Apartment (Con)
  • 10. Note: Areas with insufficient sales are not included in the HPI. Source: Victoria Real Estate Board April 2023 1 Month Ago 3 Months Ago 6 Months Ago 12 Months Ago 3 Years Ago 5 Years Ago January 2005 Victoria REB – Twn Victoria – Twn Victoria West – Twn Esquimalt – Twn View Royal – Twn Saanich East – Twn Saanich West – Twn Sooke – Twn Langford – Twn Colwood – Twn Sidney – Twn Central Saanich – Twn ML Malahat Area – Twn GI Gulf Islands – Twn $921,600 $920,300 $918,700 $910,300 $899,000 $890,200 $885,200 $882,900 $881,200 $874,400 $858,300 $855,300 $855,300 $847,200 $841,600 $834,100 $821,400 $816,000 $815,200 $808,800 $802,500 $802,500 $801,400 $800,300 $794,500 $790,500 $790,200 $785,100 $781,500 $781,200 $778,200 $775,000 $773,500 $773,200 $766,200 $765,400 $763,800 $762,500 $757,300 $753,200 $749,700 $749,300 $749,300 $748,300 $745,800 $740,600 $735,700 $735,200 $733,700 $732,100 $721,400 $719,700 $715,100 $715,000 $712,100 $711,800 $709,200 $703,100 $700,200 $697,400 $694,700 $691,600 $691,600 $689,600 $687,500 $681,000 $673,600 $668,700 $665,800 $646,400 $646,400 $645,300 $642,600 $632,800 $616,200 $575,700 $567,000 $565,600 $563,700 $558,200 $557,500 $545,900 $539,100 $532,500 $524,000 $523,600 $522,700 $518,500 $483,600 $478,600 $475,600 $471,900 $471,500 $466,700 $455,200 $434,300 $434,200 $421,900 $321,500 $295,200 $288,500 $258,200 $254,800 $245,700 $244,300 $240,700 $232,300 $221,100 $219,500 $213,400 $212,000 $201,100 Benchmark Price by Timeframe and Property Type Value or percent change Value Percent change HPI or Benchmark Price HPI Benchmark Price 1. Area Group VREB District Summary 3. Area/Property Type Selection All 2. Property Type – Townhouse (Twn)
  • 11. Note: Areas with insufficient sales are not included in the HPI. Source: Victoria Real Estate Board April 2023 1 Month Ago 3 Months Ago 6 Months Ago 12 Months Ago 3 Years Ago 5 Years Ago January 2005 Victoria REB – Twn Victoria – Twn Victoria West – Twn Esquimalt – Twn View Royal – Twn Saanich East – Twn Saanich West – Twn Sooke – Twn Langford – Twn Colwood – Twn Sidney – Twn Central Saanich – Twn ML Malahat Area – Twn GI Gulf Islands – Twn 414.7 405.6 403.3 386.0 382.0 376.6 374.2 372.8 372.6 362.3 357.3 354.0 349.8 349.3 348.1 345.5 344.5 343.1 335.1 334.5 330.3 329.2 327.6 326.2 326.2 325.3 323.6 323.4 322.1 320.3 318.1 317.9 316.7 316.5 315.4 312.6 311.8 311.2 310.8 310.8 309.8 305.3 304.2 304.1 302.4 300.7 300.4 296.2 294.5 294.1 293.2 292.1 291.7 290.8 290.0 289.8 287.3 286.7 285.6 282.6 279.6 275.4 274.6 274.1 273.9 269.7 268.6 266.0 262.9 262.3 254.3 250.1 245.5 234.7 231.5 230.8 228.1 225.5 223.5 223.2 220.9 219.4 219.1 218.6 218.3 216.0 214.7 211.1 206.2 205.1 204.7 199.9 198.8 193.2 191.7 190.8 181.5 180.4 100.0 100.0 100.0 100.0 100.0 100.0 100.0 100.0 100.0 100.0 100.0 100.0 100.0 100.0 HPI by Timeframe and Property Type Value or percent change Value Percent change HPI or Benchmark Price HPI Benchmark Price 1. Area Group VREB District Summary 3. Area/Property Type Selection All 2. Property Type – Townhouse (Twn)
  • 12. Note: Areas with insufficient sales are not included in the HPI. Source: Victoria Real Estate Board Victoria REB – SF-All Core – SF-All Westshore – SF-All Peninsula – SF-All Select Date Range: All values Jan 2003 Jan 2005 Jan 2007 Jan 2009 Jan 2011 Jan 2013 Jan 2015 Jan 2017 Jan 2019 Jan 2021 Jan 2023 Benchmark Price ($) 200,000 400,000 600,000 800,000 1,000,000 1,200,000 1,400,000 Benchmark Price Performance over Time 1. Area Group VREB Area Summary 3. Area/Property Type Selection Multiple values 2. Property Type – Single Family-All (SF-All) HPI or Benchmark Price HPI Benchmark Price Adding labels Hold Ctrl (Cmd) and select points on the chart to show multiple date/value labels
  • 13. Note: Areas with insufficient sales are not included in the HPI. Source: Victoria Real Estate Board Victoria REB – Con Core – Con Westshore – Con Peninsula – Con Select Date Range: All values Jan 2003 Jan 2005 Jan 2007 Jan 2009 Jan 2011 Jan 2013 Jan 2015 Jan 2017 Jan 2019 Jan 2021 Jan 2023 Benchmark Price ($) 100,000 200,000 300,000 400,000 500,000 600,000 Benchmark Price Performance over Time 1. Area Group VREB Area Summary 3. Area/Property Type Selection All 2. Property Type – Condo Apartment (Con) HPI or Benchmark Price HPI Benchmark Price Adding labels Hold Ctrl (Cmd) and select points on the chart to show multiple date/value labels
  • 14. Note: Areas with insufficient sales are not included in the HPI. Source: Victoria Real Estate Board Victoria REB – Twn Core – Twn Westshore – Twn Peninsula – Twn Select Date Range: All values Jan 2003 Jan 2005 Jan 2007 Jan 2009 Jan 2011 Jan 2013 Jan 2015 Jan 2017 Jan 2019 Jan 2021 Jan 2023 Benchmark Price ($) 200,000 300,000 400,000 500,000 600,000 700,000 800,000 900,000 Benchmark Price Performance over Time 1. Area Group VREB Area Summary 3. Area/Property Type Selection Multiple values 2. Property Type – Townhouse (Twn) HPI or Benchmark Price HPI Benchmark Price Adding labels Hold Ctrl (Cmd) and select points on the chart to show multiple date/value labels
  • 15. Note: Areas with insufficient sales are not included in the HPI. Source: Victoria Real Estate Board Victoria REB – SF-All Victoria REB – Twn Victoria REB – Con Select Date Range: All values Jan 2003 Jan 2005 Jan 2007 Jan 2009 Jan 2011 Jan 2013 Jan 2015 Jan 2017 Jan 2019 Jan 2021 Jan 2023 Benchmark Price ($) 200,000 400,000 600,000 800,000 1,000,000 1,200,000 Benchmark Price Performance over Time 1. Area Group VREB Area Summary 3. Area/Property Type Selection Multiple values 2. Property Type Multiple values HPI or Benchmark Price HPI Benchmark Price Adding labels Hold Ctrl (Cmd) and select points on the chart to show multiple date/value labels
  • 16. Monthly Sales Summary (Mark I) Residential Waterfront Properties Integrated Into Their Own Districts Units Total Volume April 2023 District Produced: 01-May-2023 Residential Single Family Detached l Greater Victoria Victoria / Victoria West 38 $49,747,049 Oak Bay 26 $50,494,600 Esquimalt 9 $10,224,261 View Royal 10 $11,690,500 Saanich East 58 $80,172,650 Saanich West 29 $35,353,217 Central Saanich 8 $13,805,301 North Saanich 10 $15,131,900 Sidney 9 $9,767,400 Highlands 2 $2,615,000 Colwood 19 $24,150,900 Langford 41 $46,995,594 Metchosin 3 $3,135,000 Sooke 25 $22,565,150 Gulf Islands 30 $33,524,834 Total Greater Victoria 317 $409,373,356 Other Areas Malahat Area 8 $9,274,000 Total Other Areas 8 $9,274,000 Total Single Family Detached 325 $418,647,356 Condo Apartment l Greater Victoria Victoria / Victoria West 77 $47,944,159 Oak Bay 6 $8,458,000 Esquimalt 12 $7,420,700 View Royal 8 $4,453,299 Saanich East 31 $19,081,900 Saanich West 9 $3,855,000 Central Saanich 4 $2,553,000 Sidney 10 $6,408,000 Colwood 5 $2,596,900 Langford 39 $22,365,818 Sooke 2 $740,000 Gulf Islands 1 $485,000 Total Greater Victoria 204 $126,361,776 Other Areas UpIsland / Mainland 1 $862,500 Total Other Areas 1 $862,500 Total Condo Apartment 205 $127,224,276 Page 1 of 3 Victoria Real Estate Board Multiple Listing Service ®
  • 17. Monthly Sales Summary (Mark I) Residential Waterfront Properties Integrated Into Their Own Districts Units Total Volume April 2023 District Produced: 01-May-2023 Row/Townhouse l Greater Victoria Victoria / Victoria West 20 $15,952,600 Esquimalt 4 $2,850,500 View Royal 3 $2,268,500 Saanich East 8 $7,631,000 Saanich West 5 $4,548,000 Central Saanich 2 $1,589,000 North Saanich 1 $950,000 Sidney 10 $7,393,500 Colwood 4 $2,806,000 Langford 24 $17,963,693 Sooke 1 $500,000 Total Greater Victoria 82 $64,452,793 Total Row/Townhouse 82 $64,452,793 Manufactured Home l Greater Victoria View Royal 3 $840,000 Central Saanich 3 $1,085,000 Sidney 2 $995,000 Gulf Islands 1 $250,000 Total Greater Victoria 9 $3,170,000 Total Manufactured Home 9 $3,170,000 Total Residential 621 $613,494,425 Page 2 of 3 Victoria Real Estate Board Multiple Listing Service ®
  • 18. Monthly Sales Summary (Mark I) Residential Waterfront Properties Integrated Into Their Own Districts Units Total Volume April 2023 District Produced: 01-May-2023 $626,130,955 637 Grand Totals Other Property Lots Acreage l Greater Victoria Victoria / Victoria West 1 $828,920 Saanich East 1 $935,000 Sooke 3 $1,700,000 Gulf Islands 1 $595,000 Total Greater Victoria 6 $4,058,920 Other Areas Malahat Area 1 $550,000 Total Other Areas 1 $550,000 Total Lots Acreage 7 $4,608,920 9 $8,027,610 Other Commercial Properties l Page 3 of 3 Victoria Real Estate Board Multiple Listing Service ®
  • 19. Monthly Sales Summary (Mark II) Waterfront Properties Segregated Into a 'Waterfront' District Units Total Volume April 2023 District Produced: 01-May-2023 Residential Single Family Detached l Greater Victoria Victoria 36 $47,821,549 Victoria West 2 $1,925,500 Oak Bay 26 $50,494,600 Esquimalt 9 $10,224,261 View Royal 10 $11,690,500 Saanich East 58 $80,172,650 Saanich West 28 $33,783,217 Central Saanich 8 $13,805,301 North Saanich 10 $15,131,900 Sidney 9 $9,767,400 Highlands 2 $2,615,000 Colwood 19 $24,150,900 Langford 41 $46,995,594 Metchosin 3 $3,135,000 Sooke 22 $18,720,250 Gulf Islands 25 $28,689,834 Waterfront (all districts) 9 $10,249,900 Total Greater Victoria 317 $409,373,356 Other Areas Malahat Area 7 $7,749,000 Waterfront (all districts) 1 $1,525,000 Total Other Areas 8 $9,274,000 Total Single Family Detached 325 $418,647,356 Condo Apartment l Greater Victoria Victoria 62 $36,166,759 Victoria West 9 $5,967,900 Oak Bay 5 $7,679,000 Esquimalt 11 $5,420,700 View Royal 8 $4,453,299 Saanich East 30 $17,921,900 Saanich West 8 $3,356,000 Central Saanich 2 $1,085,000 Sidney 8 $5,253,000 Colwood 5 $2,596,900 Langford 39 $22,365,818 Gulf Islands 1 $485,000 Waterfront (all districts) 16 $13,610,500 Total Greater Victoria 204 $126,361,776 Other Areas UpIsland / Mainland 1 $862,500 Total Other Areas 1 $862,500 Total Condo Apartment 205 $127,224,276 Page 1 of 3 Victoria Real Estate Board Multiple Listing Service ®
  • 20. Monthly Sales Summary (Mark II) Waterfront Properties Segregated Into a 'Waterfront' District Units Total Volume April 2023 District Produced: 01-May-2023 Row/Townhouse l Greater Victoria Victoria 16 $12,797,600 Victoria West 2 $1,680,000 Esquimalt 4 $2,850,500 View Royal 2 $1,508,500 Saanich East 8 $7,631,000 Saanich West 5 $4,548,000 Central Saanich 2 $1,589,000 North Saanich 1 $950,000 Sidney 10 $7,393,500 Colwood 4 $2,806,000 Langford 24 $17,963,693 Sooke 1 $500,000 Waterfront (all districts) 3 $2,235,000 Total Greater Victoria 82 $64,452,793 Total Row/Townhouse 82 $64,452,793 Manufactured Home l Greater Victoria View Royal 3 $840,000 Central Saanich 3 $1,085,000 Sidney 2 $995,000 Gulf Islands 1 $250,000 Total Greater Victoria 9 $3,170,000 Total Manufactured Home 9 $3,170,000 Total Residential 621 $613,494,425 Page 2 of 3 Victoria Real Estate Board Multiple Listing Service ®
  • 21. Monthly Sales Summary (Mark II) Waterfront Properties Segregated Into a 'Waterfront' District Units Total Volume April 2023 District Produced: 01-May-2023 $626,130,955 637 Grand Totals Other Property Lots Acreage l Greater Victoria Victoria / Victoria West 1 $828,920 Saanich East 1 $935,000 Sooke 3 $1,700,000 Gulf Islands 1 $595,000 Total Greater Victoria 6 $4,058,920 Other Areas Malahat Area 1 $550,000 Total Other Areas 1 $550,000 Total Lots Acreage 7 $4,608,920 9 $8,027,610 Other Commercial Properties l Page 3 of 3 Victoria Real Estate Board Multiple Listing Service ®
  • 22. Sales to Active Listings Ratio The ratio of counts of total residential sales over total active residential listings for the last 25 months April 2023 Produced: 01-May-2023 10% 20% 30% 40% 50% 60% 70% 80% 90% 100% 110% 120% Apr 2021 May 2021 Jun 2021 Jul 2021 Aug 2021 Sep 2021 Oct 2021 Nov 2021 Dec 2021 Jan 2022 Feb 2022 Mar 2022 Apr 2022 May 2022 Jun 2022 Jul 2022 Aug 2022 Sep 2022 Oct 2022 Nov 2022 Dec 2022 Jan 2023 Feb 2023 Mar 2023 Apr 2023 The Sales to Active Listings Ratio This chart tracks the ratio of total residential sales over total active residential listings at month-end for each of the last 25 months. The active listing count and the sales count can be viewed as indicators of housing supply and demand respectively. Observing the ratio between them can thus help indicate a buyers' market, where there is sustained downward pressure on prices, and a sellers' market, where there is sustained upward pressure on prices. Based on a regression analysis performed by the Economics Department of the BC Real Estate Association in each market area of the province, the Sales to Active Listings Ratio for Victoria can be interpreted as follows: - below 14%, there is downward pressure on prices (buyers' market) - above 20%, there is upward pressure on prices (sellers' market) - in the 14-20% range, there is little pressure on prices either way (balanced market) Victoria Real Estate Board Multiple Listing Service ® Page 1 of 1
  • 23. Monthly Comparative Activity By Property Type Includes All MLS® Property Types April 2023 Current Month This Year % Change Last Year Year To Date This Year % Change Last Year Produced: 01-May-2023 Single Family - Residential Units Listed 368 Units Sold 256 Sell/List Ratio 70 Sales Dollars $329,988,522 Average Price / Unit $1,289,018 Price Ratio 99 Days To Sell 33 Active Listings at Month End 566 % % 556 325 58 $445,500,476 $1,370,771 103 14 417 % % -34 -21 -26 -6 146 36 % % % % % % 1308 746 57 $917,446,413 $1,229,821 98 38 % % 1575 1052 67 $1,453,632,785 $1,381,780 106 13 % % -17 -29 -37 -11 200 % % % % % Single Family - Residential Waterfront Units Listed 49 Units Sold 6 Sell/List Ratio 12 Sales Dollars $10,507,500 Average Price / Unit $1,751,250 Price Ratio 96 Days To Sell 90 Active Listings at Month End 124 % % 46 23 50 $60,544,525 $2,632,371 99 20 76 % % 7 -74 -83 -33 348 63 % % % % % % 133 33 25 $76,369,500 $2,314,227 93 70 % % 124 62 50 $162,827,977 $2,626,258 99 39 % % 7 -47 -53 -12 82 % % % % % Single Family - Residential Acreage Units Listed 58 Units Sold 33 Sell/List Ratio 57 Sales Dollars $49,474,734 Average Price / Unit $1,499,234 Price Ratio 95 Days To Sell 62 Active Listings at Month End 117 % % 50 25 50 $41,769,899 $1,670,796 100 30 64 % % 16 32 18 -10 109 83 % % % % % % 191 85 45 $121,325,634 $1,427,360 95 65 % % 146 82 56 $133,374,499 $1,626,518 100 30 % % 31 4 -9 -12 115 % % % % % Condo Apartment Units Listed 298 Units Sold 205 Sell/List Ratio 69 Sales Dollars $127,224,276 Average Price / Unit $620,606 Price Ratio 98 Days To Sell 32 Active Listings at Month End 480 % % 386 262 68 $174,683,990 $666,733 103 13 285 % % -23 -22 -27 -7 159 68 % % % % % % 1151 664 58 $405,483,279 $610,668 98 35 % % 1286 996 77 $672,053,907 $674,753 104 15 % % -10 -33 -40 -9 124 % % % % % Page 1 of 8 Victoria Real Estate Board Multiple Listing Service ®
  • 24. Monthly Comparative Activity By Property Type Includes All MLS® Property Types April 2023 Current Month This Year % Change Last Year Year To Date This Year % Change Last Year Produced: 01-May-2023 Row/Townhouse Units Listed 103 Units Sold 82 Sell/List Ratio 80 Sales Dollars $64,452,793 Average Price / Unit $786,010 Price Ratio 99 Days To Sell 38 Active Listings at Month End 154 % % 132 101 77 $95,419,582 $944,748 106 10 83 % % -22 -19 -32 -17 289 86 % % % % % % 390 231 59 $176,329,934 $763,333 99 38 % % 421 328 78 $297,070,610 $905,703 106 16 % % -7 -30 -41 -16 141 % % % % % Half Duplex (Up and Down) Units Listed 1 Units Sold 1 Sell/List Ratio 100 Sales Dollars $1,485,000 Average Price / Unit $1,485,000 Price Ratio 99 Days To Sell 13 Active Listings at Month End 2 % % 3 2 67 $2,677,000 $1,338,500 96 25 3 % % -67 -50 -45 11 -47 -33 % % % % % % 5 2 40 $2,100,000 $1,050,000 100 16 % % 6 4 67 $5,301,000 $1,325,250 95 121 % % -17 -50 -60 -21 -87 % % % % % Half Duplex (Side by Side) Units Listed 30 Units Sold 17 Sell/List Ratio 57 Sales Dollars $14,081,800 Average Price / Unit $828,341 Price Ratio 99 Days To Sell 23 Active Listings at Month End 42 % % 38 17 45 $15,702,400 $923,671 105 9 34 % % -21 0 -10 -10 142 24 % % % % % % 89 57 64 $49,712,338 $872,146 100 29 % % 110 68 62 $62,343,299 $916,813 107 12 % % -19 -16 -20 -5 134 % % % % % Half Duplex (Front and Back) Units Listed 4 Units Sold 2 Sell/List Ratio 50 Sales Dollars $1,766,400 Average Price / Unit $883,200 Price Ratio 98 Days To Sell 65 Active Listings at Month End 4 % % 7 4 57 $3,783,800 $945,950 97 29 4 % % -43 -50 -53 -7 121 0 % % % % % % 11 7 64 $6,470,500 $924,357 99 34 % % 18 7 39 $6,319,800 $902,829 103 20 % % -39 0 2 2 67 % % % % % Page 2 of 8 Victoria Real Estate Board Multiple Listing Service ®
  • 25. Monthly Comparative Activity By Property Type Includes All MLS® Property Types April 2023 Current Month This Year % Change Last Year Year To Date This Year % Change Last Year Produced: 01-May-2023 Recreational Units Listed 3 Units Sold 4 Sell/List Ratio 133 Sales Dollars $1,267,400 Average Price / Unit $316,850 Price Ratio 93 Days To Sell 55 Active Listings at Month End 9 % % 5 2 40 $648,000 $324,000 100 22 11 % % -40 100 96 -2 153 -18 % % % % % % 11 6 55 $1,624,900 $270,817 93 52 % % 15 9 60 $2,691,250 $299,028 96 55 % % -27 -33 -40 -9 -6 % % % % % Manufactured Home Units Listed 23 Units Sold 9 Sell/List Ratio 39 Sales Dollars $3,170,000 Average Price / Unit $352,222 Price Ratio 97 Days To Sell 33 Active Listings at Month End 41 % % 30 15 50 $5,333,528 $355,569 101 27 43 % % -23 -40 -41 -1 24 -5 % % % % % % 70 39 56 $13,439,500 $344,603 96 57 % % 94 59 63 $20,213,629 $342,604 100 31 % % -26 -34 -34 1 83 % % % % % Residential Lots Units Listed 20 Units Sold 3 Sell/List Ratio 15 Sales Dollars $2,188,920 Average Price / Unit $729,640 Price Ratio 97 Days To Sell 36 Active Listings at Month End 95 % % 35 12 34 $7,201,700 $600,142 99 14 53 % % -43 -75 -70 22 158 79 % % % % % % 99 14 14 $9,315,920 $665,423 96 88 % % 106 56 53 $32,097,746 $573,174 99 26 % % -7 -75 -71 16 246 % % % % % Residential Lots - Waterfront Units Listed 2 Units Sold 0 Sell/List Ratio Sales Dollars $0 Average Price / Unit Price Ratio Days To Sell Active Listings at Month End 13 % % 6 2 33 $2,032,500 $1,016,250 95 57 11 % % -67 -100 -100 18 % % % % % % 8 1 13 $1,250,000 $1,250,000 93 21 % % 16 4 25 $3,665,500 $916,375 101 27 % % -50 -75 -66 36 -22 % % % % % Page 3 of 8 Victoria Real Estate Board Multiple Listing Service ®
  • 26. Monthly Comparative Activity By Property Type Includes All MLS® Property Types April 2023 Current Month This Year % Change Last Year Year To Date This Year % Change Last Year Produced: 01-May-2023 Residential Acreage Units Listed 10 Units Sold 3 Sell/List Ratio 30 Sales Dollars $1,670,000 Average Price / Unit $556,667 Price Ratio 97 Days To Sell 29 Active Listings at Month End 51 % % 12 10 83 $10,816,400 $1,081,640 87 70 34 % % -17 -70 -85 -49 -58 50 % % % % % % 36 9 25 $6,456,000 $717,333 98 89 % % 44 26 59 $23,055,800 $886,762 94 87 % % -18 -65 -72 -19 2 % % % % % Residential Acreage - Waterfront Units Listed 5 Units Sold 1 Sell/List Ratio 20 Sales Dollars $750,000 Average Price / Unit $750,000 Price Ratio 77 Days To Sell 440 Active Listings at Month End 27 % % 3 0 $0 5 % % 67 440 % % % % % % 14 2 14 $3,500,000 $1,750,000 88 249 % % 7 3 43 $2,014,000 $671,333 96 134 % % 100 -33 74 161 86 % % % % % Revenue - Duplex/Triplex Units Listed 8 Units Sold 6 Sell/List Ratio 75 Sales Dollars $10,076,000 Average Price / Unit $1,679,333 Price Ratio 98 Days To Sell 31 Active Listings at Month End 9 % % 9 6 67 $7,695,000 $1,282,500 102 11 14 % % -11 0 31 31 173 -36 % % % % % % 21 10 48 $15,972,000 $1,597,200 96 40 % % 35 20 57 $27,846,000 $1,392,300 105 12 % % -40 -50 -43 15 242 % % % % % Revenue - Multi Units Units Listed 3 Units Sold 2 Sell/List Ratio 67 Sales Dollars $3,847,500 Average Price / Unit $1,923,750 Price Ratio 96 Days To Sell 51 Active Listings at Month End 15 % % 9 3 33 $4,350,000 $1,450,000 100 24 19 % % -67 -33 -12 33 113 -21 % % % % % % 16 7 44 $10,077,500 $1,439,643 95 86 % % 36 10 28 $14,372,000 $1,437,200 102 50 % % -56 -30 -30 0 72 % % % % % Page 4 of 8 Victoria Real Estate Board Multiple Listing Service ®
  • 27. Monthly Comparative Activity By Property Type Includes All MLS® Property Types April 2023 Current Month This Year % Change Last Year Year To Date This Year % Change Last Year Produced: 01-May-2023 Revenue - Apartment Block Units Listed 0 Units Sold 0 Sell/List Ratio Sales Dollars $0 Average Price / Unit Price Ratio Days To Sell Active Listings at Month End 0 % % 0 0 $0 0 % % % % % % % % 0 0 $0 % % 0 0 $0 % % % % % % % Revenue - Commercial Units Listed 13 Units Sold 1 Sell/List Ratio 8 Sales Dollars $4,125,000 Average Price / Unit $4,125,000 Price Ratio 92 Days To Sell 72 Active Listings at Month End 47 % % 7 5 71 $9,513,900 $1,902,780 95 73 23 % % 86 -80 -57 117 -2 104 % % % % % % 47 10 21 $9,354,180 $935,418 93 62 % % 29 18 62 $30,201,112 $1,677,840 97 58 % % 62 -44 -69 -44 7 % % % % % Revenue - Industrial Units Listed 1 Units Sold 0 Sell/List Ratio Sales Dollars $0 Average Price / Unit Price Ratio Days To Sell Active Listings at Month End 19 % % 1 1 100 $925,000 $925,000 103 41 8 % % 0 -100 -100 138 % % % % % % 13 3 23 $3,175,000 $1,058,333 96 151 % % 15 15 100 $12,058,600 $803,907 100 36 % % -13 -80 -74 32 324 % % % % % Business with Land Building Units Listed 1 Units Sold 0 Sell/List Ratio Sales Dollars $0 Average Price / Unit Price Ratio Days To Sell Active Listings at Month End 4 % % 1 0 $0 6 % % 0 -33 % % % % % % 3 0 0 $0 % % 4 0 0 $0 % % -25 % % % % % Page 5 of 8 Victoria Real Estate Board Multiple Listing Service ®
  • 28. Monthly Comparative Activity By Property Type Includes All MLS® Property Types April 2023 Current Month This Year % Change Last Year Year To Date This Year % Change Last Year Produced: 01-May-2023 Business Only Units Listed 9 Units Sold 1 Sell/List Ratio 11 Sales Dollars $55,000 Average Price / Unit $55,000 Price Ratio 73 Days To Sell 44 Active Listings at Month End 64 % % 12 2 17 $235,000 $117,500 78 272 58 % % -25 -50 -77 -53 -84 10 % % % % % % 46 13 28 $1,813,000 $139,462 85 122 % % 42 6 14 $1,040,000 $173,333 87 145 % % 10 117 74 -20 -16 % % % % % Motel/Hotel Units Listed 0 Units Sold 0 Sell/List Ratio Sales Dollars $0 Average Price / Unit Price Ratio Days To Sell Active Listings at Month End 0 % % 0 0 $0 0 % % % % % % % % 0 0 $0 % % 0 0 $0 % % % % % % % Lease - Office Units Listed 4 Units Sold 1 Sell/List Ratio 25 Sales Dollars $22 Average Price / Unit $22 Price Ratio 122 Days To Sell 101 Active Listings at Month End 71 % % 11 1 9 $17 $17 100 30 51 % % -64 0 29 29 237 39 % % % % % % 42 14 33 $4,164 $297 99 102 % % 37 9 24 $70,053 $7,784 45039 82 % % 14 56 -94 -96 24 % % % % % Lease - Retail Units Listed 14 Units Sold 2 Sell/List Ratio 14 Sales Dollars $57 Average Price / Unit $29 Price Ratio 99 Days To Sell 195 Active Listings at Month End 52 % % 5 4 80 $90 $22 101 99 37 % % 180 -50 -36 27 98 41 % % % % % % 34 6 18 $153 $26 99 159 % % 26 10 38 $245 $24 98 94 % % 31 -40 -38 4 70 % % % % % Page 6 of 8 Victoria Real Estate Board Multiple Listing Service ®
  • 29. Monthly Comparative Activity By Property Type Includes All MLS® Property Types April 2023 Current Month This Year % Change Last Year Year To Date This Year % Change Last Year Produced: 01-May-2023 Lease - Warehouse Units Listed 0 Units Sold 0 Sell/List Ratio Sales Dollars $0 Average Price / Unit Price Ratio Days To Sell Active Listings at Month End 0 % % 0 0 $0 0 % % % % % % % % 0 0 $0 % % 0 0 $0 % % % % % % % Lease - Industrial Units Listed 4 Units Sold 1 Sell/List Ratio 25 Sales Dollars $18 Average Price / Unit $18 Price Ratio 100 Days To Sell 70 Active Listings at Month End 21 % % 1 2 200 $38 $19 96 78 2 % % 300 -50 -53 -6 -10 950 % % % % % % 22 5 23 $99 $20 4 58 % % 3 2 67 $38 $19 96 78 % % 633 150 159 3 -25 % % % % % Lease - Other Units Listed 0 Units Sold 1 Sell/List Ratio Sales Dollars $13 Average Price / Unit $13 Price Ratio 100 Days To Sell 80 Active Listings at Month End 2 % % 0 0 $0 3 % % -33 % % % % % % 3 1 33 $13 $13 100 80 % % 0 1 $23 $23 100 157 % % 0 -46 -46 -49 % % % % % Commercial Land Units Listed 5 Units Sold 0 Sell/List Ratio Sales Dollars $0 Average Price / Unit Price Ratio Days To Sell Active Listings at Month End 14 % % 3 0 $0 21 % % 67 -33 % % % % % % 7 0 0 $0 % % 14 2 14 $18,025,000 $9,012,500 99 131 % % -50 -100 -100 % % % % % Page 7 of 8 Victoria Real Estate Board Multiple Listing Service ®
  • 30. Monthly Comparative Activity By Property Type Includes All MLS® Property Types April 2023 Current Month This Year % Change Last Year Year To Date This Year % Change Last Year Produced: 01-May-2023 Units Listed 1036 Units Sold 637 Sell/List Ratio 61 Sales Dollars $626,130,955 Average Price / Unit $982,937 Price Ratio 98 Days To Sell 37 Active Listings at Month End 2043 % % Grand Totals 1368 824 60 $888,832,845 $1,078,681 103 16 1365 % % -24 -23 -30 -9 130 50 % % % % % % 3770 1965 52 $1,831,220,027 $931,919 98 42 % % 4209 2849 68 $2,980,274,873 $1,046,078 104 18 % % -10 -31 -39 -11 126 % % % % % Page 8 of 8 Victoria Real Estate Board Multiple Listing Service ®