
Recommended
More Related Content
Similar to Victoria housing market shows signs of growth as spring sales rise
Similar to Victoria housing market shows signs of growth as spring sales rise (20)
More from VickyAulakh1
More from VickyAulakh1 (20)
Recently uploaded
Recently uploaded (20)
Victoria housing market shows signs of growth as spring sales rise
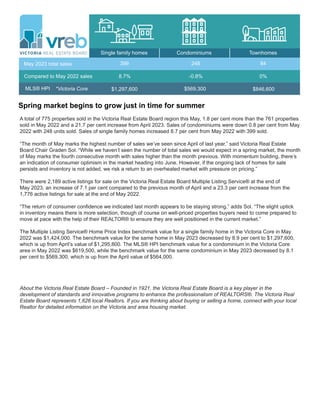
- 1. Spring market begins to grow just in time for summer A total of 775 properties sold in the Victoria Real Estate Board region this May, 1.8 per cent more than the 761 properties sold in May 2022 and a 21.7 per cent increase from April 2023. Sales of condominiums were down 0.8 per cent from May 2022 with 248 units sold. Sales of single family homes increased 8.7 per cent from May 2022 with 399 sold. “The month of May marks the highest number of sales we’ve seen since April of last year,” said Victoria Real Estate Board Chair Graden Sol. “While we haven’t seen the number of total sales we would expect in a spring market, the month of May marks the fourth consecutive month with sales higher than the month previous. With momentum building, there’s an indication of consumer optimism in the market heading into June. However, if the ongoing lack of homes for sale persists and inventory is not added, we risk a return to an overheated market with pressure on pricing.” There were 2,189 active listings for sale on the Victoria Real Estate Board Multiple Listing Service® at the end of May 2023, an increase of 7.1 per cent compared to the previous month of April and a 23.3 per cent increase from the 1,776 active listings for sale at the end of May 2022. “The return of consumer confidence we indicated last month appears to be staying strong,” adds Sol. “The slight uptick in inventory means there is more selection, though of course on well-priced properties buyers need to come prepared to move at pace with the help of their REALTOR® to ensure they are well positioned in the current market.” The Multiple Listing Service® Home Price Index benchmark value for a single family home in the Victoria Core in May 2022 was $1,424,000. The benchmark value for the same home in May 2023 decreased by 8.9 per cent to $1,297,600, which is up from April’s value of $1,295,800. The MLS® HPI benchmark value for a condominium in the Victoria Core area in May 2022 was $619,500, while the benchmark value for the same condominium in May 2023 decreased by 8.1 per cent to $569,300, which is up from the April value of $564,000. About the Victoria Real Estate Board – Founded in 1921, the Victoria Real Estate Board is a key player in the development of standards and innovative programs to enhance the professionalism of REALTORS®. The Victoria Real Estate Board represents 1,626 local Realtors. If you are thinking about buying or selling a home, connect with your local Realtor for detailed information on the Victoria and area housing market. Single family homes Condominiums Townhomes May 2023 total sales Compared to May 2022 sales MLS® HPI 399 $1,297,600 248 8.7% -0.8% 84 0% $569,300 $846,600 *Victoria Core
- 2. Sales by Property Type Single Family Greater Victoria Single Family Other Areas Single Family Total All Areas Condo Apartment Row/Townhouse Manufactured Home Total Residential Total Sales Active Listings Units Median$ Average$ LY% LM% LY% LM% LY% LM% Units Median$ Average$ Units Median$ Average$ May 2023 381 248 84 17 748 399 775 18 2,189 317 205 82 9 621 325 637 8 2,043 351 250 84 23 724 367 761 16 1,776 $1,304,225 $674,732 $853,470 $304,635 $1,297,552 $1,156,300 $1,174,950 $560,000 $785,000 $294,900 $1,172,353 $1,013,250 $1,291,399 $620,606 $786,010 $352,222 $1,288,146 $1,159,250 $1,195,000 $540,000 $739,540 $320,000 $1,195,000 $1,060,000 $1,404,944 $655,518 $850,224 $468,448 $1,396,076 $1,201,531 $1,250,000 $598,000 $800,000 $393,000 $1,240,000 $1,032,500 20.2% 21.0% 2.4% 88.9% 20.5% 22.8% 21.7% 125.0% 7.1% 8.5% -0.8% 0.0% -26.1% 3.3% 8.7% 1.8% 12.5% 23.3% 1.0% 8.7% 8.6% -13.5% 0.7% -0.3% -7.2% 2.9% 0.4% -35.0% -7.1% -3.8% -1.7% 3.7% 6.1% -7.8% -1.9% -4.4% -6.0% -6.4% -1.9% -25.0% -5.5% -1.9% April 2023 May 2022 Legend Units: net number of listings sold LM%: percentage change since Last Month LY%: percentage change since This Month Last Year Average$: average selling price Median$: median selling price Total Residential: includes sales of residential property types Total Sales: includes sales of all property types Active Listings: total listings of all types on the market at midnight on the last day of the month This Month Last Month Produced: 01-Jun-2023 May 2023 Previous Periods Comparison This Month Last Year Page 1 of 1 Victoria Real Estate Board Multiple Listing Service ® May 2023 Statistics Package for Media Victoria Real Estate Board May 2023 Statistics - page 2 Previous Periods Comparison of Unit Sales, Average Prices and Median Prices Previous Periods Comparison of MLS® HPI Benchmark Prices and MLS® HPI Index Values
- 3. 6DOHVWR$FWLYH/LVWLQJV5DWLR The ratio of counts of total residential sales over total active residential listings for the last 25 months 0D Produced: 01-Jun-2023 0D -XQ -XO $XJ 6HS 2FW 1RY 'HF -DQ )HE 0DU $SU 0D -XQ -XO $XJ 6HS 2FW 1RY 'HF -DQ )HE 0DU $SU 0D 7KH6DOHVWR$FWLYH/LVWLQJV5DWLR 7KLV FKDUWWUDFNVWKHUDWLRRIWRWDOUHVLGHQWLDOVDOHVRYHUWRWDODFWLYHUHVLGHQWLDOOLVWLQJVDWPRQWKHQGIRU HDFKRIWKHODVWPRQWKV 7KHDFWLYHOLVWLQJFRXQWDQGWKHVDOHVFRXQWFDQEHYLHZHGDVLQGLFDWRUVRIKRXVLQJVXSSODQG GHPDQGUHVSHFWLYHO2EVHUYLQJWKHUDWLREHWZHHQWKHPFDQWKXVKHOSLQGLFDWHDEXHUV PDUNHW ZKHUHWKHUHLVVXVWDLQHGGRZQZDUGSUHVVXUHRQSULFHVDQGDVHOOHUV PDUNHWZKHUHWKHUHLV VXVWDLQHGXSZDUGSUHVVXUHRQSULFHV %DVHGRQDUHJUHVVLRQDQDOVLVSHUIRUPHGEWKH(FRQRPLFV'HSDUWPHQWRIWKH%5HDO(VWDWH $VVRFLDWLRQLQHDFKPDUNHWDUHDRIWKHSURYLQFHWKH6DOHVWR$FWLYH/LVWLQJV5DWLRIRU9LFWRULDFDQEH LQWHUSUHWHGDVIROORZV EHORZWKHUHLVGRZQZDUGSUHVVXUHRQSULFHV EXHUV PDUNHW Sales to Active Listings Ratio This chart tracks the ratio of total residential sales over total active residential listings at month-end for each of the last 25 months. Based on a regression analysis performed by the economics department at the BC Real Estate Association in each market area of the province, the Sales to Active Listings Ratio for Victoria can be interpreted as follows: - below 14%, there is downward pressure on prices (buyers' market) - above 20%, there is upward pressure on prices (sellers' market) - in the 14-20% range, there is little pressure on prices either way (balanced market) Victoria Real Estate Board May 2023 Statistics - page 3 Total new MLS® listings and total MLS® sales for entire district
- 4. MLS® Home Price Index The Victoria Real Estate Board uses the MLS® Home Price Index (MLS® HPI) to report on market trends. The MLS® HPI uses the concept of a benchmark home, a notional home with common attributes of typical homes in a defined area. Through the analysis of over fifteen years of Victoria Real Estate Board MLS® sales data, the MLS® HPI defined benchmark homes for Victoria in each category (single family homes, townhouses, condos) and for each neighbourhood. The benchmark starting point was 2005, where each type of property and neighbourhood was assigned an index value of 100. JUNE 1 notice: MLS® Home Price Index reporting has been updated Please note that two changes have been made to the MLS® HPI reporting which mean that numbers previously published may not match the numbers in this and future reports. 1) All (including any historical) MLS® HPI data has been updated to reflect PENDING sales activity. 2) The provider of the reports (Altus Group) has rolled out updates based on their annual review. In line with statistical best practices, the MLS® HPI is reviewed to ensure all data and benchmark attributes are up-to-date and remain relevant over time. Updates are released each June. The updated data depicts the most accurate home prices and trends. To ensure HPI coverage is con- sistent and comparable, historical aggregate and composite data may have been recalculated based on revised and consistent coverage. Why MLS® HPI? Unlike average or median prices, which can fluctuate from one month to the next and potentially paint an inaccurate or even unhelpful picture of price values and trends, the MLS® HPI is based on the value home buyers assign to various housing attributes, like the age of the home and number of bedrooms. The evaluation of these attributes tends to evolve gradually over time, creating a more insightful analysis. Victoria Real Estate Board May 2023 Statistics - page 4
- 5. MLS® HPI benchmark and value - Condominium / Apartments Victoria Real Estate Board May 2023 Statistics - page 5 MLS® HPI benchmark and value - Single Family Homes
- 6. Note: Areas with insufficient sales are not included in the HPI. Source: Victoria Real Estate Board May 2023 1 Month Ago 3 Months Ago 6 Months Ago 12 Months Ago 3 Years Ago 5 Years Ago January 2005 Victoria REB – SF-All Victoria – SF-All Victoria West – SF-All Oak Bay – SF-All Esquimalt – SF-All View Royal – SF-All Saanich East – SF-All Saanich West – SF-All Sooke – SF-All Langford – SF-All Metchosin – SF-All Colwood – SF-All Highlands – SF-All North Saanich – SF-All Sidney – SF-All Central Saanich – SF-All ML Malahat Area – SF-All GI Gulf Islands – SF-All $998,300 $994,700 $994,500 $993,800 $993,500 $987,700 $985,100 $983,200 $982,500 $981,400 $980,100 $973,900 $969,400 $955,000 $943,300 $942,000 $940,400 $932,200 $916,400 $911,100 $905,500 $893,800 $887,600 $875,200 $868,000 $851,600 $851,500 $847,600 $839,800 $833,900 $826,100 $817,500 $811,100 $795,000 $794,900 $782,300 $776,800 $760,500 $759,600 $741,100 $740,000 $739,100 $734,400 $729,100 $724,200 $719,300 $718,600 $711,000 $707,900 $696,700 $695,900 $686,500 $592,900 $590,600 $574,500 $563,400 $560,600 $559,600 $472,500 $464,600 $459,900 $439,600 $414,300 $387,100 $369,200 $354,300 $341,300 $325,600 $320,700 $319,300 $310,400 $307,000 $293,900 $292,400 $288,100 $272,900 $1,936,300 $1,847,100 $1,798,400 $1,793,700 $1,780,500 $1,572,600 $1,561,800 $1,480,000 $1,465,900 $1,454,900 $1,454,100 $1,439,200 $1,438,300 $1,414,000 $1,411,600 $1,403,500 $1,394,700 $1,368,900 $1,365,600 $1,364,100 $1,346,500 $1,330,000 $1,314,400 $1,310,900 $1,310,300 $1,288,500 $1,277,200 $1,266,100 $1,247,900 $1,243,800 $1,241,200 $1,239,600 $1,198,200 $1,187,700 $1,187,200 $1,156,700 $1,156,600 $1,149,500 $1,149,400 $1,145,000 $1,142,300 $1,142,000 $1,122,500 $1,120,100 $1,115,300 $1,113,100 $1,106,200 $1,102,600 $1,077,200 $1,073,900 $1,069,800 $1,064,500 $1,053,200 $1,050,500 $1,047,200 $1,046,600 $1,043,100 $1,037,600 $1,035,200 $1,032,300 $1,023,800 $1,017,700 $1,016,800 $1,015,200 $1,014,500 $1,004,700 $1,001,800 $1,000,100 Benchmark Price by Timeframe and Property Type Value or percent change Value Percent change HPI or Benchmark Price HPI Benchmark Price 1. Area Group VREB District Summary 3. Area/Property Type Selection All 2. Property Type – Single Family-All (SF-All)
- 7. Note: Areas with insufficient sales are not included in the HPI. Source: Victoria Real Estate Board May 2023 1 Month Ago 3 Months Ago 6 Months Ago 12 Months Ago 3 Years Ago 5 Years Ago January 2005 Victoria REB – SF-All Victoria – SF-All Victoria West – SF-All Oak Bay – SF-All Esquimalt – SF-All View Royal – SF-All Saanich East – SF-All Saanich West – SF-All Sooke – SF-All Langford – SF-All Metchosin – SF-All Colwood – SF-All Highlands – SF-All North Saanich – SF-All Sidney – SF-All Central Saanich – SF-All ML Malahat Area – SF-All GI Gulf Islands – SF-All 372.6 372.1 371.8 367.3 356.1 355.4 352.2 351.7 351.2 347.8 345.9 345.7 342.2 342.0 341.9 340.9 339.9 337.4 336.8 334.3 333.5 333.5 330.5 330.5 329.8 328.0 327.6 326.6 325.3 325.2 323.7 322.2 321.9 321.8 321.3 320.6 318.8 318.1 317.9 316.8 316.4 316.2 315.8 314.8 313.4 313.3 312.7 312.6 312.2 312.1 311.9 311.5 311.3 311.2 311.0 310.6 310.3 310.2 310.1 309.5 307.7 306.8 306.4 305.6 305.5 305.2 305.1 304.6 303.8 303.4 303.3 302.5 302.5 302.0 301.5 300.3 299.3 299.2 299.0 295.2 294.2 293.5 292.5 289.7 289.4 278.2 258.8 254.8 253.5 246.4 244.7 242.9 242.2 241.9 240.7 240.3 238.4 238.1 236.7 236.6 236.6 234.8 232.9 231.5 230.7 228.3 224.4 223.8 222.6 221.0 219.7 218.2 217.4 213.7 213.4 210.5 208.5 207.7 207.3 206.1 206.0 205.4 205.0 194.2 191.7 158.1 100.0 100.0 100.0 100.0 100.0 100.0 100.0 100.0 100.0 100.0 100.0 100.0 100.0 100.0 100.0 100.0 100.0 100.0 HPI by Timeframe and Property Type Value or percent change Value Percent change HPI or Benchmark Price HPI Benchmark Price 1. Area Group VREB District Summary 3. Area/Property Type Selection All 2. Property Type – Single Family-All (SF-All)
- 8. Note: Areas with insufficient sales are not included in the HPI. Source: Victoria Real Estate Board May 2023 1 Month Ago 3 Months Ago 6 Months Ago 12 Months Ago 3 Years Ago 5 Years Ago January 2005 Victoria REB – Con Victoria – Con Victoria West – Con Oak Bay – Con Esquimalt – Con View Royal – Con Saanich East – Con Saanich West – Con Sooke – Con Langford – Con Colwood – Con North Saanich – Con Sidney – Con Central Saanich – Con $814,600 $794,100 $789,700 $758,000 $753,300 $752,400 $745,400 $741,400 $740,400 $735,300 $734,400 $724,300 $717,000 $710,300 $699,100 $660,700 $660,500 $628,300 $621,600 $619,600 $619,300 $618,300 $607,300 $603,900 $601,600 $600,400 $599,200 $598,400 $595,800 $594,200 $593,600 $593,200 $590,500 $588,900 $587,800 $586,000 $584,000 $582,900 $579,400 $577,800 $576,900 $570,000 $566,000 $565,200 $564,600 $562,400 $559,700 $559,400 $554,500 $552,000 $551,500 $549,900 $549,500 $549,400 $548,700 $547,400 $544,500 $540,900 $540,300 $537,900 $534,300 $532,400 $531,500 $529,100 $527,500 $527,000 $525,400 $523,400 $520,100 $511,500 $502,400 $501,500 $478,700 $474,000 $465,700 $462,100 $461,600 $456,400 $450,400 $449,400 $440,300 $440,000 $435,900 $430,000 $416,900 $413,200 $408,200 $402,300 $399,000 $395,300 $387,500 $379,700 $377,100 $376,100 $374,400 $371,900 $321,800 $313,700 $296,600 $257,000 $234,300 $216,600 $214,400 $182,900 $172,600 $163,700 $150,200 $147,000 $146,500 $142,900 $113,700 $111,300 Benchmark Price by Timeframe and Property Type Value or percent change Value Percent change HPI or Benchmark Price HPI Benchmark Price 1. Area Group VREB District Summary 3. Area/Property Type Selection All 2. Property Type – Condo Apartment (Con)
- 9. Note: Areas with insufficient sales are not included in the HPI. Source: Victoria Real Estate Board May 2023 1 Month Ago 3 Months Ago 6 Months Ago 12 Months Ago 3 Years Ago 5 Years Ago January 2005 Victoria REB – Con Victoria – Con Victoria West – Con Oak Bay – Con Esquimalt – Con View Royal – Con Saanich East – Con Saanich West – Con Sooke – Con Langford – Con Colwood – Con North Saanich – Con Sidney – Con Central Saanich – Con 515.4 483.6 478.3 469.9 449.9 441.1 430.1 420.6 418.4 415.2 412.3 405.5 403.8 394.4 384.5 378.5 375.5 375.1 374.4 372.4 371.7 368.8 367.2 366.3 364.0 361.1 360.7 360.1 360.1 359.9 358.1 353.8 351.6 349.8 338.9 335.6 330.4 330.2 330.1 329.3 327.9 327.1 324.7 324.5 319.3 317.9 317.0 316.0 315.4 308.2 306.0 306.0 303.2 298.4 294.9 292.8 290.1 290.0 289.1 283.3 281.8 281.7 279.1 277.9 277.7 277.2 276.6 273.9 271.8 271.4 271.4 266.5 266.3 265.7 264.5 256.7 254.9 253.6 253.0 252.4 251.7 251.3 251.1 249.5 246.3 241.5 241.1 240.1 236.3 234.4 234.1 233.2 221.1 213.1 205.4 198.5 185.8 178.3 100.0 100.0 100.0 100.0 100.0 100.0 100.0 100.0 100.0 100.0 100.0 100.0 100.0 100.0 HPI by Timeframe and Property Type Value or percent change Value Percent change HPI or Benchmark Price HPI Benchmark Price 1. Area Group VREB District Summary 3. Area/Property Type Selection All 2. Property Type – Condo Apartment (Con)
- 10. Note: Areas with insufficient sales are not included in the HPI. Source: Victoria Real Estate Board May 2023 1 Month Ago 3 Months Ago 6 Months Ago 12 Months Ago 3 Years Ago 5 Years Ago January 2005 Victoria REB – Twn Victoria – Twn Victoria West – Twn Esquimalt – Twn View Royal – Twn Saanich East – Twn Saanich West – Twn Sooke – Twn Langford – Twn Colwood – Twn Sidney – Twn Central Saanich – Twn ML Malahat Area – Twn GI Gulf Islands – Twn $977,900 $965,300 $950,400 $897,400 $895,800 $894,100 $880,900 $870,000 $866,800 $866,400 $866,000 $864,100 $864,000 $862,400 $862,400 $857,200 $853,800 $852,200 $852,100 $847,300 $838,300 $836,700 $808,500 $803,500 $801,000 $800,800 $789,600 $787,200 $783,900 $781,500 $780,000 $777,700 $772,500 $772,100 $770,100 $768,000 $767,200 $764,800 $764,400 $762,300 $760,800 $756,300 $755,100 $752,600 $752,200 $751,800 $748,300 $746,300 $744,800 $743,600 $741,900 $731,200 $723,200 $720,100 $712,000 $710,600 $700,600 $698,000 $696,900 $695,000 $683,400 $678,900 $678,800 $677,900 $677,600 $672,400 $671,700 $669,900 $664,900 $662,400 $658,500 $653,600 $645,700 $638,300 $638,100 $627,100 $623,200 $617,000 $598,100 $586,000 $583,300 $580,900 $580,500 $577,400 $566,500 $557,400 $556,500 $532,500 $524,500 $518,800 $506,800 $501,800 $499,100 $488,800 $474,700 $473,200 $456,400 $449,700 $312,300 $305,200 $273,100 $265,000 $252,700 $250,900 $250,600 $241,600 $240,500 $224,800 $218,900 $215,800 $210,700 $189,800 Benchmark Price by Timeframe and Property Type Value or percent change Value Percent change HPI or Benchmark Price HPI Benchmark Price 1. Area Group VREB District Summary 3. Area/Property Type Selection All 2. Property Type – Townhouse (Twn)
- 11. Note: Areas with insufficient sales are not included in the HPI. Source: Victoria Real Estate Board May 2023 1 Month Ago 3 Months Ago 6 Months Ago 12 Months Ago 3 Years Ago 5 Years Ago January 2005 Victoria REB – Twn Victoria – Twn Victoria West – Twn Esquimalt – Twn View Royal – Twn Saanich East – Twn Saanich West – Twn Sooke – Twn Langford – Twn Colwood – Twn Sidney – Twn Central Saanich – Twn ML Malahat Area – Twn GI Gulf Islands – Twn 455.2 429.4 414.8 407.0 403.0 393.2 391.9 388.5 379.8 379.1 372.2 367.1 362.8 356.8 344.6 343.8 343.7 342.7 335.1 333.7 333.0 331.3 330.8 326.1 322.6 319.6 318.8 317.5 317.4 315.6 314.9 313.1 312.5 312.2 311.5 311.4 311.3 310.2 308.1 302.6 302.0 301.4 299.6 298.8 297.8 296.9 296.0 295.5 293.5 291.3 290.6 287.7 287.4 286.8 285.1 284.7 283.9 282.4 281.7 281.2 281.0 280.9 279.2 279.0 277.6 277.3 276.3 276.1 275.4 274.5 272.6 269.0 267.7 264.1 257.5 254.7 246.8 246.2 240.5 238.4 230.8 230.1 229.2 224.6 220.3 220.2 219.2 217.1 215.7 214.6 213.8 211.6 209.3 208.5 207.5 204.1 196.5 186.1 100.0 100.0 100.0 100.0 100.0 100.0 100.0 100.0 100.0 100.0 100.0 100.0 100.0 100.0 HPI by Timeframe and Property Type Value or percent change Value Percent change HPI or Benchmark Price HPI Benchmark Price 1. Area Group VREB District Summary 3. Area/Property Type Selection All 2. Property Type – Townhouse (Twn)
- 12. Note: Areas with insufficient sales are not included in the HPI. Source: Victoria Real Estate Board Victoria REB – SF-All Core – SF-All Westshore – SF-All Peninsula – SF-All Select Date Range: All values Jan 2003 Jan 2005 Jan 2007 Jan 2009 Jan 2011 Jan 2013 Jan 2015 Jan 2017 Jan 2019 Jan 2021 Jan 2023 Benchmark Price ($) 200,000 400,000 600,000 800,000 1,000,000 1,200,000 1,400,000 Benchmark Price Performance over Time 1. Area Group VREB Area Summary 3. Area/Property Type Selection Multiple values 2. Property Type – Single Family-All (SF-All) HPI or Benchmark Price HPI Benchmark Price Adding labels Hold Ctrl (Cmd) and select points on the chart to show multiple date/value labels
- 13. Note: Areas with insufficient sales are not included in the HPI. Source: Victoria Real Estate Board Victoria REB – Con Core – Con Westshore – Con Peninsula – Con Select Date Range: All values Jan 2003 Jan 2005 Jan 2007 Jan 2009 Jan 2011 Jan 2013 Jan 2015 Jan 2017 Jan 2019 Jan 2021 Jan 2023 Benchmark Price ($) 100,000 200,000 300,000 400,000 500,000 600,000 Benchmark Price Performance over Time 1. Area Group VREB Area Summary 3. Area/Property Type Selection All 2. Property Type – Condo Apartment (Con) HPI or Benchmark Price HPI Benchmark Price Adding labels Hold Ctrl (Cmd) and select points on the chart to show multiple date/value labels
- 14. Note: Areas with insufficient sales are not included in the HPI. Source: Victoria Real Estate Board Victoria REB – Twn Core – Twn Westshore – Twn Peninsula – Twn Select Date Range: All values Jan 2003 Jan 2005 Jan 2007 Jan 2009 Jan 2011 Jan 2013 Jan 2015 Jan 2017 Jan 2019 Jan 2021 Jan 2023 Benchmark Price ($) 200,000 300,000 400,000 500,000 600,000 700,000 800,000 900,000 Benchmark Price Performance over Time 1. Area Group VREB Area Summary 3. Area/Property Type Selection Multiple values 2. Property Type – Townhouse (Twn) HPI or Benchmark Price HPI Benchmark Price Adding labels Hold Ctrl (Cmd) and select points on the chart to show multiple date/value labels
- 15. Note: Areas with insufficient sales are not included in the HPI. Source: Victoria Real Estate Board Victoria REB – SF-All Victoria REB – Twn Victoria REB – Con Select Date Range: All values Jan 2003 Jan 2005 Jan 2007 Jan 2009 Jan 2011 Jan 2013 Jan 2015 Jan 2017 Jan 2019 Jan 2021 Jan 2023 Benchmark Price ($) 200,000 400,000 600,000 800,000 1,000,000 1,200,000 Benchmark Price Performance over Time 1. Area Group VREB Area Summary 3. Area/Property Type Selection Multiple values 2. Property Type Multiple values HPI or Benchmark Price HPI Benchmark Price Adding labels Hold Ctrl (Cmd) and select points on the chart to show multiple date/value labels
- 16. Monthly Sales Summary (Mark I) Residential Waterfront Properties Integrated Into Their Own Districts Units Total Volume May 2023 District Produced: 01-Jun-2023 Residential Single Family Detached l Greater Victoria Victoria / Victoria West 29 $35,065,000 Oak Bay 19 $40,081,500 Esquimalt 14 $16,696,900 View Royal 7 $9,463,000 Saanich East 64 $95,183,333 Saanich West 36 $44,768,672 Central Saanich 21 $30,500,000 North Saanich 16 $25,773,250 Sidney 17 $22,412,800 Highlands 2 $3,905,000 Colwood 26 $28,876,699 Langford 61 $72,840,902 Metchosin 3 $5,949,000 Sooke 40 $40,788,189 Gulf Islands 26 $24,605,519 Total Greater Victoria 381 $496,909,764 Other Areas Malahat Area 18 $20,813,400 Total Other Areas 18 $20,813,400 Total Single Family Detached 399 $517,723,164 Condo Apartment l Greater Victoria Victoria / Victoria West 118 $81,027,858 Oak Bay 7 $5,881,000 Esquimalt 9 $5,669,100 View Royal 4 $2,074,800 Saanich East 34 $23,244,450 Saanich West 21 $11,916,100 Central Saanich 1 $550,000 North Saanich 2 $1,675,000 Sidney 12 $11,640,500 Colwood 7 $5,164,300 Langford 31 $16,865,480 Sooke 2 $1,625,000 Total Greater Victoria 248 $167,333,588 Total Condo Apartment 248 $167,333,588 Page 1 of 3 Victoria Real Estate Board Multiple Listing Service ®
- 17. Monthly Sales Summary (Mark I) Residential Waterfront Properties Integrated Into Their Own Districts Units Total Volume May 2023 District Produced: 01-Jun-2023 Row/Townhouse l Greater Victoria Victoria / Victoria West 16 $13,111,200 Esquimalt 3 $2,116,800 View Royal 5 $4,438,000 Saanich East 11 $11,418,800 Saanich West 5 $4,409,900 Central Saanich 5 $3,998,000 North Saanich 1 $907,000 Sidney 10 $10,382,900 Colwood 4 $3,187,000 Langford 16 $12,990,900 Sooke 7 $4,132,000 Gulf Islands 1 $599,000 Total Greater Victoria 84 $71,691,500 Total Row/Townhouse 84 $71,691,500 Manufactured Home l Greater Victoria View Royal 1 $320,000 Central Saanich 4 $1,559,900 Sidney 1 $465,000 Langford 6 $1,219,400 Sooke 1 $317,500 Gulf Islands 2 $672,000 Total Greater Victoria 15 $4,553,800 Other Areas Malahat Area 2 $625,000 Total Other Areas 2 $625,000 Total Manufactured Home 17 $5,178,800 Total Residential 748 $761,927,052 Page 2 of 3 Victoria Real Estate Board Multiple Listing Service ®
- 18. Monthly Sales Summary (Mark I) Residential Waterfront Properties Integrated Into Their Own Districts Units Total Volume May 2023 District Produced: 01-Jun-2023 $774,999,256 775 Grand Totals Other Property Lots Acreage l Greater Victoria Victoria / Victoria West 1 $451,000 Oak Bay 1 $470,000 Colwood 1 $580,000 Langford 0 $491,000 Sooke 1 $535,000 Gulf Islands 6 $2,548,300 Total Greater Victoria 10 $5,075,300 Total Lots Acreage 10 $5,075,300 17 $7,996,904 Other Commercial Properties l Page 3 of 3 Victoria Real Estate Board Multiple Listing Service ®
- 19. Monthly Sales Summary (Mark II) Waterfront Properties Segregated Into a 'Waterfront' District Units Total Volume May 2023 District Produced: 01-Jun-2023 Residential Single Family Detached l Greater Victoria Victoria 24 $29,072,000 Victoria West 4 $3,878,000 Oak Bay 18 $37,331,500 Esquimalt 13 $14,739,400 View Royal 5 $5,728,000 Saanich East 62 $88,893,333 Saanich West 36 $44,768,672 Central Saanich 19 $23,750,000 North Saanich 16 $25,773,250 Sidney 15 $16,502,800 Highlands 2 $3,905,000 Colwood 26 $28,876,699 Langford 60 $70,235,902 Metchosin 3 $5,949,000 Sooke 34 $30,882,690 Gulf Islands 20 $17,993,519 Waterfront (all districts) 24 $48,629,999 Total Greater Victoria 381 $496,909,764 Other Areas Malahat Area 15 $17,318,400 Waterfront (all districts) 3 $3,495,000 Total Other Areas 18 $20,813,400 Total Single Family Detached 399 $517,723,164 Condo Apartment l Greater Victoria Victoria 94 $56,309,238 Victoria West 15 $12,560,574 Oak Bay 7 $5,881,000 Esquimalt 8 $5,013,200 View Royal 4 $2,074,800 Saanich East 33 $22,284,450 Saanich West 20 $11,386,100 Central Saanich 1 $550,000 North Saanich 2 $1,675,000 Sidney 9 $6,595,500 Colwood 7 $5,164,300 Langford 31 $16,865,480 Sooke 1 $915,000 Waterfront (all districts) 16 $20,058,946 Total Greater Victoria 248 $167,333,588 Total Condo Apartment 248 $167,333,588 Page 1 of 3 Victoria Real Estate Board Multiple Listing Service ®
- 20. Monthly Sales Summary (Mark II) Waterfront Properties Segregated Into a 'Waterfront' District Units Total Volume May 2023 District Produced: 01-Jun-2023 Row/Townhouse l Greater Victoria Victoria 12 $9,293,800 Victoria West 3 $2,847,400 Esquimalt 3 $2,116,800 View Royal 5 $4,438,000 Saanich East 10 $10,018,800 Saanich West 5 $4,409,900 Central Saanich 4 $3,198,000 North Saanich 1 $907,000 Sidney 7 $5,997,900 Colwood 4 $3,187,000 Langford 16 $12,990,900 Sooke 7 $4,132,000 Gulf Islands 1 $599,000 Waterfront (all districts) 6 $7,555,000 Total Greater Victoria 84 $71,691,500 Total Row/Townhouse 84 $71,691,500 Manufactured Home l Greater Victoria View Royal 1 $320,000 Central Saanich 4 $1,559,900 Sidney 1 $465,000 Langford 5 $934,400 Sooke 1 $317,500 Gulf Islands 2 $672,000 Waterfront (all districts) 1 $285,000 Total Greater Victoria 15 $4,553,800 Other Areas Malahat Area 2 $625,000 Total Other Areas 2 $625,000 Total Manufactured Home 17 $5,178,800 Total Residential 748 $761,927,052 Page 2 of 3 Victoria Real Estate Board Multiple Listing Service ®
- 21. Monthly Sales Summary (Mark II) Waterfront Properties Segregated Into a 'Waterfront' District Units Total Volume May 2023 District Produced: 01-Jun-2023 $774,999,256 775 Grand Totals Other Property Lots Acreage l Greater Victoria Victoria / Victoria West 1 $451,000 Oak Bay 1 $470,000 Colwood 1 $580,000 Langford 0 $491,000 Sooke 1 $535,000 Gulf Islands 6 $2,548,300 Total Greater Victoria 10 $5,075,300 Total Lots Acreage 10 $5,075,300 17 $7,996,904 Other Commercial Properties l Page 3 of 3 Victoria Real Estate Board Multiple Listing Service ®
- 22. Sales to Active Listings Ratio The ratio of counts of total residential sales over total active residential listings for the last 25 months May 2023 Produced: 01-Jun-2023 10% 20% 30% 40% 50% 60% 70% 80% 90% 100% 110% 120% May 2021 Jun 2021 Jul 2021 Aug 2021 Sep 2021 Oct 2021 Nov 2021 Dec 2021 Jan 2022 Feb 2022 Mar 2022 Apr 2022 May 2022 Jun 2022 Jul 2022 Aug 2022 Sep 2022 Oct 2022 Nov 2022 Dec 2022 Jan 2023 Feb 2023 Mar 2023 Apr 2023 May 2023 The Sales to Active Listings Ratio This chart tracks the ratio of total residential sales over total active residential listings at month-end for each of the last 25 months. The active listing count and the sales count can be viewed as indicators of housing supply and demand respectively. Observing the ratio between them can thus help indicate a buyers' market, where there is sustained downward pressure on prices, and a sellers' market, where there is sustained upward pressure on prices. Based on a regression analysis performed by the Economics Department of the BC Real Estate Association in each market area of the province, the Sales to Active Listings Ratio for Victoria can be interpreted as follows: - below 14%, there is downward pressure on prices (buyers' market) - above 20%, there is upward pressure on prices (sellers' market) - in the 14-20% range, there is little pressure on prices either way (balanced market) Victoria Real Estate Board Multiple Listing Service ® Page 1 of 1
- 23. Monthly Comparative Activity By Property Type Includes All MLS® Property Types May 2023 Current Month This Year % Change Last Year Year To Date This Year % Change Last Year Produced: 01-Jun-2023 Single Family - Residential Units Listed 498 Units Sold 314 Sell/List Ratio 63 Sales Dollars $388,903,625 Average Price / Unit $1,238,547 Price Ratio 99 Days To Sell 29 Active Listings at Month End 609 % % 620 286 46 $372,243,662 $1,301,551 101 14 600 % % -20 10 4 -5 104 2 % % % % % % 1806 1060 59 $1,306,350,038 $1,232,406 99 36 % % 2195 1338 61 $1,825,876,447 $1,364,631 105 13 % % -18 -21 -28 -10 172 % % % % % Single Family - Residential Waterfront Units Listed 70 Units Sold 23 Sell/List Ratio 33 Sales Dollars $49,340,499 Average Price / Unit $2,145,239 Price Ratio 95 Days To Sell 64 Active Listings at Month End 144 % % 57 19 33 $60,500,500 $3,184,237 96 29 99 % % 23 21 -18 -33 121 45 % % % % % % 203 56 28 $125,709,999 $2,244,821 94 68 % % 181 81 45 $223,328,477 $2,757,142 98 36 % % 12 -31 -44 -19 86 % % % % % Single Family - Residential Acreage Units Listed 62 Units Sold 26 Sell/List Ratio 42 Sales Dollars $46,293,900 Average Price / Unit $1,780,535 Price Ratio 97 Days To Sell 46 Active Listings at Month End 134 % % 70 27 39 $45,364,899 $1,680,181 100 27 98 % % -11 -4 2 6 71 37 % % % % % % 253 111 44 $167,619,534 $1,510,086 95 60 % % 216 109 50 $178,739,398 $1,639,811 100 29 % % 17 2 -6 -8 106 % % % % % Condo Apartment Units Listed 363 Units Sold 248 Sell/List Ratio 68 Sales Dollars $167,333,588 Average Price / Unit $674,732 Price Ratio 98 Days To Sell 31 Active Listings at Month End 486 % % 402 250 62 $163,879,403 $655,518 101 16 355 % % -10 -1 2 3 96 37 % % % % % % 1514 912 60 $572,816,867 $628,089 98 34 % % 1688 1246 74 $835,933,310 $670,894 103 16 % % -10 -27 -31 -6 117 % % % % % Page 1 of 8 Victoria Real Estate Board Multiple Listing Service ®
- 24. Monthly Comparative Activity By Property Type Includes All MLS® Property Types May 2023 Current Month This Year % Change Last Year Year To Date This Year % Change Last Year Produced: 01-Jun-2023 Row/Townhouse Units Listed 144 Units Sold 84 Sell/List Ratio 58 Sales Dollars $71,691,500 Average Price / Unit $853,470 Price Ratio 99 Days To Sell 28 Active Listings at Month End 168 % % 142 84 59 $71,418,850 $850,224 103 13 115 % % 1 0 0 0 116 46 % % % % % % 534 315 59 $248,021,434 $787,370 99 35 % % 563 412 73 $368,489,460 $894,392 105 15 % % -5 -24 -33 -12 133 % % % % % Half Duplex (Up and Down) Units Listed 2 Units Sold 2 Sell/List Ratio 100 Sales Dollars $3,060,000 Average Price / Unit $1,530,000 Price Ratio 111 Days To Sell 13 Active Listings at Month End 1 % % 4 1 25 $1,000,100 $1,000,100 106 14 5 % % -50 100 206 53 -7 -80 % % % % % % 7 4 57 $5,160,000 $1,290,000 107 14 % % 10 5 50 $6,301,100 $1,260,220 97 100 % % -30 -20 -18 2 -86 % % % % % Half Duplex (Side by Side) Units Listed 33 Units Sold 23 Sell/List Ratio 70 Sales Dollars $20,213,640 Average Price / Unit $878,854 Price Ratio 100 Days To Sell 29 Active Listings at Month End 40 % % 40 18 45 $16,120,700 $895,594 102 14 41 % % -18 28 25 -2 111 -2 % % % % % % 122 80 66 $69,925,978 $874,075 100 29 % % 150 86 57 $78,463,999 $912,372 106 13 % % -19 -7 -11 -4 129 % % % % % Half Duplex (Front and Back) Units Listed 2 Units Sold 3 Sell/List Ratio 150 Sales Dollars $2,219,000 Average Price / Unit $739,667 Price Ratio 99 Days To Sell 31 Active Listings at Month End 3 % % 11 5 45 $5,150,000 $1,030,000 98 14 8 % % -82 -40 -57 -28 125 -63 % % % % % % 13 10 77 $8,689,500 $868,950 99 33 % % 29 12 41 $11,469,800 $955,817 101 17 % % -55 -17 -24 -9 88 % % % % % Page 2 of 8 Victoria Real Estate Board Multiple Listing Service ®
- 25. Monthly Comparative Activity By Property Type Includes All MLS® Property Types May 2023 Current Month This Year % Change Last Year Year To Date This Year % Change Last Year Produced: 01-Jun-2023 Recreational Units Listed 5 Units Sold 3 Sell/List Ratio 60 Sales Dollars $669,500 Average Price / Unit $223,167 Price Ratio 98 Days To Sell 45 Active Listings at Month End 11 % % 5 3 60 $211,000 $70,333 97 69 10 % % 0 0 217 217 -35 10 % % % % % % 16 9 56 $2,294,400 $254,933 95 50 % % 20 12 60 $2,902,250 $241,854 96 59 % % -20 -25 -21 5 -15 % % % % % Manufactured Home Units Listed 32 Units Sold 17 Sell/List Ratio 53 Sales Dollars $5,178,800 Average Price / Unit $304,635 Price Ratio 96 Days To Sell 43 Active Listings at Month End 46 % % 30 23 77 $10,774,300 $468,448 97 38 40 % % 7 -26 -52 -35 12 15 % % % % % % 102 56 55 $18,618,300 $332,470 96 53 % % 124 82 66 $30,987,929 $377,902 99 33 % % -18 -32 -40 -12 59 % % % % % Residential Lots Units Listed 30 Units Sold 4 Sell/List Ratio 13 Sales Dollars $2,292,000 Average Price / Unit $573,000 Price Ratio 92 Days To Sell 181 Active Listings at Month End 105 % % 41 7 17 $4,084,800 $583,543 99 18 79 % % -27 -43 -44 -2 916 33 % % % % % % 129 18 14 $11,607,920 $644,884 95 113 % % 147 63 43 $36,182,546 $574,326 99 25 % % -12 -71 -68 12 357 % % % % % Residential Lots - Waterfront Units Listed 4 Units Sold 0 Sell/List Ratio Sales Dollars $0 Average Price / Unit Price Ratio Days To Sell Active Listings at Month End 14 % % 1 2 200 $302,500 $151,250 96 77 8 % % 300 -100 -100 75 % % % % % % 12 1 8 $1,250,000 $1,250,000 93 21 % % 17 6 35 $3,968,000 $661,333 101 41 % % -29 -83 -68 89 -49 % % % % % Page 3 of 8 Victoria Real Estate Board Multiple Listing Service ®
- 26. Monthly Comparative Activity By Property Type Includes All MLS® Property Types May 2023 Current Month This Year % Change Last Year Year To Date This Year % Change Last Year Produced: 01-Jun-2023 Residential Acreage Units Listed 14 Units Sold 3 Sell/List Ratio 21 Sales Dollars $1,902,000 Average Price / Unit $634,000 Price Ratio 97 Days To Sell 14 Active Listings at Month End 55 % % 25 7 28 $4,284,000 $612,000 96 85 47 % % -44 -57 -56 4 -83 17 % % % % % % 50 12 24 $8,358,000 $696,500 98 70 % % 69 33 48 $27,339,800 $828,479 94 86 % % -28 -64 -69 -16 -19 % % % % % Residential Acreage - Waterfront Units Listed 3 Units Sold 3 Sell/List Ratio 100 Sales Dollars $881,300 Average Price / Unit $293,767 Price Ratio 91 Days To Sell 98 Active Listings at Month End 25 % % 4 1 25 $537,380 $537,380 120 18 9 % % -25 200 64 -45 446 178 % % % % % % 17 5 29 $4,381,300 $876,260 89 158 % % 11 4 36 $2,551,380 $637,845 100 105 % % 55 25 72 37 51 % % % % % Revenue - Duplex/Triplex Units Listed 10 Units Sold 5 Sell/List Ratio 50 Sales Dollars $7,023,000 Average Price / Unit $1,404,600 Price Ratio 100 Days To Sell 18 Active Listings at Month End 14 % % 8 8 100 $11,768,999 $1,471,125 100 23 9 % % 25 -38 -40 -5 -22 56 % % % % % % 31 15 48 $22,995,000 $1,533,000 97 33 % % 43 28 65 $39,614,999 $1,414,821 104 15 % % -28 -46 -42 8 119 % % % % % Revenue - Multi Units Units Listed 13 Units Sold 0 Sell/List Ratio Sales Dollars $0 Average Price / Unit Price Ratio Days To Sell Active Listings at Month End 28 % % 8 6 75 $13,300,000 $2,216,667 102 118 19 % % 63 -100 -100 47 % % % % % % 29 7 24 $10,077,500 $1,439,643 95 86 % % 44 16 36 $27,672,000 $1,729,500 102 75 % % -34 -56 -64 -17 14 % % % % % Page 4 of 8 Victoria Real Estate Board Multiple Listing Service ®
- 27. Monthly Comparative Activity By Property Type Includes All MLS® Property Types May 2023 Current Month This Year % Change Last Year Year To Date This Year % Change Last Year Produced: 01-Jun-2023 Revenue - Apartment Block Units Listed 0 Units Sold 0 Sell/List Ratio Sales Dollars $0 Average Price / Unit Price Ratio Days To Sell Active Listings at Month End 0 % % 0 0 $0 0 % % % % % % % % 0 0 $0 % % 0 0 $0 % % % % % % % Revenue - Commercial Units Listed 16 Units Sold 6 Sell/List Ratio 38 Sales Dollars $4,966,000 Average Price / Unit $827,667 Price Ratio 90 Days To Sell 109 Active Listings at Month End 53 % % 9 4 44 $4,255,000 $1,063,750 95 48 23 % % 78 50 17 -22 126 130 % % % % % % 63 16 25 $14,320,180 $895,011 92 81 % % 38 22 58 $34,456,112 $1,566,187 97 56 % % 66 -27 -58 -43 45 % % % % % Revenue - Industrial Units Listed 3 Units Sold 2 Sell/List Ratio 67 Sales Dollars $1,897,500 Average Price / Unit $948,750 Price Ratio 96 Days To Sell 46 Active Listings at Month End 17 % % 4 2 50 $1,950,000 $975,000 93 76 9 % % -25 0 -3 -3 -39 89 % % % % % % 16 5 31 $5,072,500 $1,014,500 96 109 % % 19 17 89 $14,008,600 $824,035 99 40 % % -16 -71 -64 23 170 % % % % % Business with Land Building Units Listed 1 Units Sold 0 Sell/List Ratio Sales Dollars $0 Average Price / Unit Price Ratio Days To Sell Active Listings at Month End 5 % % 0 0 $0 5 % % 0 % % % % % % 4 0 0 $0 % % 4 0 0 $0 % % 0 % % % % % Page 5 of 8 Victoria Real Estate Board Multiple Listing Service ®
- 28. Monthly Comparative Activity By Property Type Includes All MLS® Property Types May 2023 Current Month This Year % Change Last Year Year To Date This Year % Change Last Year Produced: 01-Jun-2023 Business Only Units Listed 18 Units Sold 3 Sell/List Ratio 17 Sales Dollars $985,000 Average Price / Unit $328,333 Price Ratio 82 Days To Sell 64 Active Listings at Month End 74 % % 9 2 22 $156,500 $78,250 79 127 62 % % 100 50 529 320 -49 19 % % % % % % 64 16 25 $2,798,000 $174,875 84 111 % % 51 8 16 $1,196,500 $149,563 86 140 % % 25 100 134 17 -21 % % % % % Motel/Hotel Units Listed 0 Units Sold 0 Sell/List Ratio Sales Dollars $0 Average Price / Unit Price Ratio Days To Sell Active Listings at Month End 0 % % 0 0 $0 0 % % % % % % % % 0 0 $0 % % 0 0 $0 % % % % % % % Lease - Office Units Listed 12 Units Sold 2 Sell/List Ratio 17 Sales Dollars $145,143 Average Price / Unit $72,572 Price Ratio 439827 Days To Sell 64 Active Listings at Month End 67 % % 23 2 9 $627 $314 100 42 69 % % -48 0 23049 23049 52 -3 % % % % % % 54 16 30 $149,307 $9,332 3513 98 % % 60 11 18 $70,680 $6,425 9032 75 % % -10 45 111 45 30 % % % % % Lease - Retail Units Listed 9 Units Sold 2 Sell/List Ratio 22 Sales Dollars $48 Average Price / Unit $24 Price Ratio 98 Days To Sell 215 Active Listings at Month End 51 % % 7 3 43 $1,551 $517 100 62 35 % % 29 -33 -97 -95 249 46 % % % % % % 43 8 19 $201 $25 99 173 % % 33 13 39 $1,796 $138 100 86 % % 30 -38 -89 -82 100 % % % % % Page 6 of 8 Victoria Real Estate Board Multiple Listing Service ®
- 29. Monthly Comparative Activity By Property Type Includes All MLS® Property Types May 2023 Current Month This Year % Change Last Year Year To Date This Year % Change Last Year Produced: 01-Jun-2023 Lease - Warehouse Units Listed 0 Units Sold 0 Sell/List Ratio Sales Dollars $0 Average Price / Unit Price Ratio Days To Sell Active Listings at Month End 0 % % 0 0 $0 0 % % % % % % % % 0 0 $0 % % 0 0 $0 % % % % % % % Lease - Industrial Units Listed 7 Units Sold 2 Sell/List Ratio 29 Sales Dollars $3,213 Average Price / Unit $1,607 Price Ratio 100 Days To Sell 56 Active Listings at Month End 21 % % 4 0 $0 6 % % 75 250 % % % % % % 29 7 24 $3,312 $473 57 57 % % 7 2 29 $38 $19 96 78 % % 314 250 8570 2377 -26 % % % % % Lease - Other Units Listed 5 Units Sold 0 Sell/List Ratio Sales Dollars $0 Average Price / Unit Price Ratio Days To Sell Active Listings at Month End 7 % % 0 0 $0 2 % % 250 % % % % % % 8 1 13 $13 $13 100 80 % % 0 1 $23 $23 100 157 % % 0 -46 -46 -49 % % % % % Commercial Land Units Listed 0 Units Sold 0 Sell/List Ratio Sales Dollars $0 Average Price / Unit Price Ratio Days To Sell Active Listings at Month End 11 % % 7 1 14 $1,900,000 $1,900,000 84 23 % % -100 -100 -100 -52 % % % % % % 7 0 0 $0 % % 21 3 14 $19,925,000 $6,641,667 98 87 % % -67 -100 -100 % % % % % Page 7 of 8 Victoria Real Estate Board Multiple Listing Service ®
- 30. Monthly Comparative Activity By Property Type Includes All MLS® Property Types May 2023 Current Month This Year % Change Last Year Year To Date This Year % Change Last Year Produced: 01-Jun-2023 Units Listed 1356 Units Sold 775 Sell/List Ratio 57 Sales Dollars $774,999,256 Average Price / Unit $999,999 Price Ratio 99 Days To Sell 34 Active Listings at Month End 2189 % % Grand Totals 1531 761 50 $789,204,771 $1,037,063 101 19 1776 % % -11 2 -2 -4 80 23 % % % % % % 5126 2740 53 $2,606,219,283 $951,175 98 39 % % 5740 3610 63 $3,769,479,644 $1,044,177 104 18 % % -11 -24 -31 -9 113 % % % % % Page 8 of 8 Victoria Real Estate Board Multiple Listing Service ®