
Recommended
Recommended
More Related Content
What's hot
What's hot (15)
Similar to March 2020-rebgv-stats-pkg
Similar to March 2020-rebgv-stats-pkg (18)
Recently uploaded
Recently uploaded (20)
March 2020-rebgv-stats-pkg
- 1. News Release FOR IMMEDIATE RELEASE: Home buyers and sellers adjust their activities in March amid challenging circumstances VANCOUVER, BC – April 2, 2020 – Metro Vancouver’s* housing market saw steady home buyer demand to begin March and a levelling off of activity as the month went on and concerns about the COVID-19 outbreak intensified. The Real Estate Board of Greater Vancouver (REBGV) reports that residential home sales in the region totalled 2,524 in March 2020, a 46.1 per cent increase from the 1,727 sales recorded in March 2019, and a 17.4 per cent increase from the 2,150 homes sold in February 2020. Last month’s sales were 19.9 per cent below the 10-year March sales average. “The first two weeks of the month were the busiest days of the year for our region with heightened demand and multiple offers becoming more common,” Ashley Smith, REBGV president said, “Like other aspects of our lives, this changed as concerns over the COVID-19 situation in our province grew.” Daily residential sales on the region’s MLS® were 138 on average in the first ten business days of the month. In the final ten business days of the month, the daily average declined to 93 sales. “Many of the sales recorded in March were in process before the provincial government declared a state of emergency. We’ll need more time to pass to fully understand the impact that the pandemic is having on the housing market,” Smith said. “In recent weeks, REALTORS® have been working to help and guide their clients through this uncertain period. Many people have understandably chosen to put their home buying or selling plans on hold for now. Other people have more urgent housing needs and we’re trying to work with them to address these needs in the safest and most responsible way possible.” There were 4,436 detached, attached and apartment properties newly listed for sale on the Multiple Listing Service® (MLS®) in Metro Vancouver in March 2020. This represents a 10.4 per cent decrease compared to the 4,949 homes listed in March 2019 and a 10.8 per cent increase compared to February 2020 when 4,002 homes were listed. The total number of homes currently listed for sale on the MLS® system in Metro Vancouver is 9,606, a 24.8 per cent decrease compared to March 2019 (12,774) and a 4.5 per cent increase compared to February 2020 (9,195).
- 2. “Realtors were named among the province’s list of essential services last week,” Smith said. “This means that we have a responsibility to do what we can to help residents meet their housing and shelter needs while strictly following the most up-to-date public health orders and physical distancing requirements from our health officials and government agencies.” For all property types, the sales-to-active listings ratio for March 2020 is 26.3 per cent. By property type, the ratio is 21.1 per cent for detached homes, 33 per cent for townhomes, and 28.9 per cent for apartments. Generally, analysts say downward pressure on home prices occurs when the ratio dips below 12 per cent for a sustained period, while home prices often experience upward pressure when it surpasses 20 per cent over several months. The MLS® Home Price Index composite benchmark price for all residential properties in Metro Vancouver is currently $1,033,700. This represents a 2.1 per cent increase over March 2019, and a 1.3 per cent increase compared to February 2020. Sales of detached homes in March 2020 reached 852, a 61.1 per cent increase from the 529 detached sales recorded in March 2019. The benchmark price for detached properties is $1,450,700. This represents a 0.7 per cent increase from March 2019, and a 1.2 per cent increase compared to February 2020. Sales of apartment homes reached 1,179 in March 2020, a 35.1 per cent increase compared to the 873 sales in March 2019. The benchmark price of an apartment property is $687,000. This represents a 2.9 per cent increase from March 2019, and a 1.4 per cent increase compared to February 2020. Attached home sales in March 2020 totalled 493, a 51.7 per cent increase compared to the 325 sales in March 2019. The benchmark price of an attached unit is $791,800. This represents a 2.5 per cent increase from March 2019, and a 0.9 per cent increase compared to February 2020. -30- *Editor’s Note: Areas covered by the Real Estate Board of Greater Vancouver include: Burnaby, Coquitlam, Maple Ridge, New Westminster, North Vancouver, Pitt Meadows, Port Coquitlam, Port Moody, Richmond, South Delta, Squamish, Sunshine Coast, Vancouver, West Vancouver, and Whistler. The real estate industry is a key economic driver in British Columbia. In 2019, 25,351 homes changed ownership in the Board’s area, generating $1.8 billion in economic spin-off activity and an estimated 12,910 jobs. The total dollar value of residential sales transacted through the MLS® system in Greater Vancouver totalled $25.3 billion in 2019. The Real Estate Board of Greater Vancouver is an association representing more than 14,000 REALTORS® and their companies. The Board provides a variety of member services, including the Multiple Listing Service®. For more information on real estate, statistics, and buying or selling a home, contact a local REALTOR® or visit www.rebgv.org. For more information please contact: Craig Munn Manager, Communication Real Estate Board of Greater Vancouver 604.730.3146 | cmunn@rebgv.org
- 3. Property Type Area Benchmark Price Price Index 1 Month Change % 3 Month Change % 6 Month Change % 1 Year Change % 3 Year Change % 5 Year Change % 10 Year Change % Residential / Composite Lower Mainland $975,700 269.3 1.4% 3.3% 3.9% 2.0% 13.5% 60.3% 81.7% Greater Vancouver $1,033,700 268.9 1.3% 3.3% 4.3% 2.1% 9.6% 52.9% 76.9% Bowen Island $926,200 200.8 2.1% -0.9% -5.1% -6.2% 8.7% 56.6% 50.4% Burnaby East $965,900 267.9 2.4% 5.1% 4.9% 2.8% 9.4% 50.8% 76.4% Burnaby North $888,900 268.4 0.9% 3.1% 4.6% 2.2% 9.4% 56.6% 79.1% Burnaby South $967,200 273.2 0.0% 2.3% 2.8% -1.4% 8.1% 53.1% 81.0% Coquitlam $920,700 273.1 1.1% 2.5% 3.8% 1.8% 15.7% 65.2% 91.5% Ladner $803,100 226.1 1.0% 1.7% 3.5% -0.2% 2.7% 37.0% 56.8% Maple Ridge $767,200 244.3 1.4% 2.5% 3.0% 1.9% 20.5% 74.3% 76.6% New Westminster $662,400 291.4 1.8% 3.8% 3.5% 2.2% 21.9% 72.5% 90.2% North Vancouver $1,073,200 241.2 1.2% 4.4% 5.9% 2.9% 6.7% 45.9% 68.8% Pitt Meadows $746,600 271.4 0.6% 2.2% 2.1% -0.4% 25.0% 76.9% 88.6% Port Coquitlam $763,300 261.3 1.8% 2.5% 5.4% 2.4% 18.3% 71.8% 79.1% Port Moody $932,300 257.7 2.4% 4.3% 3.6% 3.0% 19.4% 64.8% 84.5% Richmond $940,800 279.7 1.7% 3.2% 3.9% 1.1% 8.1% 52.7% 74.9% Squamish $785,700 250.0 -0.2% 0.8% 1.1% 4.0% 17.3% 72.9% 94.9% Sunshine Coast $574,000 201.1 2.3% -1.0% -4.4% -5.9% 10.3% 61.7% 52.3% Tsawwassen $924,400 231.7 1.3% 0.5% 2.4% -1.0% -0.3% 41.3% 62.9% Vancouver East $1,096,500 321.9 1.0% 3.6% 6.1% 2.7% 7.4% 55.3% 96.5% Vancouver West $1,296,200 270.1 1.6% 4.8% 5.8% 3.4% 4.2% 41.6% 69.4% West Vancouver $2,108,000 232.1 0.7% -0.6% 1.7% -1.0% -13.1% 17.6% 62.2% Whistler $913,500 212.9 -1.1% -0.4% -0.3% 4.5% 23.5% 74.7% 68.7% Single Family Detached Lower Mainland $1,252,500 265.6 1.5% 2.7% 3.6% 1.6% 3.1% 47.7% 80.8% Greater Vancouver $1,450,700 266.9 1.2% 1.9% 3.2% 0.7% -3.2% 36.9% 74.0% Bowen Island $926,200 200.8 2.1% -0.9% -5.1% -6.2% 8.7% 56.6% 50.4% Burnaby East $1,225,300 274.0 2.5% 6.8% 5.6% 6.1% 5.6% 47.4% 79.9% Burnaby North $1,453,100 281.0 2.4% 4.6% 8.0% 2.9% -4.3% 36.9% 81.4% Burnaby South $1,493,500 285.9 1.1% -0.1% 2.4% -3.3% -7.4% 34.7% 88.1% Coquitlam $1,190,000 264.1 1.4% 2.2% 2.8% 2.4% 3.3% 47.3% 83.0% Ladner $953,700 229.9 1.4% 2.0% 1.8% -0.1% 0.7% 37.7% 63.3% Maple Ridge $835,100 237.9 1.2% 3.3% 3.3% 2.6% 16.2% 71.5% 76.4% New Westminster $1,079,500 269.3 2.4% 6.4% 5.2% 4.0% 3.5% 47.5% 73.5% North Vancouver $1,551,400 244.3 0.3% 2.5% 6.0% 2.5% -3.1% 37.7% 71.1% Pitt Meadows $897,100 252.8 1.4% 1.8% 2.5% -1.7% 15.9% 66.3% 78.0% Port Coquitlam $959,700 255.9 0.7% 0.8% 5.6% 4.2% 7.8% 56.5% 78.3% Port Moody $1,420,300 262.3 0.6% 1.5% 0.9% 1.3% 5.3% 51.4% 82.7% Richmond $1,522,800 295.0 0.9% 1.8% 3.1% -1.5% -5.6% 36.1% 73.6% Squamish $996,500 262.6 -0.5% 1.9% 2.2% 5.6% 13.6% 70.5% 92.4% Sunshine Coast $569,200 199.4 2.2% -0.9% -4.3% -5.9% 10.0% 61.2% 51.1% Tsawwassen $1,156,400 249.0 1.6% 0.2% 1.9% -0.4% -2.0% 45.3% 77.1% Vancouver East $1,426,500 317.3 1.3% 2.6% 5.0% 2.7% -1.6% 40.2% 101.1% Vancouver West $2,942,200 301.7 1.0% 0.7% 1.7% -2.8% -14.9% 20.3% 66.7% West Vancouver $2,554,000 241.1 0.4% -1.4% 1.3% -1.1% -14.4% 15.5% 69.3% Whistler $1,670,000 232.3 -0.6% 2.5% 1.5% 9.2% 14.8% 57.8% 68.9% HOW TO READ THE TABLE: • Benchmark Price: Estimated sale price of a benchmark property. Benchmarks represent a typical property within each market. • Price Index: Index numbers estimate the percentage change in price on typical and constant quality properties over time. All figures are based on past sales. • x Month/Year Change %: Percentage change of index over a period of x month(s)/year(s) * In January 2005, the indexes are set to 100. Townhome properties are similar to Attached properties, a category that was used in the previous MLSLink HPI, but do not included duplexes. The above info is deemed reliable, but is not guaranteed. All dollar amounts in CDN. March 2020* * MLS®, Multiple Listing Service®, and all related graphics are trademarks of The Canadian Real Estate Association 1 of 16
- 4. Property Type Area Benchmark Price Price Index 1 Month Change % 3 Month Change % 6 Month Change % 1 Year Change % 3 Year Change % 5 Year Change % 10 Year Change % March 2020* Townhouse Lower Mainland $682,800 247.8 0.8% 1.8% 2.0% 1.9% 16.4% 63.1% 72.8% Greater Vancouver $791,800 254.1 0.9% 1.7% 3.2% 2.5% 13.1% 57.0% 71.2% Burnaby East $658,100 243.1 -0.3% 1.2% 1.9% -2.0% 12.8% 51.4% 62.5% Burnaby North $727,700 271.6 0.0% 0.5% -0.3% 0.2% 13.0% 57.1% 77.3% Burnaby South $768,400 264.7 -0.6% 0.8% 1.5% -1.4% 13.2% 53.7% 73.8% Coquitlam $679,600 249.4 1.2% 2.5% 4.4% 6.4% 16.5% 63.4% 79.7% Ladner $657,600 233.9 1.3% 2.9% 8.2% 0.9% 3.3% 38.0% 51.0% Maple Ridge $535,100 248.4 2.1% 0.2% 2.3% 0.2% 20.2% 73.7% 74.4% New Westminster $749,000 274.7 0.7% 3.5% 6.1% 2.9% 14.6% 60.5% 79.3% North Vancouver $967,200 235.0 1.7% 4.2% 3.2% 1.5% 6.5% 52.5% 63.8% Pitt Meadows $610,100 264.0 -0.5% 2.7% 2.5% 0.0% 24.5% 81.4% 85.3% Port Coquitlam $643,500 243.6 3.6% 2.8% 3.3% 4.8% 15.7% 68.2% 68.6% Port Moody $639,700 216.2 1.7% 2.1% 0.8% 0.6% 22.5% 47.4% 55.3% Richmond $795,000 261.0 1.4% 3.2% 3.6% 1.2% 8.4% 51.9% 69.2% Squamish $726,500 238.9 -0.2% -0.8% 0.8% 7.7% 21.0% 78.8% 95.7% Tsawwassen $630,500 248.2 0.3% 3.9% 6.8% -0.3% 4.0% 45.9% 60.6% Vancouver East $893,300 286.2 -1.2% 1.4% 5.9% 3.7% 12.0% 54.9% 79.5% Vancouver West $1,133,500 265.0 0.2% -0.2% 3.2% 2.2% 6.0% 45.6% 71.7% Whistler $944,800 227.8 -0.6% -0.7% -0.3% 7.6% 25.9% 86.0% 85.7% Apartment Lower Mainland $671,400 282.3 1.6% 4.5% 5.1% 2.5% 26.5% 77.5% 85.8% Greater Vancouver $687,000 274.6 1.4% 4.6% 5.5% 2.9% 21.9% 70.0% 80.7% Burnaby East $768,900 295.0 4.8% 7.5% 7.7% 6.4% 20.8% 63.6% 88.0% Burnaby North $616,500 263.2 0.5% 3.0% 4.2% 2.3% 21.1% 77.1% 80.6% Burnaby South $674,900 271.0 -0.5% 3.5% 3.1% -1.0% 17.0% 67.4% 80.7% Coquitlam $541,900 297.4 0.5% 2.6% 4.6% 3.7% 34.4% 97.6% 109.4% Ladner $433,200 205.3 -0.4% -0.2% 2.7% 0.1% 12.2% 33.7% 41.5% Maple Ridge $359,700 256.8 1.1% 3.5% 3.2% 2.0% 35.6% 77.6% 74.2% New Westminster $526,300 298.2 1.8% 3.5% 3.0% 1.8% 28.5% 82.4% 95.4% North Vancouver $582,800 237.7 1.9% 6.0% 6.6% 3.3% 20.1% 56.7% 66.5% Pitt Meadows $497,000 293.1 0.5% 2.4% 2.0% 0.9% 33.1% 83.0% 97.1% Port Coquitlam $462,700 276.7 1.7% 3.6% 6.7% 0.6% 31.1% 92.7% 84.5% Port Moody $671,900 280.0 3.8% 7.2% 7.2% 5.8% 31.8% 87.7% 104.1% Richmond $655,200 280.5 2.3% 4.0% 4.5% 2.7% 26.0% 77.6% 80.7% Squamish $486,300 239.7 -0.2% 0.0% -1.1% -3.3% 23.0% 89.3% 97.8% Tsawwassen $463,800 195.6 0.6% 1.1% 2.9% -0.3% 12.5% 38.6% 33.7% Vancouver East $585,600 334.2 1.0% 4.7% 6.8% 2.3% 17.1% 76.1% 92.1% Vancouver West $810,800 263.1 1.9% 6.6% 7.4% 5.4% 15.8% 57.5% 72.3% West Vancouver $1,027,600 208.8 1.4% 1.8% 0.6% -2.5% -1.6% 40.2% 45.3% Whistler $484,800 189.9 -1.9% -1.8% -1.6% -1.1% 27.1% 82.6% 56.3% HOW TO READ THE TABLE: • Benchmark Price: Estimated sale price of a benchmark property. Benchmarks represent a typical property within each market. • Price Index: Index numbers estimate the percentage change in price on typical and constant quality properties over time. All figures are based on past sales. • x Month/Year Change %: Percentage change of index over a period of x month(s)/year(s) In January 2005, the indexes are set to 100. * Townhome properties are similar to attached properties, a category that was used in the previous MLSLink HPI, but do not included duplexes. Lower Mainland includes areas serviced by both Real Estate Board of Greater Vancouver & Fraser Valley Real Estate Board. The above info is deemed reliable, but is not guaranteed. All dollar amounts in CDN. * MLS®, Multiple Listing Service®, and all related graphics are trademarks of The Canadian Real Estate Association 2 of 16
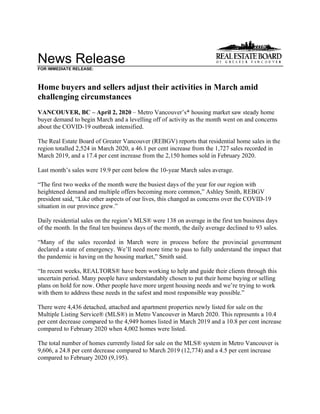
- 5. C:DATAMonthEndHpiexporthi_resgv-hpi2.tifGreaterVancouver 5YearTrend 60 110 160 210 260 310 Mar 2015 May 2015 Jul 2015 Sep 2015 Nov 2015 Jan 2016 Mar 2016 May 2016 Jul 2016 Sep 2016 Nov 2016 Jan 2017 Mar 2017 May 2017 Jul 2017 Sep 2017 Nov 2017 Jan 2018 Mar 2018 May 2018 Jul 2018 Sep 2018 Nov 2018 Jan 2019 Mar 2019 May 2019 Jul 2019 Sep 2019 Nov 2019 Jan 2020 Mar 2020 Price Index ResidentialDetachedTownhouseApartment Jan2005HPI=100
- 8. Listing & Sales Activity Summary Listings Sales 1 2 3 Col. 2 & 3 5 6 7 Col. 6 & 7 9 10 Col. 9 & 10 Mar Feb Mar Percentage Mar Feb Mar Percentage Jan 2019 - Jan 2020 - Percentage 2019 2020 2020 Variance 2019 2020 2020 Variance Mar 2019 Mar 2020 Variance BURNABY % % % DETACHED 163 97 105 8.2 36 54 69 27.8 92 164 78.3 ATTACHED 119 78 68 -12.8 43 47 58 23.4 96 142 47.9 APARTMENTS 279 240 310 29.2 111 134 170 26.9 315 428 35.9 COQUITLAM DETACHED 169 101 147 45.5 48 67 73 9.0 113 181 60.2 ATTACHED 83 48 87 81.3 33 41 49 19.5 82 122 48.8 APARTMENTS 157 177 148 -16.4 61 87 79 -9.2 168 237 41.1 DELTA DETACHED 100 67 87 29.9 22 37 40 8.1 56 100 78.6 ATTACHED 23 19 22 15.8 12 13 14 7.7 27 40 48.1 APARTMENTS 33 34 30 -11.8 6 18 17 -5.6 26 55 111.5 MAPLE RIDGE/PITT MEADOWS DETACHED 173 154 185 20.1 60 98 104 6.1 156 269 72.4 ATTACHED 85 103 88 -14.6 47 60 66 10.0 113 162 43.4 APARTMENTS 53 72 84 16.7 32 38 29 -23.7 75 99 32.0 NORTH VANCOUVER DETACHED 147 124 130 4.8 70 71 69 -2.8 142 164 15.5 ATTACHED 66 54 53 -1.9 22 35 35 0.0 64 83 29.7 APARTMENTS 174 188 165 -12.2 73 98 99 1.0 173 260 50.3 NEW WESTMINSTER DETACHED 44 29 32 10.3 11 20 21 5.0 34 48 41.2 ATTACHED 16 15 21 40.0 5 7 16 128.6 22 27 22.7 APARTMENTS 142 108 143 32.4 65 63 81 28.6 162 182 12.3 PORT MOODY/BELCARRA DETACHED 28 32 40 25.0 7 9 16 77.8 25 34 36.0 ATTACHED 21 25 31 24.0 8 8 16 100.0 18 36 100.0 APARTMENTS 44 42 31 -26.2 23 19 22 15.8 56 57 1.8 PORT COQUITLAM DETACHED 54 38 48 26.3 16 25 28 12.0 46 75 63.0 ATTACHED 39 36 35 -2.8 19 18 30 66.7 44 63 43.2 APARTMENTS 74 49 58 18.4 24 40 38 -5.0 61 101 65.6 RICHMOND DETACHED 224 144 138 -4.2 54 52 97 86.5 120 201 67.5 ATTACHED 144 113 110 -2.7 30 59 73 23.7 84 195 132.1 APARTMENTS 302 243 274 12.8 94 136 165 21.3 249 402 61.4 SUNSHINE COAST DETACHED 115 77 78 1.3 38 31 44 41.9 93 96 3.2 ATTACHED 14 16 17 6.3 2 2 11 450.0 14 17 21.4 APARTMENTS 28 15 11 -26.7 11 8 3 -62.5 19 14 -26.3 SQUAMISH DETACHED 42 36 39 8.3 16 15 18 20.0 40 45 12.5 ATTACHED 18 23 21 -8.7 19 16 10 -37.5 45 32 -28.9 APARTMENTS 19 18 25 38.9 14 16 7 -56.3 27 34 25.9 VANCOUVER EAST DETACHED 210 157 188 19.7 53 86 109 26.7 151 248 64.2 ATTACHED 65 70 59 -15.7 28 38 47 23.7 72 115 59.7 APARTMENTS 226 210 215 2.4 93 118 136 15.3 222 332 49.5 VANCOUVER WEST DETACHED 188 131 151 15.3 64 62 106 71.0 141 203 44.0 ATTACHED 113 86 90 4.7 34 43 52 20.9 78 125 60.3 APARTMENTS 688 492 599 21.7 235 261 308 18.0 554 779 40.6 WHISTLER/PEMBERTON DETACHED 21 25 22 -12.0 11 10 12 20.0 30 29 -3.3 ATTACHED 36 25 33 32.0 20 14 10 -28.6 41 43 4.9 APARTMENTS 35 45 40 -11.1 23 18 16 -11.1 58 52 -10.3 WEST VANCOUVER/HOWE SOUND DETACHED 120 100 109 9.0 23 45 41 -8.9 66 107 62.1 ATTACHED 12 11 16 45.5 3 3 6 100.0 7 11 57.1 APARTMENTS 30 30 41 36.7 8 7 9 28.6 26 22 -15.4 GRAND TOTALS DETACHED 1798 1312 1499 14.3 529 682 847 24.2 1305 1964 50.5 ATTACHED 854 722 751 4.0 325 404 493 22.0 807 1213 50.3 APARTMENTS 2284 1963 2174 10.7 873 1061 1179 11.1 2191 3054 39.4