Downloaded 990 times


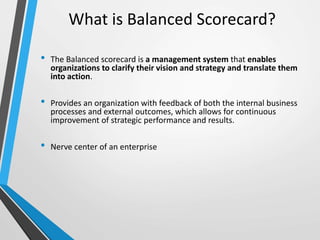
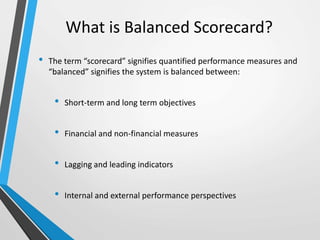
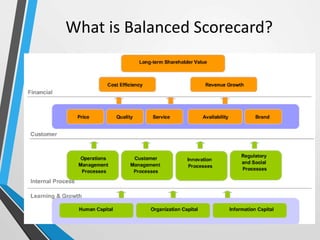
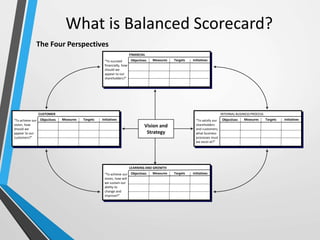
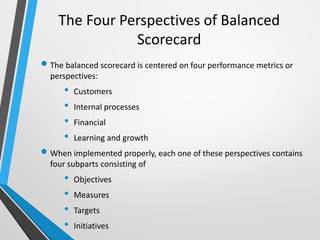

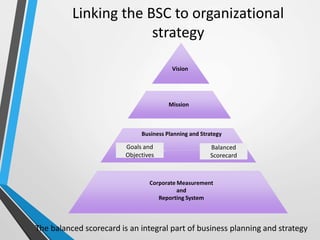
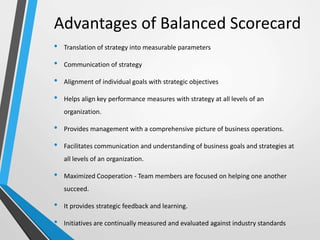
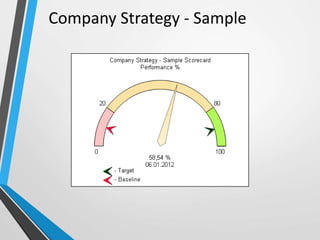
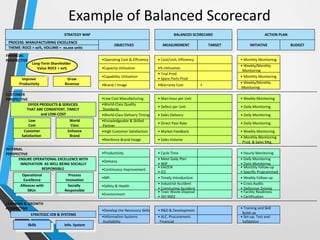


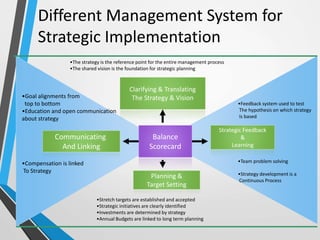


The balanced scorecard is a management system that helps organizations translate their vision and strategy into actionable objectives, while providing feedback on both internal processes and external outcomes for continuous improvement. It encompasses four key perspectives: financial, customer, internal business processes, and learning and growth, each with specific objectives, measures, targets, and initiatives to align with strategic goals. This framework enhances communication, cooperation, and strategic feedback, ensuring performance metrics are linked to organizational strategies and fostering overall business efficacy.