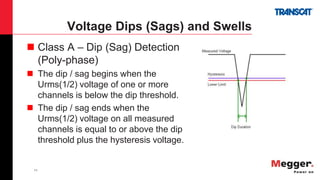
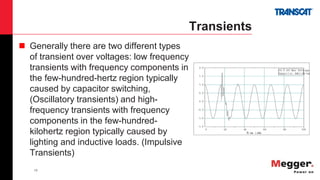
1
Power Quality
Basics
Presented by: Jason Huneycutt
2
Power Quality
 What is Power Quality?
 The concept of powering and grounding sensitive equipment
in a manner that is suitable to the operation of that equipment.
3
Introduction
 The modern power grid is changing.
 The addition of green energy sources
• Solar
• Wind energy
 The reduction of coal bulk generation plants
 As loads increase coupled with the intermittent nature of solar
and wind energy the voltage stability will suffer.
 New technologies such as, electric vehicles are adding new
loads to the grid which, can lead to altered peak hours.
 The implementation of the smart grid technology which is
designed to makes the grid more efficient.
4
Smart Grid
 Will smart grid reduce power quality issues, making power
quality investigations rare?
 No!
• The smart grid will increase grid reliability not the quality of the
power being delivered.
 As technology advances there will always be new types of loads
and sources added to the grid. This will always create new power
quality challenges.
 The most common power quality issues faced today include sags
and swells, transients, unbalance as well as harmonics.
5
Types of Power Quality
Phenomenon
 Under-Voltage
 Over-Voltage
 Dips (Sags) and Swells
 Transients
 Unbalance
 Flicker
 Harmonics (THD/TDD)
 RVC
6
Under-voltage
 An under-voltage is a decrease in RMS voltage less than 0.9
pu (percentile unit) for a duration longer than 1 min.
• Typical values are between 0.8 pu and 0.9 pu.
 Under-voltages are caused by loads switching on, or capacitor
banks switching off.
 The under-voltage can continue until voltage regulation
equipment on the system can bring the voltage back within
tolerances.
 Overloaded circuits can also result in under-voltages.
7
Over-voltage
 An over-voltage is an RMS increase in ac voltage greater than
1.1 pu for a duration longer than 1 min.
• Typical values are 1.1 pu to 1.2 pu.
 Over-voltages can be the result of the following:
• Load switching (switching off a large loads such as motors)
• Variations in the reactive compensation (switching of cap
banks).
• Solar Panels
• Poor system voltage regulation capabilities or controls.
• Incorrect tap settings on transformers
8
Voltage Dips (Sags) and Swells
 Voltage sags and swells are two of the most common power
quality events. Voltage Sags and Swells cannot be prevented
on the power system. As impedances change during the
course of a day the voltage will momentarily change as well.
 Even instantaneous short duration sags can cause process
shutdowns requiring hours to re-start.
 Voltage swells are one of the most common cause of tripping
breakers.
 The malfunction or failure of this equipment can cause large
financial losses to various manufacturers.
9
Voltage Dips (Sags) and Swells
 Common Causes of voltage sags include source voltage
changes, inrush currents as well as inadequate wiring.
 Common Causes of voltage swells can include load switching,
utility faults, and damaged or loose neutral connections.
 Another Common Cause includes the wrong voltage for
equipment in use coming into the building. These wrong
voltages can include 230volt equipment being fed from 208 volts
or vice versa, 460 volt equipment being fed from 480 volts.
 The goal of power quality is to limit the number of sags and
swells as well as the magnitude of these events such that they
do not cause equipment malfunction or failure.
10
Voltage Dips (Sags) and Swells
 On single-phase systems a voltage dip
begins when the Urms(1/2) voltage
falls below the dip / sag threshold.
 The event ends when the Urms(1/2)
voltage is equal to or above the dip
threshold plus the hysteresis voltage.
Note This value is used only for
voltage dip (sags), swells, interruption,
and RVC detection and evaluation.
11
Voltage Dips (Sags) and Swells
 Class A – Dip (Sag) Detection
(Poly-phase)
 The dip / sag begins when the
Urms(1/2) voltage of one or more
channels is below the dip threshold.
 The dip / sag ends when the
Urms(1/2) voltage on all measured
channels is equal to or above the dip
threshold plus the hysteresis voltage.
12
Voltage Dips (Sags) and Swells
 Class A – Swell Detection
 On single-phase systems a swell begins when the Urms(1/2)
voltage rises above the swell threshold,
 The swell ends when the Urms(1/2) voltage is equal to or below
the swell threshold minus the hysteresis voltage.
 On poly-phase systems a swell begins when the Urms(1/2)
voltage of one or more channel rises above the swell threshold.
 The swell ends when the Urms(1/2) voltage on all measured
channels is equal to or below the swell threshold minus the
hysteresis voltage
13
Transients
 Generally there are two different types
of transient over voltages: low frequency
transients with frequency components in
the few-hundred-hertz region typically
caused by capacitor switching,
(Oscillatory transients) and high-
frequency transients with frequency
components in the few-hundred-
kilohertz region typically caused by
lighting and inductive loads. (Impulsive
Transients)
14
Transients
 Transient voltages can result in degradation or immediate
dielectric failure in all classes of equipment.
 High magnitude and fast rise time contribute to insulation
breakdown in electrical equipment like switchgear,
transformers and motors.
 Repeated lower magnitude application of transients to
equipment can cause slow degradation and eventual insulation
failure, decreasing equipment mean time between failures.
15
Transients
 Transients can damage insulation
because insulation, like that in
wires has capacitive properties.
 Both capacitors and wires have
two conductors separated by an
insulator.
 The capacitance provides a path
for a transient pulse.
 If the transient pulse has enough
energy it will damage that section
of insulation.
16
Transients
 This can be understood by
examining the basic formula
for Capacitive Reactance.
 It can now be seen that as
the value of the frequency
increases, the lower the
reactive capacitance and
therefore the lower the
impedance path.
17
Transients
 Lightning is a major cause of
transients.
• A bolt of lightning can be over 5
miles long, reach temperatures in
excess of 20,000 degrees
Celsius.
 Lightning strikes or high
electromagnetic fields
produced by lighting can
induce voltage & current
transients in power lines &
signal carrying lines.
 These are typically seen as
unidirectional transients.
18
Transients
 When capacitor banks are
switched on there is an initial
inrush of current.
 This will lead to a low-
frequency transient that will
have a characteristic ringing.
 These types of transients are
referred to as oscillatory
transients.
 Oscillatory transients can
cause equipment to trip out
and cause UPS systems to
turn on and off erroneously.
08/12/2007 14:22:30.600 SUBCYCLE on X3-1
Time (ms)
35.48 45.12 54.76 64.40 74.04
-905.00
-354.50
196.00
746.50
1297.00
X2-3(Volts)
19
Transients
 Extremely fast transients, or EFT's, have rise and fall times in
the nanosecond region. They are caused by arcing faults, such
as bad brushes in motors, and are rapidly damped out by even
a few meters of distribution wiring. Standard line filters,
included on almost all electronic equipment, remove EFT's.
 These typically will cause issues in areas with short cable
runs, such as off shore platforms
20
Unbalance
 Unbalance is a condition in a poly-phase system in which the
RMS values of the line voltages (fundamental component), or
the phase angles between consecutive line voltages, are not
all equal per IEEE 1159 and IEC 61000-4-27.
21
Unbalance
 Voltage unbalance more
commonly emerges in
individual customer loads due
to phase load imbalances,
especially where large, single
phase power loads are used,
such as single phase arc
furnaces.
• A small unbalance in the phase
voltages can cause a large
unbalance in the phase currents.
22
Unbalance
 Unbalanced voltages can
effect equipment on the
power system, such as
induction motors and
adjustable speed drives. In
addition unbalance voltages
can cause heating effects in
transformers and neutral
lines.
23
Unbalance
 Voltage unbalance can be
described as a set of
symmetrical components.
• In a balanced three phase system
the three line-neutral voltages are
equal in magnitude and phase
and are displaced from each
other by 120 degrees.
 Any change in voltage
magnitudes and/or a shift in
the phase will cause an
unbalanced
24
Flicker
 Flicker is a very specific
problem related to human
perception and
incandescent light bulbs. It
is not a general term for
voltage variations.
25
Flicker
 Humans can be very
sensitive to light flicker that
is caused by voltage
fluctuations.
 Human perception of light
flicker is almost always the
limiting criteria for
controlling small voltage
fluctuations.
26
Flicker
 The figure illustrates the
level of perception of light
flicker from a 60 watt
incandescent bulb for
rectangular variations. The
sensitivity is a function of
the frequency of the
fluctuations and it is also
dependent on the voltage
level of the lighting.
27
Flicker
 In general today, flicker is measured using the IEC method.
• (IEC61000-4-15)
 In this method we take the instantaneous voltage and compare it to a
rolling average voltage.
 The deviation between these two is multiplied by a value in a
weighted curve.
 This curve is based on the sensitivity of the human eye at 120V 60Hz
or 230V 50Hz.
 The end value is called a percentile unit. The percentile units go
through a statistical analysis in order to calculate 2 values.
28
Flicker
 Short Term flicker or Pst; is
calculated based on the
Flicker percentile unit.
 Pst is based on a 10 minute
interval.
 Long Term flicker or Plt; is
calculated based on the
Pst.
 Plt is based on a 2 hour
interval.
29
Flicker
 The basic criteria is simple. If the
Pst is less than 1.0 then flicker
levels are good. If Pst is greater
than 1.0 then the flicker levels
could be causing irritation.
 This applies to incandescent
lighting ONLY. Other types of
lighting cannot be tested using
this curve.
 Since it uses a weighting curve it
applies only to 120V 60Hz and
230V 50Hz.
30
Harmonics
 Harmonics are a sinusoidal
component of periodic
waves that have
frequencies that are
multiples of the
fundamental frequency
 Harmonics can cause many
problems, such as:
• Neutral wires to over heat
• Motors to overheat
• Transformers to overheat
• Electronic Failures
31
Harmonics
 IEEE 519 Defines a harmonic:
• A component of order greater than one of the Fourier series of a
periodic quantity.
– For example, in a 60 Hz system, the harmonic order 3, also
known as the “third harmonic,” is 180 Hz.
 IEC 61000-4-30 Defines a harmonic frequency as a frequency
which is an integer multiple of the fundamental frequency
 IEC 61000-4-30 Defines a harmonic component as any of the
components having a harmonic frequency
32
Harmonics
 Linear Loads such as
incandescent light and
motors draw current equally
throughout the waveform.
 Non-Linear loads such as
switching power supplies
draw current only at the
peaks of the wave.
 It is these non linear loads
that cause harmonics.
33
Harmonics
 Typically current harmonics
will not propagate through a
system.
 Voltage harmonics will
propagate through a
system, as they will pass
through transformers.
 When non-linear loads get
high enough they can
cause harmonics in the
voltage.
34
Harmonics
 Harmonics can be characterized based on
their order.
 Odd Harmonics are harmonics with odd order
numbers.
 Even Harmonics are harmonics with even
order numbers.
• Non-symmetrical due to faulty rectifiers.
 Triplens are odd harmonics that are multiples
of 3.
• These will not cancel out and will add and cause high
neutral currents.
35
Harmonics
 Harmonics can characterized in different sequences, based on the
rotation of their magnetic field.
 Positive sequence harmonics create a magnetic field in the
direction of rotation. The fundamental frequency is considered to be
a positive sequence harmonic.
 Negative sequence harmonics develop magnetic fields in the
opposite direction of rotation. This reduces torque and increases the
current required for motor loads.
 Zero sequence harmonics create a single-phase signal that does
not produce a rotating magnetic field of any kind. These harmonics
can increase overall current demand and generate heat.
36
Harmonics
 In three-phase systems, the fundamental currents will cancel
each other out, add up to zero amps in the neutral line.
 Zero sequence harmonic (such as the third harmonic) will be in
phase with the other currents of the three-phase system.
 Since they are in phase they will sum together and can lead to
high neutral currents.
37
Harmonics
 The positive, negative, and zero
sequence harmonics run in
sequential order (positive,
negative, and then zero).Since
the fundamental frequency is
positive, this means that the
second order harmonic is a
negative sequence harmonic.
The third harmonic is a zero
sequence harmonic.
38
THD
 Total harmonic distortion (THD) is the measure of the sum of the
harmonic components of a distorted waveform.
 THD can be calculated for either current or voltage.
 THD is the RMS (root-mean-square) sum of the harmonics,
divided by one of two values: either the fundamental value, or the
RMS value of the total waveform.
 THD is typically, represented as a percentage of fundamental
amplitude
THD =
𝑆𝑢𝑚 𝑜𝑓 𝑡ℎ𝑒 𝑠𝑞𝑢𝑎𝑟𝑒𝑠 𝑜𝑓 𝑡ℎ𝑒 𝑎𝑚𝑝𝑙𝑖𝑡𝑢𝑑𝑒 𝑜𝑓 𝑎𝑙𝑙 𝑡ℎ𝑒 ℎ𝑎𝑟𝑚𝑜𝑛𝑖𝑐 𝑜𝑟𝑑𝑒𝑟𝑠
𝑆𝑞𝑢𝑎𝑟𝑒 𝑜𝑓 𝑡ℎ𝑒 𝑎𝑚𝑝𝑙𝑖𝑡𝑢𝑑𝑒 𝑜𝑓 𝑡ℎ𝑒 𝑓𝑢𝑛𝑑𝑎𝑚𝑒𝑛𝑡𝑎𝑙 𝑣𝑎𝑙𝑢𝑒
x 100%
39
THD
 THD can be misleading when analyzing current harmonics.
 THD can be referenced to the amplitude of the fundamental.
 The voltage fundamental value is always present in non-faulted
conditions.
 Not necessarily true for current.
 The current amplitude will fluctuate with the loads impedance.
• As loads turn off, the fundamental current amplitude decreases.
 If the current being drawn by the load is low (near zero) then the THD
value will appear to be very high.
40
THD
 If the total harmonic current is 0.2A and the fundamental current
being drawn by the load is 200A then the THD will equal 3.16%
 THD =
0.2
200
x 100 = 3.16%
 If the fundamental current being drawn by the load then drops to
200mA then the THD will equal 100%
 THD =
0.2
0.200
x 100 = 100%
 This is deceiving because the current THD level appears to be
high, but this is only because there is little to no current being
drawn.
41
TDD
 Total demand distortion (TDD) measurements should be used for
total current harmonic measurements.
 The total demand distortion references the total root-sum-square
harmonic current distortion, to the maximum average demand
current recorded during the test interval.
 Therefore, the reference value is the same throughout the test
interval and it is a valid value.
 Total Demand Distortion should be calculated in accordance with
the IEEE 519 document: “Recommended Practices and
Requirements for Harmonic Control in Electrical Power
Systems”), published by the IEEE Standards Association.
42
THD & TDD
 The power quality industry has developed certain index values to
assess the distortion caused by the presence of harmonics.
 The two values most frequently indexed are total harmonic
distortion and total demand distortion.
 Individual harmonic values are also indexed in different
specifications, such as the North American IEEE 519 document
and the European Standard EN50160 on power quality; issue by
the European Committee for Electrotechnical Standardization
(CENELEC).
43
RVC
 A rapid voltage change (RVC) is a fast rise
or fall of the RMS voltage.
 RVC events cause mainly changes in
lighting and will normally not bring damage
to electrical equipment.
• A reduction in the voltage by 10% can
result in a 34% reduction in the light
intensity from a 60 W incandescent lamp.
 Residential households are most
commonly affected, especially in weak
networks.
 This is seen as a lighting continuously
changing in intensity.
44
RVC
 RVC Events can be caused
by the switching on of a
specific load or by a sudden
change in source voltage.
 Sudden source voltage
changes can occur in solar
grids when the sun is
obscured by clouds.
 Source voltage changes can
also occur in wind farms
when then wind speed
decreases.
45
RVC
 An RVC event starts with a steep down-
going step followed by an up-going ramp
ending at a voltage value less than that
existing before the switching.
• The fall time can be as short as 10 ms,
while the recovery ramp can last several
cycles.
 NOTE: for an event to be classified as a
rapid voltage change the voltage must
not fall below the lower voltage limit.
• If the voltage did fall below the lower
tolerance limit then the event would be
classified as a voltage dip (sag).
Questions or Comments?
Email Nicole VanWert-Quinzi
nicole.vanwert@Transcat.com
Transcat: 800-800-5001
www.Transcat.com
For related product information, go to:
www.Transcat.com/Megger
47
Questions?
Power on
At Megger, we understand that keeping the power on is essential for the success
of your business. That is why we are dedicated to creating, designing and
manufacturing safe, reliable, easy-to-use portable test equipment backed by world-
leading support and expertise.
We can assist your acceptance, commissioning and maintenance testing for
predictive, diagnostic or routine purposes. By working closely with electrical
utilities, standards bodies and technical institutions, we contribute to the
dependability and advancement of the electrical supply industry.

Transcat and Megger: Power Quality 101 Webinar

  • 1.
  • 2.
    2 Power Quality  Whatis Power Quality?  The concept of powering and grounding sensitive equipment in a manner that is suitable to the operation of that equipment.
  • 3.
    3 Introduction  The modernpower grid is changing.  The addition of green energy sources • Solar • Wind energy  The reduction of coal bulk generation plants  As loads increase coupled with the intermittent nature of solar and wind energy the voltage stability will suffer.  New technologies such as, electric vehicles are adding new loads to the grid which, can lead to altered peak hours.  The implementation of the smart grid technology which is designed to makes the grid more efficient.
  • 4.
    4 Smart Grid  Willsmart grid reduce power quality issues, making power quality investigations rare?  No! • The smart grid will increase grid reliability not the quality of the power being delivered.  As technology advances there will always be new types of loads and sources added to the grid. This will always create new power quality challenges.  The most common power quality issues faced today include sags and swells, transients, unbalance as well as harmonics.
  • 5.
    5 Types of PowerQuality Phenomenon  Under-Voltage  Over-Voltage  Dips (Sags) and Swells  Transients  Unbalance  Flicker  Harmonics (THD/TDD)  RVC
  • 6.
    6 Under-voltage  An under-voltageis a decrease in RMS voltage less than 0.9 pu (percentile unit) for a duration longer than 1 min. • Typical values are between 0.8 pu and 0.9 pu.  Under-voltages are caused by loads switching on, or capacitor banks switching off.  The under-voltage can continue until voltage regulation equipment on the system can bring the voltage back within tolerances.  Overloaded circuits can also result in under-voltages.
  • 7.
    7 Over-voltage  An over-voltageis an RMS increase in ac voltage greater than 1.1 pu for a duration longer than 1 min. • Typical values are 1.1 pu to 1.2 pu.  Over-voltages can be the result of the following: • Load switching (switching off a large loads such as motors) • Variations in the reactive compensation (switching of cap banks). • Solar Panels • Poor system voltage regulation capabilities or controls. • Incorrect tap settings on transformers
  • 8.
    8 Voltage Dips (Sags)and Swells  Voltage sags and swells are two of the most common power quality events. Voltage Sags and Swells cannot be prevented on the power system. As impedances change during the course of a day the voltage will momentarily change as well.  Even instantaneous short duration sags can cause process shutdowns requiring hours to re-start.  Voltage swells are one of the most common cause of tripping breakers.  The malfunction or failure of this equipment can cause large financial losses to various manufacturers.
  • 9.
    9 Voltage Dips (Sags)and Swells  Common Causes of voltage sags include source voltage changes, inrush currents as well as inadequate wiring.  Common Causes of voltage swells can include load switching, utility faults, and damaged or loose neutral connections.  Another Common Cause includes the wrong voltage for equipment in use coming into the building. These wrong voltages can include 230volt equipment being fed from 208 volts or vice versa, 460 volt equipment being fed from 480 volts.  The goal of power quality is to limit the number of sags and swells as well as the magnitude of these events such that they do not cause equipment malfunction or failure.
  • 10.
    10 Voltage Dips (Sags)and Swells  On single-phase systems a voltage dip begins when the Urms(1/2) voltage falls below the dip / sag threshold.  The event ends when the Urms(1/2) voltage is equal to or above the dip threshold plus the hysteresis voltage. Note This value is used only for voltage dip (sags), swells, interruption, and RVC detection and evaluation.
  • 11.
    11 Voltage Dips (Sags)and Swells  Class A – Dip (Sag) Detection (Poly-phase)  The dip / sag begins when the Urms(1/2) voltage of one or more channels is below the dip threshold.  The dip / sag ends when the Urms(1/2) voltage on all measured channels is equal to or above the dip threshold plus the hysteresis voltage.
  • 12.
    12 Voltage Dips (Sags)and Swells  Class A – Swell Detection  On single-phase systems a swell begins when the Urms(1/2) voltage rises above the swell threshold,  The swell ends when the Urms(1/2) voltage is equal to or below the swell threshold minus the hysteresis voltage.  On poly-phase systems a swell begins when the Urms(1/2) voltage of one or more channel rises above the swell threshold.  The swell ends when the Urms(1/2) voltage on all measured channels is equal to or below the swell threshold minus the hysteresis voltage
  • 13.
    13 Transients  Generally thereare two different types of transient over voltages: low frequency transients with frequency components in the few-hundred-hertz region typically caused by capacitor switching, (Oscillatory transients) and high- frequency transients with frequency components in the few-hundred- kilohertz region typically caused by lighting and inductive loads. (Impulsive Transients)
  • 14.
    14 Transients  Transient voltagescan result in degradation or immediate dielectric failure in all classes of equipment.  High magnitude and fast rise time contribute to insulation breakdown in electrical equipment like switchgear, transformers and motors.  Repeated lower magnitude application of transients to equipment can cause slow degradation and eventual insulation failure, decreasing equipment mean time between failures.
  • 15.
    15 Transients  Transients candamage insulation because insulation, like that in wires has capacitive properties.  Both capacitors and wires have two conductors separated by an insulator.  The capacitance provides a path for a transient pulse.  If the transient pulse has enough energy it will damage that section of insulation.
  • 16.
    16 Transients  This canbe understood by examining the basic formula for Capacitive Reactance.  It can now be seen that as the value of the frequency increases, the lower the reactive capacitance and therefore the lower the impedance path.
  • 17.
    17 Transients  Lightning isa major cause of transients. • A bolt of lightning can be over 5 miles long, reach temperatures in excess of 20,000 degrees Celsius.  Lightning strikes or high electromagnetic fields produced by lighting can induce voltage & current transients in power lines & signal carrying lines.  These are typically seen as unidirectional transients.
  • 18.
    18 Transients  When capacitorbanks are switched on there is an initial inrush of current.  This will lead to a low- frequency transient that will have a characteristic ringing.  These types of transients are referred to as oscillatory transients.  Oscillatory transients can cause equipment to trip out and cause UPS systems to turn on and off erroneously. 08/12/2007 14:22:30.600 SUBCYCLE on X3-1 Time (ms) 35.48 45.12 54.76 64.40 74.04 -905.00 -354.50 196.00 746.50 1297.00 X2-3(Volts)
  • 19.
    19 Transients  Extremely fasttransients, or EFT's, have rise and fall times in the nanosecond region. They are caused by arcing faults, such as bad brushes in motors, and are rapidly damped out by even a few meters of distribution wiring. Standard line filters, included on almost all electronic equipment, remove EFT's.  These typically will cause issues in areas with short cable runs, such as off shore platforms
  • 20.
    20 Unbalance  Unbalance isa condition in a poly-phase system in which the RMS values of the line voltages (fundamental component), or the phase angles between consecutive line voltages, are not all equal per IEEE 1159 and IEC 61000-4-27.
  • 21.
    21 Unbalance  Voltage unbalancemore commonly emerges in individual customer loads due to phase load imbalances, especially where large, single phase power loads are used, such as single phase arc furnaces. • A small unbalance in the phase voltages can cause a large unbalance in the phase currents.
  • 22.
    22 Unbalance  Unbalanced voltagescan effect equipment on the power system, such as induction motors and adjustable speed drives. In addition unbalance voltages can cause heating effects in transformers and neutral lines.
  • 23.
    23 Unbalance  Voltage unbalancecan be described as a set of symmetrical components. • In a balanced three phase system the three line-neutral voltages are equal in magnitude and phase and are displaced from each other by 120 degrees.  Any change in voltage magnitudes and/or a shift in the phase will cause an unbalanced
  • 24.
    24 Flicker  Flicker isa very specific problem related to human perception and incandescent light bulbs. It is not a general term for voltage variations.
  • 25.
    25 Flicker  Humans canbe very sensitive to light flicker that is caused by voltage fluctuations.  Human perception of light flicker is almost always the limiting criteria for controlling small voltage fluctuations.
  • 26.
    26 Flicker  The figureillustrates the level of perception of light flicker from a 60 watt incandescent bulb for rectangular variations. The sensitivity is a function of the frequency of the fluctuations and it is also dependent on the voltage level of the lighting.
  • 27.
    27 Flicker  In generaltoday, flicker is measured using the IEC method. • (IEC61000-4-15)  In this method we take the instantaneous voltage and compare it to a rolling average voltage.  The deviation between these two is multiplied by a value in a weighted curve.  This curve is based on the sensitivity of the human eye at 120V 60Hz or 230V 50Hz.  The end value is called a percentile unit. The percentile units go through a statistical analysis in order to calculate 2 values.
  • 28.
    28 Flicker  Short Termflicker or Pst; is calculated based on the Flicker percentile unit.  Pst is based on a 10 minute interval.  Long Term flicker or Plt; is calculated based on the Pst.  Plt is based on a 2 hour interval.
  • 29.
    29 Flicker  The basiccriteria is simple. If the Pst is less than 1.0 then flicker levels are good. If Pst is greater than 1.0 then the flicker levels could be causing irritation.  This applies to incandescent lighting ONLY. Other types of lighting cannot be tested using this curve.  Since it uses a weighting curve it applies only to 120V 60Hz and 230V 50Hz.
  • 30.
    30 Harmonics  Harmonics area sinusoidal component of periodic waves that have frequencies that are multiples of the fundamental frequency  Harmonics can cause many problems, such as: • Neutral wires to over heat • Motors to overheat • Transformers to overheat • Electronic Failures
  • 31.
    31 Harmonics  IEEE 519Defines a harmonic: • A component of order greater than one of the Fourier series of a periodic quantity. – For example, in a 60 Hz system, the harmonic order 3, also known as the “third harmonic,” is 180 Hz.  IEC 61000-4-30 Defines a harmonic frequency as a frequency which is an integer multiple of the fundamental frequency  IEC 61000-4-30 Defines a harmonic component as any of the components having a harmonic frequency
  • 32.
    32 Harmonics  Linear Loadssuch as incandescent light and motors draw current equally throughout the waveform.  Non-Linear loads such as switching power supplies draw current only at the peaks of the wave.  It is these non linear loads that cause harmonics.
  • 33.
    33 Harmonics  Typically currentharmonics will not propagate through a system.  Voltage harmonics will propagate through a system, as they will pass through transformers.  When non-linear loads get high enough they can cause harmonics in the voltage.
  • 34.
    34 Harmonics  Harmonics canbe characterized based on their order.  Odd Harmonics are harmonics with odd order numbers.  Even Harmonics are harmonics with even order numbers. • Non-symmetrical due to faulty rectifiers.  Triplens are odd harmonics that are multiples of 3. • These will not cancel out and will add and cause high neutral currents.
  • 35.
    35 Harmonics  Harmonics cancharacterized in different sequences, based on the rotation of their magnetic field.  Positive sequence harmonics create a magnetic field in the direction of rotation. The fundamental frequency is considered to be a positive sequence harmonic.  Negative sequence harmonics develop magnetic fields in the opposite direction of rotation. This reduces torque and increases the current required for motor loads.  Zero sequence harmonics create a single-phase signal that does not produce a rotating magnetic field of any kind. These harmonics can increase overall current demand and generate heat.
  • 36.
    36 Harmonics  In three-phasesystems, the fundamental currents will cancel each other out, add up to zero amps in the neutral line.  Zero sequence harmonic (such as the third harmonic) will be in phase with the other currents of the three-phase system.  Since they are in phase they will sum together and can lead to high neutral currents.
  • 37.
    37 Harmonics  The positive,negative, and zero sequence harmonics run in sequential order (positive, negative, and then zero).Since the fundamental frequency is positive, this means that the second order harmonic is a negative sequence harmonic. The third harmonic is a zero sequence harmonic.
  • 38.
    38 THD  Total harmonicdistortion (THD) is the measure of the sum of the harmonic components of a distorted waveform.  THD can be calculated for either current or voltage.  THD is the RMS (root-mean-square) sum of the harmonics, divided by one of two values: either the fundamental value, or the RMS value of the total waveform.  THD is typically, represented as a percentage of fundamental amplitude THD = 𝑆𝑢𝑚 𝑜𝑓 𝑡ℎ𝑒 𝑠𝑞𝑢𝑎𝑟𝑒𝑠 𝑜𝑓 𝑡ℎ𝑒 𝑎𝑚𝑝𝑙𝑖𝑡𝑢𝑑𝑒 𝑜𝑓 𝑎𝑙𝑙 𝑡ℎ𝑒 ℎ𝑎𝑟𝑚𝑜𝑛𝑖𝑐 𝑜𝑟𝑑𝑒𝑟𝑠 𝑆𝑞𝑢𝑎𝑟𝑒 𝑜𝑓 𝑡ℎ𝑒 𝑎𝑚𝑝𝑙𝑖𝑡𝑢𝑑𝑒 𝑜𝑓 𝑡ℎ𝑒 𝑓𝑢𝑛𝑑𝑎𝑚𝑒𝑛𝑡𝑎𝑙 𝑣𝑎𝑙𝑢𝑒 x 100%
  • 39.
    39 THD  THD canbe misleading when analyzing current harmonics.  THD can be referenced to the amplitude of the fundamental.  The voltage fundamental value is always present in non-faulted conditions.  Not necessarily true for current.  The current amplitude will fluctuate with the loads impedance. • As loads turn off, the fundamental current amplitude decreases.  If the current being drawn by the load is low (near zero) then the THD value will appear to be very high.
  • 40.
    40 THD  If thetotal harmonic current is 0.2A and the fundamental current being drawn by the load is 200A then the THD will equal 3.16%  THD = 0.2 200 x 100 = 3.16%  If the fundamental current being drawn by the load then drops to 200mA then the THD will equal 100%  THD = 0.2 0.200 x 100 = 100%  This is deceiving because the current THD level appears to be high, but this is only because there is little to no current being drawn.
  • 41.
    41 TDD  Total demanddistortion (TDD) measurements should be used for total current harmonic measurements.  The total demand distortion references the total root-sum-square harmonic current distortion, to the maximum average demand current recorded during the test interval.  Therefore, the reference value is the same throughout the test interval and it is a valid value.  Total Demand Distortion should be calculated in accordance with the IEEE 519 document: “Recommended Practices and Requirements for Harmonic Control in Electrical Power Systems”), published by the IEEE Standards Association.
  • 42.
    42 THD & TDD The power quality industry has developed certain index values to assess the distortion caused by the presence of harmonics.  The two values most frequently indexed are total harmonic distortion and total demand distortion.  Individual harmonic values are also indexed in different specifications, such as the North American IEEE 519 document and the European Standard EN50160 on power quality; issue by the European Committee for Electrotechnical Standardization (CENELEC).
  • 43.
    43 RVC  A rapidvoltage change (RVC) is a fast rise or fall of the RMS voltage.  RVC events cause mainly changes in lighting and will normally not bring damage to electrical equipment. • A reduction in the voltage by 10% can result in a 34% reduction in the light intensity from a 60 W incandescent lamp.  Residential households are most commonly affected, especially in weak networks.  This is seen as a lighting continuously changing in intensity.
  • 44.
    44 RVC  RVC Eventscan be caused by the switching on of a specific load or by a sudden change in source voltage.  Sudden source voltage changes can occur in solar grids when the sun is obscured by clouds.  Source voltage changes can also occur in wind farms when then wind speed decreases.
  • 45.
    45 RVC  An RVCevent starts with a steep down- going step followed by an up-going ramp ending at a voltage value less than that existing before the switching. • The fall time can be as short as 10 ms, while the recovery ramp can last several cycles.  NOTE: for an event to be classified as a rapid voltage change the voltage must not fall below the lower voltage limit. • If the voltage did fall below the lower tolerance limit then the event would be classified as a voltage dip (sag).
  • 46.
    Questions or Comments? EmailNicole VanWert-Quinzi nicole.vanwert@Transcat.com Transcat: 800-800-5001 www.Transcat.com For related product information, go to: www.Transcat.com/Megger
  • 47.
    47 Questions? Power on At Megger,we understand that keeping the power on is essential for the success of your business. That is why we are dedicated to creating, designing and manufacturing safe, reliable, easy-to-use portable test equipment backed by world- leading support and expertise. We can assist your acceptance, commissioning and maintenance testing for predictive, diagnostic or routine purposes. By working closely with electrical utilities, standards bodies and technical institutions, we contribute to the dependability and advancement of the electrical supply industry.

Editor's Notes

  • #3 Read Slide. “Basically if your equipment does not operate properly due to the power it is receiving then this would be a power quality problem.
  • #4 The modern grid is changing. Solar and Wind sources provide inconsistent power. As clouds increases solar power is reduced. As the wind slows down wind power is reduced. This leads t rapid changes in voltage. The reduction of coal plants is causing more load on other sources, such as nuclear. In the past transmission lines were loads at only about 50%. Now with the increased loads on other sources transmission lines can be loaded up to 95%. This reduces reliability. As electric vehicles increase and smart grid grows peak loading times will change. All of theses items provide challenges to the modern grid.
  • #5 Read slide.
  • #6 Here is a list of some of the topics we will cover. Read Slide.
  • #7 Read Slide
  • #8 Solar panels can cause over voltage, with how fast they have they can switch off and on due to cloud cover
  • #9 Read Slide. When you have a manufacturing process that is time dependent, a failure could cause an entire run to be discarded. The financial losses can be significant.
  • #10 Read Slide. Always verify the equipment voltage is correct. You may find a PQ analysis is not required. As a load turns on the impedance decreases which increases the current which can cause a drop in the voltage. As a load turn off the impedance increases which can lead to a swell in the voltage.
  • #11 Read Slide. For example if the dip / sag threshold limit is 100V and the hysteresis is set to 2% then a dip / sag event will start when the Urms ½ value falls below 100V. The event will end when the Urms ½ cycle value rises above 102V. Hysteresis helps prevent the reporting of false events due to measured voltages being too close to the event threshold voltages.
  • #12 Read slide. The dip / sag detection on a polyphaser system is the same as a single phase system except all 3 phases need to be within the thresholds plus the hysteresis. A standard hysteresis value is 2%.
  • #13 Read Slide
  • #14 Read Slide
  • #15 Read Slide
  • #16 Read Slide
  • #17 Read Slide. The lower the impedance of the path the more current will flow and will breakdown the insulation.
  • #18 Although lighting is a major cause of unidirectional transients; another cause of unidirectional transients is equipment switching.
  • #19 UPS banks are made to switch quickly. If they are too sensitive these oscillatory transients will cause them to turn on and off multiple times per day. Typically turning down the sensitivity on the UPS will fix this issue.
  • #20 In large networks these will seldom if ever cause a problem due to the long cable runs. Where these can become issues is in areas with small cable runs, such as off shore oil platforms as well as mines.
  • #21 Read Slide. This can be either due to magnitude variations between phases or phase angle variations.
  • #22 Read Slide
  • #23 Read Slide
  • #24 Read Slide
  • #25 Read Slide. Flicker refers to how we visually see rapid variations in lighting.
  • #26 Read Slide. Lighting variations at different frequencies are perceived differently by the human eye.
  • #27 Read Slide. The human eye is most sensitive to incandescent lamp flicker at a rate of 8Hz. At this rate a very small change in voltage is required to create a perceptible change in illumination. As the frequency goes up or down a geater change in voltage is required to create a perceptible change in illumination. Above 30Hz the human eye does not even perceive flicker changes.
  • #28 Read Slide.
  • #29 Read Slide.
  • #30 Read Slide. In short if the Pst does not exceed 1.0 then the amount of light flicker from an incandescent lamp should not be perceivable. The same is true for Plt values below 0.8.
  • #31 Read Slide.
  • #32 Read Slide.
  • #33 Read Slide. Non-linear loads that draw power at the peak of the wave create more efficient power sources but in sufficient enough quantity can create harmonic issues.
  • #34 Read Slide. In this example we see “flat topping” of the voltage waveform. The current draw at the peak of the wave is too high for the transformer to deliver. Thus the voltage at the peak of the wave is reduced.
  • #35 Read Slide. Odd harmonics are typical. Even harmonics are not typically seen and can be an indication of faulty equipment. Since triplens do not cancel out they can create vary large neutral currents. Neutral wires use to be smaller than the main wires. Now we see the neutral wires are typically larger than the main wires. This is to accommodate the potentially high neutral currents.
  • #36 Read Slide.
  • #37 Read Slide.
  • #38 Read Slide.
  • #39 Read Slide.
  • #40 Read Slide.
  • #41 Read Slide.
  • #42 Read Slide. Some utilities will have a standard TDD value they use as a reference. This makes it easier to compare TDD values from different recordings.
  • #43 Read Slide.
  • #44 Read Slide. This can effect both incandescent and non-incandescent lighting.
  • #45 Read Slide.
  • #46 Read Slide.