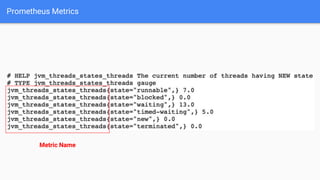
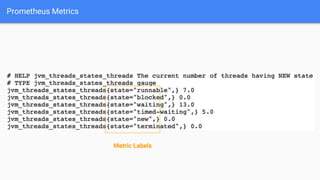
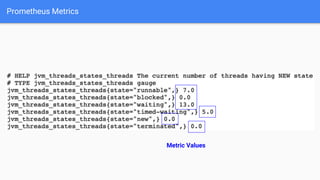
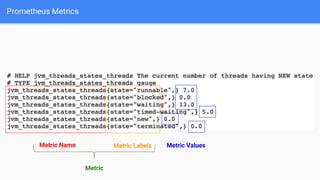
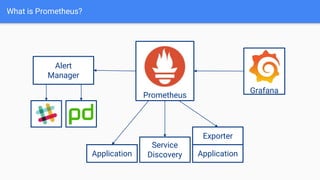
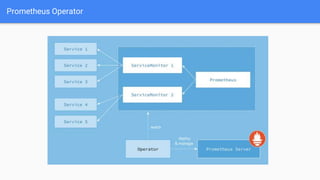
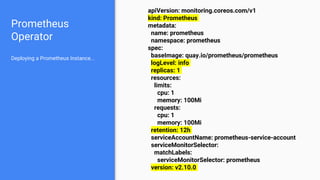
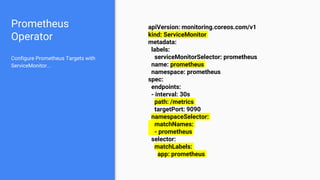
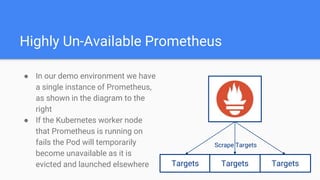
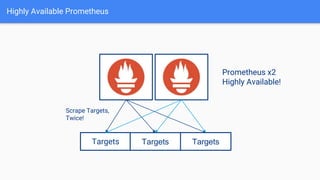
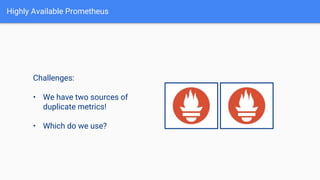
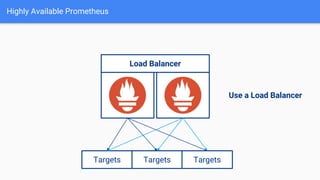
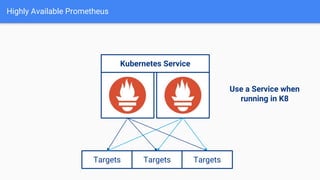
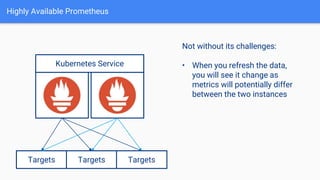
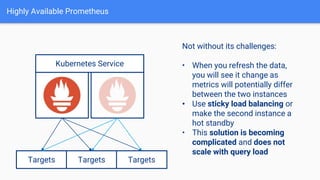
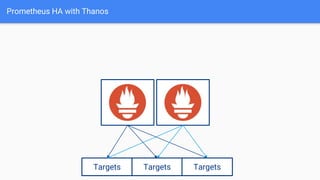
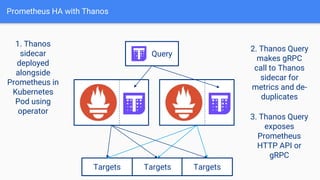
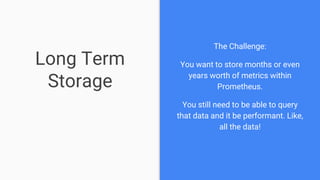
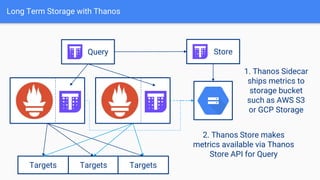
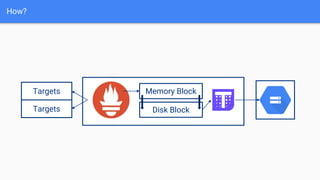
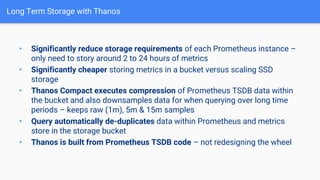
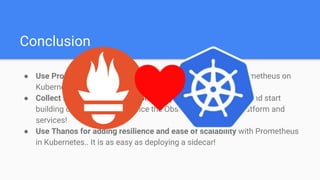
Prometheus in Practice:
High Availability with Thanos
Tom Riley
DevOpsDays Edinburgh 2019
About Me
● Tom Riley
● Infrastructure @ Nuance
● Previously Booking.com
● Co-Organiser Cloud Native
+ Kubernetes Manchester
Today
● Introduction to Prometheus
● Monitoring Kubernetes
● High Availability Prometheus
● Long Term Storage for
Prometheus
What is Prometheus?
● Prometheus is a metrics oriented Monitoring solution (TSDB & Tooling)
● Released by SoundCloud in 2012
● Prometheus project joined Cloud Native Computing Foundation in 2016
● During 2018, become the second project to graduate from incubation
alongside Kubernetes
What is Prometheus?
Prometheus
Application
Prometheus Metrics
Prometheus Metrics
Metric Name
Prometheus Metrics
Metric Labels
Prometheus Metrics
Metric Values
Prometheus Metrics
Metric Name Metric Labels Metric Values
Metric
What is Prometheus?
Prometheus
Application
Service
Discovery Application
Exporter
Alert
Manager
Grafana
Demo
Environment
1. Kubernetes on my laptop using
KIND
2. Prometheus Operator
3. Monitoring Kubernetes via:
Kube-state-metrics
Node Exporter
Kubelet & cAdvisor
4. Grafana Dashboards
Prometheus Operator
Prometheus
Operator
apiVersion: monitoring.coreos.com/v1
kind: Prometheus
metadata:
name: prometheus
namespace: prometheus
spec:
baseImage: quay.io/prometheus/prometheus
logLevel: info
replicas: 1
resources:
limits:
cpu: 1
memory: 100Mi
requests:
cpu: 1
memory: 100Mi
retention: 12h
serviceAccountName: prometheus-service-account
serviceMonitorSelector:
matchLabels:
serviceMonitorSelector: prometheus
version: v2.10.0
Deploying a Prometheus Instance...
Prometheus
Operator
apiVersion: monitoring.coreos.com/v1
kind: ServiceMonitor
metadata:
labels:
serviceMonitorSelector: prometheus
name: prometheus
namespace: prometheus
spec:
endpoints:
- interval: 30s
path: /metrics
targetPort: 9090
namespaceSelector:
matchNames:
- prometheus
selector:
matchLabels:
app: prometheus
Configure Prometheus Targets with
ServiceMonitor...
Demo 1...
Highly Un-Available Prometheus
● In our demo environment we have
a single instance of Prometheus,
as shown in the diagram to the
right
● If the Kubernetes worker node
that Prometheus is running on
fails the Pod will temporarily
become unavailable as it is
evicted and launched elsewhere Targets Targets Targets
Scrape Targets
Highly Available Prometheus
Targets Targets Targets
Prometheus x2
Highly Available!
Scrape Targets,
Twice!
Highly Available Prometheus
Challenges:
• We have two sources of
duplicate metrics!
• Which do we use?
Highly Available Prometheus
Targets Targets Targets
Use a Load Balancer
Load Balancer
Highly Available Prometheus
Targets Targets Targets
Use a Service when
running in K8
Kubernetes Service
Demo 2...
Highly Available Prometheus
Targets Targets Targets
Not without its challenges:
• When you refresh the data,
you will see it change as
metrics will potentially differ
between the two instances
Kubernetes Service
Highly Available Prometheus
Targets Targets Targets
Not without its challenges:
• When you refresh the data,
you will see it change as
metrics will potentially differ
between the two instances
• Use sticky load balancing or
make the second instance a
hot standby
• This solution is becoming
complicated and does not
scale with query load
Kubernetes Service
Prometheus HA with Thanos
“Thanos is a set of components
that can be composed into a highly
available metric system with
unlimited storage capacity”
Prometheus HA with Thanos
Developed and open-sourced by engineers
at London based Improbable
Today, 5 core maintainers from various
organisations.
github.com/thanos-io/thanos
1000+ commits, 4k+ GitHub stars, 138 contributors
Prometheus HA with Thanos
Targets Targets Targets
Prometheus HA with Thanos
Targets Targets Targets
Query
2. Thanos Query
makes gRPC
call to Thanos
sidecar for
metrics and de-
duplicates
1. Thanos
sidecar
deployed
alongside
Prometheus in
Kubernetes
Pod using
operator
3. Thanos Query
exposes
Prometheus
HTTP API or
gRPC
Demo 3...
Long Term
Storage
The Challenge:
You want to store months or even
years worth of metrics within
Prometheus.
You still need to be able to query
that data and it be performant. Like,
all the data!
Long Term Storage
Storage
Storage Storage
Long Term
Nightmare?
Long Term Storage
Storage
• Prometheus was initially designed for short
metrics retention, it was designed for
monitoring & alerting on what is happening
‘now’
• Local storage can be expensive, especially if
using SSD
• You want to store years of metrics, will this
scale efficiently with Prometheus?
Long Term Storage
• Remote write/read API
• Prometheus has remote storage APIs
• The complexity of operating Elasticsearch or similar alongside
Prometheus seems somewhat overengineered
Hello again, Thanos!
Long Term Storage with Thanos
Targets Targets Targets
Query
1. Thanos Sidecar
ships metrics to
storage bucket
such as AWS S3
or GCP Storage
Store
2. Thanos Store makes
metrics available via Thanos
Store API for Query
How?
Memory Block
Targets
Targets
Disk Block
Long Term Storage with Thanos
• Significantly reduce storage requirements of each Prometheus instance –
only need to story around 2 to 24 hours of metrics
• Significantly cheaper storing metrics in a bucket versus scaling SSD
storage
• Thanos Compact executes compression of Prometheus TSDB data within
the bucket and also downsamples data for when querying over long time
periods – keeps raw (1m), 5m & 15m samples
• Query automatically de-duplicates data within Prometheus and metrics
store in the storage bucket
• Thanos is built from Prometheus TSDB code – not redesigning the wheel
Demo 4...
Conclusion
● Use Prometheus Operator for making the automation of Prometheus on
Kubernetes easy!
● Collect time series metrics from everywhere in Kubernetes and start
building dashboards to enhance the Observability of your platform and
services!
● Use Thanos for adding resilience and ease of scalability with Prometheus
in Kubernetes.. It is as easy as deploying a sidecar!
Questions?
Thank you for listening!
I have published a series of K8s Observability tutorials at:
https://observability.thomasriley.co.uk
Get in touch:
Mail: contact@thomasriley.co.uk
Slack: Riley @ kubernetes.slack.com
Twitter: @therealriley

Prometheus in Practice: High Availability with Thanos (DevOpsDays Edinburgh 2019)

  • 1.
    Prometheus in Practice: HighAvailability with Thanos Tom Riley DevOpsDays Edinburgh 2019
  • 2.
    About Me ● TomRiley ● Infrastructure @ Nuance ● Previously Booking.com ● Co-Organiser Cloud Native + Kubernetes Manchester
  • 3.
    Today ● Introduction toPrometheus ● Monitoring Kubernetes ● High Availability Prometheus ● Long Term Storage for Prometheus
  • 4.
    What is Prometheus? ●Prometheus is a metrics oriented Monitoring solution (TSDB & Tooling) ● Released by SoundCloud in 2012 ● Prometheus project joined Cloud Native Computing Foundation in 2016 ● During 2018, become the second project to graduate from incubation alongside Kubernetes
  • 5.
  • 6.
  • 7.
  • 8.
  • 9.
  • 10.
    Prometheus Metrics Metric NameMetric Labels Metric Values Metric
  • 11.
    What is Prometheus? Prometheus Application Service DiscoveryApplication Exporter Alert Manager Grafana
  • 12.
    Demo Environment 1. Kubernetes onmy laptop using KIND 2. Prometheus Operator 3. Monitoring Kubernetes via: Kube-state-metrics Node Exporter Kubelet & cAdvisor 4. Grafana Dashboards
  • 13.
  • 14.
    Prometheus Operator apiVersion: monitoring.coreos.com/v1 kind: Prometheus metadata: name:prometheus namespace: prometheus spec: baseImage: quay.io/prometheus/prometheus logLevel: info replicas: 1 resources: limits: cpu: 1 memory: 100Mi requests: cpu: 1 memory: 100Mi retention: 12h serviceAccountName: prometheus-service-account serviceMonitorSelector: matchLabels: serviceMonitorSelector: prometheus version: v2.10.0 Deploying a Prometheus Instance...
  • 15.
    Prometheus Operator apiVersion: monitoring.coreos.com/v1 kind: ServiceMonitor metadata: labels: serviceMonitorSelector:prometheus name: prometheus namespace: prometheus spec: endpoints: - interval: 30s path: /metrics targetPort: 9090 namespaceSelector: matchNames: - prometheus selector: matchLabels: app: prometheus Configure Prometheus Targets with ServiceMonitor...
  • 16.
  • 17.
    Highly Un-Available Prometheus ●In our demo environment we have a single instance of Prometheus, as shown in the diagram to the right ● If the Kubernetes worker node that Prometheus is running on fails the Pod will temporarily become unavailable as it is evicted and launched elsewhere Targets Targets Targets Scrape Targets
  • 18.
    Highly Available Prometheus TargetsTargets Targets Prometheus x2 Highly Available! Scrape Targets, Twice!
  • 19.
    Highly Available Prometheus Challenges: •We have two sources of duplicate metrics! • Which do we use?
  • 20.
    Highly Available Prometheus TargetsTargets Targets Use a Load Balancer Load Balancer
  • 21.
    Highly Available Prometheus TargetsTargets Targets Use a Service when running in K8 Kubernetes Service
  • 22.
  • 23.
    Highly Available Prometheus TargetsTargets Targets Not without its challenges: • When you refresh the data, you will see it change as metrics will potentially differ between the two instances Kubernetes Service
  • 24.
    Highly Available Prometheus TargetsTargets Targets Not without its challenges: • When you refresh the data, you will see it change as metrics will potentially differ between the two instances • Use sticky load balancing or make the second instance a hot standby • This solution is becoming complicated and does not scale with query load Kubernetes Service
  • 25.
    Prometheus HA withThanos “Thanos is a set of components that can be composed into a highly available metric system with unlimited storage capacity”
  • 26.
    Prometheus HA withThanos Developed and open-sourced by engineers at London based Improbable Today, 5 core maintainers from various organisations. github.com/thanos-io/thanos 1000+ commits, 4k+ GitHub stars, 138 contributors
  • 27.
    Prometheus HA withThanos Targets Targets Targets
  • 28.
    Prometheus HA withThanos Targets Targets Targets Query 2. Thanos Query makes gRPC call to Thanos sidecar for metrics and de- duplicates 1. Thanos sidecar deployed alongside Prometheus in Kubernetes Pod using operator 3. Thanos Query exposes Prometheus HTTP API or gRPC
  • 29.
  • 30.
    Long Term Storage The Challenge: Youwant to store months or even years worth of metrics within Prometheus. You still need to be able to query that data and it be performant. Like, all the data!
  • 31.
  • 32.
  • 33.
    Long Term Storage Storage •Prometheus was initially designed for short metrics retention, it was designed for monitoring & alerting on what is happening ‘now’ • Local storage can be expensive, especially if using SSD • You want to store years of metrics, will this scale efficiently with Prometheus?
  • 34.
    Long Term Storage •Remote write/read API • Prometheus has remote storage APIs • The complexity of operating Elasticsearch or similar alongside Prometheus seems somewhat overengineered
  • 35.
  • 36.
    Long Term Storagewith Thanos Targets Targets Targets Query 1. Thanos Sidecar ships metrics to storage bucket such as AWS S3 or GCP Storage Store 2. Thanos Store makes metrics available via Thanos Store API for Query
  • 37.
  • 38.
    Long Term Storagewith Thanos • Significantly reduce storage requirements of each Prometheus instance – only need to story around 2 to 24 hours of metrics • Significantly cheaper storing metrics in a bucket versus scaling SSD storage • Thanos Compact executes compression of Prometheus TSDB data within the bucket and also downsamples data for when querying over long time periods – keeps raw (1m), 5m & 15m samples • Query automatically de-duplicates data within Prometheus and metrics store in the storage bucket • Thanos is built from Prometheus TSDB code – not redesigning the wheel
  • 39.
  • 40.
    Conclusion ● Use PrometheusOperator for making the automation of Prometheus on Kubernetes easy! ● Collect time series metrics from everywhere in Kubernetes and start building dashboards to enhance the Observability of your platform and services! ● Use Thanos for adding resilience and ease of scalability with Prometheus in Kubernetes.. It is as easy as deploying a sidecar!
  • 41.
    Questions? Thank you forlistening! I have published a series of K8s Observability tutorials at: https://observability.thomasriley.co.uk Get in touch: Mail: contact@thomasriley.co.uk Slack: Riley @ kubernetes.slack.com Twitter: @therealriley