Download as PDF, PPTX


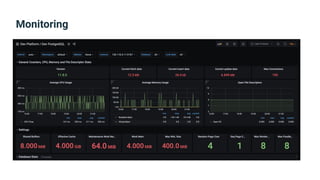


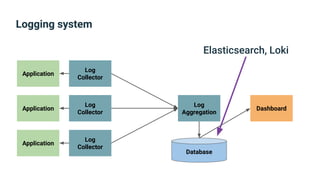
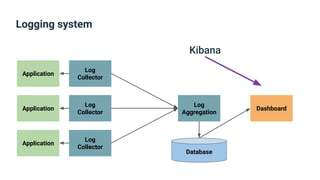
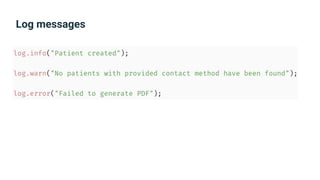
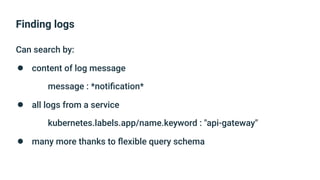


The document provides an introduction to observability, covering monitoring, logging, and distributed tracing in application systems. It emphasizes the importance of using appropriate metrics, structured logging, and symptom-based alerts to effectively manage application performance and diagnose issues. Key recommendations include avoiding high cardinality tags, leveraging percentiles for analysis, and ensuring alerts are actionable and meaningful.