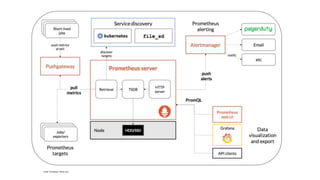
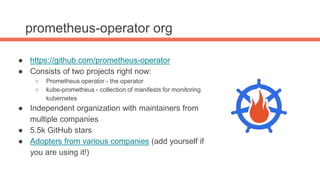
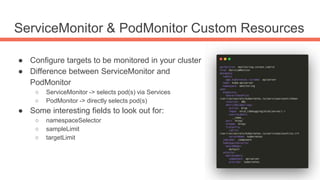
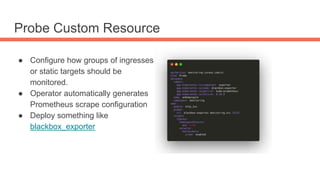
Monitoring Kubernetes
with prometheus-operator
Lili Cosic
Who am I?
● Lili Cosic
● @lilic on GitHub
● @lilicosic on Twitter
● Principal Software Engineer
● Engineer in the OpenShift in-cluster monitoring team.
● Maintainer and contributor to prometheus operator, kube prometheus, kube-
state-metrics and member of SIG Instrumentation.
Prometheus briefly
Credit: Prometheus official docs
prometheus-operator org
● https://github.com/prometheus-operator
● Consists of two projects right now:
○ Prometheus operator - the operator
○ kube-prometheus - collection of manifests for monitoring
kubernetes
● Independent organization with maintainers from
multiple companies
● 5.5k GitHub stars
● Adopters from various companies (add yourself if
you are using it!)
Prometheus Operator
Prometheus operator
● https://github.com/prometheus-operator/prometheus-operator
● One of the first Kubernetes operators created by CoreOS
● Simplifies managing, operating and configuring monitoring components within
your Kubernetes clusters
● Provides multi tenancy features
● Self service monitoring
Prometheus operator
● Custom Resources
○ Prometheus
○ Alertmanager
○ ServiceMonitor & PodMonitor
○ PrometheusRule
○ ThanosRuler
○ Probe
○ AlertmanagerConfig
Prometheus Custom Resource
● Configure the Prometheus
deployment in your Kubernetes
clusters
● Fields to know:
○ selectors
○ alerting
○ resources
○ replicas
Alertmanager Custom Resource
● Configure the Alertmanager
StatefulSet deployment in your
Kubernetes clusters
ServiceMonitor & PodMonitor Custom Resources
● Configure targets to be monitored in your cluster
● Difference between ServiceMonitor and
PodMonitor
○ ServiceMonitor -> selects pod(s) via Services
○ PodMonitor -> directly selects pod(s)
● Some interesting fields to look out for:
○ namespaceSelector
○ sampleLimit
○ targetLimit
ServiceMonitor & PodMonitor Custom Resources
● How does it work?
○ ServiceMonitor or PodMonitor get created by user
○ Operator picks the resource
○ Operator creates a Secret resource with the content of target discovery in prometheus
specific configuration
○ Config-reloader sidecar watches the secrets and reloads Prometheus if there are any
changes
PrometheusRule Custom Resource
● Create Alerting and Recording rules
● Alerting rules - define alert conditions
based on Prometheus expression
language expressions and to send
notifications about firing alerts to an
external service
● Recording rules - precompute
frequently needed or computationally
expensive expressions and save their
result as a new set of time series.
PrometheusRule Custom Resource
● How does it work?
○ Create PrometheusRule in namespace that prom-operator
watches
○ Operator picks that custom resource
○ Operator bin packs into ConfigMaps
○ Mounts ConfigMaps into Prometheus pod
○ config-reloader sidecar reloads prometheus
Probe Custom Resource
● Configure how groups of ingresses
or static targets should be
monitored.
● Operator automatically generates
Prometheus scrape configuration
● Deploy something like
blackbox_exporter
AlertmanagerConfig Custom Resource
● Configure subsections of Alertmanager
configuration
● Useful for routing alerts to custom receivers
● Setting inhibit rules
● Great in a multi tenant environment where you
don’t want to give admin access to
Alertmanager Custom Resource to everyone
ThanosRuler Custom Resource
● Configure, connect and deploy
Thanos Ruler
● Thanos Rule is a component in
Thanos that evaluates Prometheus
recording and alerting rules against
chosen query API.
● Useful for multi tenant
environments where multiple
Prometheus instances are
deployed
Cool overlooked features of prometheus-operator
● Automated Sharding - Specify in the Prometheus spec by setting the number
of shards to distribute targets onto.
● enforcedNamespaceLabel - great for multi tenancy
● Thanos sidecar - configure object storage
kube-prometheus
kube-prometheus project
● https://github.com/prometheus-operator/kube-prometheus
● Easily monitor your Kubernetes cluster infra workloads out of the box
● Building blocks of Kubernetes cluster monitoring
● You can customize the experience with jsonnet - we do this in OpenShift
clusters
○ Jsonnet - a data templating language that extends JSON
● We do not maintain the helm chart but it is widely used
What components?
● Prometheus Operator Deployment
● Highly available Prometheus - 2 replicas
● Highly available Alertmanager - 3 replicas
● kube-state-metrics - metrics about Kubernetes resources
● Prometheus node_exporter - metrics about nodes
● Prometheus Adapter for Kubernetes Metrics APIs
● Grafana + dashboards
● Monitoring Kubernetes cluster components
● Alerting and Recording rules about Kubernetes and monitoring components
What you get if you apply the manifests repo
Pods deployed within the cluster Targets being monitored
How to monitor your own applications
Example app manifests
Troubleshooting - targets page
Go to prometheus UI and access the /targets page to see all the targets that
Prometheus could discover or those it could not
Troubleshooting
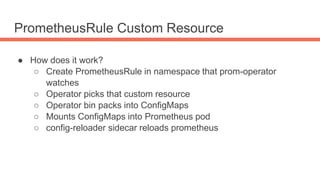
● Set debug log level on prometheus-operator to see which ServiceMonitors
or PodMonitors it picked up.
● kubectl -n monitoring get secret prometheus-k8s -ojson |
jq -r '.data["prometheus.yaml.gz"]' | base64 -d | gunzip
| grep "my-service-monitor-name"
● po-lint is helper binary that decodes and validates your Custom Resources
Conclusion
Help and docs
● https://prometheus-operator.dev/ <- new website (thanks metalmatze!)
● We also have troubleshooting docs
● Slack channel -> #prometheus-operator channel on Kubernetes slack
● Open issue on GitHub
● Useful docs links:
○ Custom resources and fields docs
○ List of metrics from kube-state-metrics
○ Runbooks for alerts (please contribute more!)
○ Alerting
○ Monitor external etcd
○ Customize kube prometheus experience
Thank you!
Lili Cosic
@LiliCosic - Twitter
@lilic - GitHub

Monitoring kubernetes with prometheus-operator

  • 1.
  • 2.
    Who am I? ●Lili Cosic ● @lilic on GitHub ● @lilicosic on Twitter ● Principal Software Engineer ● Engineer in the OpenShift in-cluster monitoring team. ● Maintainer and contributor to prometheus operator, kube prometheus, kube- state-metrics and member of SIG Instrumentation.
  • 3.
  • 4.
  • 5.
    prometheus-operator org ● https://github.com/prometheus-operator ●Consists of two projects right now: ○ Prometheus operator - the operator ○ kube-prometheus - collection of manifests for monitoring kubernetes ● Independent organization with maintainers from multiple companies ● 5.5k GitHub stars ● Adopters from various companies (add yourself if you are using it!)
  • 6.
  • 7.
    Prometheus operator ● https://github.com/prometheus-operator/prometheus-operator ●One of the first Kubernetes operators created by CoreOS ● Simplifies managing, operating and configuring monitoring components within your Kubernetes clusters ● Provides multi tenancy features ● Self service monitoring
  • 8.
    Prometheus operator ● CustomResources ○ Prometheus ○ Alertmanager ○ ServiceMonitor & PodMonitor ○ PrometheusRule ○ ThanosRuler ○ Probe ○ AlertmanagerConfig
  • 9.
    Prometheus Custom Resource ●Configure the Prometheus deployment in your Kubernetes clusters ● Fields to know: ○ selectors ○ alerting ○ resources ○ replicas
  • 10.
    Alertmanager Custom Resource ●Configure the Alertmanager StatefulSet deployment in your Kubernetes clusters
  • 11.
    ServiceMonitor & PodMonitorCustom Resources ● Configure targets to be monitored in your cluster ● Difference between ServiceMonitor and PodMonitor ○ ServiceMonitor -> selects pod(s) via Services ○ PodMonitor -> directly selects pod(s) ● Some interesting fields to look out for: ○ namespaceSelector ○ sampleLimit ○ targetLimit
  • 12.
    ServiceMonitor & PodMonitorCustom Resources ● How does it work? ○ ServiceMonitor or PodMonitor get created by user ○ Operator picks the resource ○ Operator creates a Secret resource with the content of target discovery in prometheus specific configuration ○ Config-reloader sidecar watches the secrets and reloads Prometheus if there are any changes
  • 13.
    PrometheusRule Custom Resource ●Create Alerting and Recording rules ● Alerting rules - define alert conditions based on Prometheus expression language expressions and to send notifications about firing alerts to an external service ● Recording rules - precompute frequently needed or computationally expensive expressions and save their result as a new set of time series.
  • 14.
    PrometheusRule Custom Resource ●How does it work? ○ Create PrometheusRule in namespace that prom-operator watches ○ Operator picks that custom resource ○ Operator bin packs into ConfigMaps ○ Mounts ConfigMaps into Prometheus pod ○ config-reloader sidecar reloads prometheus
  • 15.
    Probe Custom Resource ●Configure how groups of ingresses or static targets should be monitored. ● Operator automatically generates Prometheus scrape configuration ● Deploy something like blackbox_exporter
  • 16.
    AlertmanagerConfig Custom Resource ●Configure subsections of Alertmanager configuration ● Useful for routing alerts to custom receivers ● Setting inhibit rules ● Great in a multi tenant environment where you don’t want to give admin access to Alertmanager Custom Resource to everyone
  • 17.
    ThanosRuler Custom Resource ●Configure, connect and deploy Thanos Ruler ● Thanos Rule is a component in Thanos that evaluates Prometheus recording and alerting rules against chosen query API. ● Useful for multi tenant environments where multiple Prometheus instances are deployed
  • 18.
    Cool overlooked featuresof prometheus-operator ● Automated Sharding - Specify in the Prometheus spec by setting the number of shards to distribute targets onto. ● enforcedNamespaceLabel - great for multi tenancy ● Thanos sidecar - configure object storage
  • 19.
  • 20.
    kube-prometheus project ● https://github.com/prometheus-operator/kube-prometheus ●Easily monitor your Kubernetes cluster infra workloads out of the box ● Building blocks of Kubernetes cluster monitoring ● You can customize the experience with jsonnet - we do this in OpenShift clusters ○ Jsonnet - a data templating language that extends JSON ● We do not maintain the helm chart but it is widely used
  • 21.
    What components? ● PrometheusOperator Deployment ● Highly available Prometheus - 2 replicas ● Highly available Alertmanager - 3 replicas ● kube-state-metrics - metrics about Kubernetes resources ● Prometheus node_exporter - metrics about nodes ● Prometheus Adapter for Kubernetes Metrics APIs ● Grafana + dashboards ● Monitoring Kubernetes cluster components ● Alerting and Recording rules about Kubernetes and monitoring components
  • 22.
    What you getif you apply the manifests repo Pods deployed within the cluster Targets being monitored
  • 23.
    How to monitoryour own applications
  • 24.
  • 25.
    Troubleshooting - targetspage Go to prometheus UI and access the /targets page to see all the targets that Prometheus could discover or those it could not
  • 26.
    Troubleshooting ● Set debuglog level on prometheus-operator to see which ServiceMonitors or PodMonitors it picked up. ● kubectl -n monitoring get secret prometheus-k8s -ojson | jq -r '.data["prometheus.yaml.gz"]' | base64 -d | gunzip | grep "my-service-monitor-name" ● po-lint is helper binary that decodes and validates your Custom Resources
  • 27.
  • 28.
    Help and docs ●https://prometheus-operator.dev/ <- new website (thanks metalmatze!) ● We also have troubleshooting docs ● Slack channel -> #prometheus-operator channel on Kubernetes slack ● Open issue on GitHub ● Useful docs links: ○ Custom resources and fields docs ○ List of metrics from kube-state-metrics ○ Runbooks for alerts (please contribute more!) ○ Alerting ○ Monitor external etcd ○ Customize kube prometheus experience
  • 29.
    Thank you! Lili Cosic @LiliCosic- Twitter @lilic - GitHub

Editor's Notes

  • #5 Important thing to see here is, Alertmanager despite its name does not evaluate alerts, but prometheus does that. Alertmanager just distributes alerts to specific receiver e.g. email, pageduty, slack. Prometheus retrieves metrics and discovers targets and stores them in tsdb - custom time series database