Ralph Lauren Corporation (RL) Stock Analysis

Ralph Lauren Corporation designs, markets, and distributes lifestyle products in North America, Europe, Asia, and internationally. The company offers apparel, including a range of men's, women's, and children's clothing and accessories, which comprise casual shoes. Based on the Ralph Lauren Corporation stock forecasts from 12 analysts, the average analyst target price for Ralph Lauren Corporation is USD 133.25 over the next 12 months. Ralph Lauren Corporation’s average analyst rating is Buy . Stock Target Advisor’s own stock analysis of Ralph Lauren Corporation is Neutral, which is based on 7 positive signals and 8 negative signals. At the last closing, Ralph Lauren Corporation’s stock price was USD 93.69. Ralph Lauren Corporation’s stock price has changed by -1.68% over the past week, -13.59% over the past month and -22.92% over the last year.

Recommended
Recommended
More Related Content
Similar to Ralph Lauren Corporation (RL) Stock Analysis
Similar to Ralph Lauren Corporation (RL) Stock Analysis (20)
More from Stock Target Advisor
More from Stock Target Advisor (20)
Recently uploaded
Recently uploaded (20)
Ralph Lauren Corporation (RL) Stock Analysis
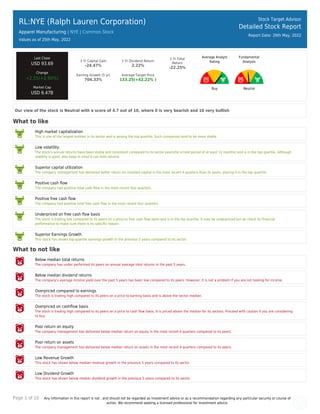
- 1. Page 1 of 10 Any information in this report is not , and should not be regarded as investment advice or as a recommendation regarding any particular security or course of action. We recommend seeking a licensed professional for investment advice. RL:NYE (Ralph Lauren Corporation) Apparel Manufacturing | NYE | Common Stock Values as of 25th May, 2022 Stock Target Advisor Detailed Stock Report Report Date: 26th May, 2022 Last Close USD 93.69 Change +2.55(+2.80%) Market Cap USD 6.47B 1 Yr Capital Gain -24.47% 1 Yr Dividend Return 2.22% 1 Yr Total Return -22.25% Earning Growth (5 yr) 704.33% Average Target Price 133.25(+42.22% ) Average Analyst Rating Buy Fundamental Analysis Neutral Our view of the stock is Neutral with a score of 4.7 out of 10, where 0 is very bearish and 10 very bullish What to like High market capitalization This is one of the largest entities in its sector and is among the top quartile. Such companies tend to be more stable. Low volatility The stock’s annual returns have been stable and consistent compared to its sector peers(for a hold period of at least 12 months) and is in the top quartile. Although stability is good, also keep in mind it can limit returns. Superior capital utilization The company management has delivered better return on invested capital in the most recent 4 quarters than its peers, placing it in the top quartile. Positive cash flow The company had positive total cash flow in the most recent four quarters. Positive free cash flow The company had positive total free cash flow in the most recent four quarters. Underpriced on free cash flow basis The stock is trading low compared to its peers on a price to free cash flow basis and is in the top quartile. It may be underpriced but do check its financial performance to make sure there is no specific reason. Superior Earnings Growth This stock has shown top quartile earnings growth in the previous 5 years compared to its sector. What to not like Below median total returns The company has under performed its peers on annual average total returns in the past 5 years. Below median dividend returns The company’s average income yield over the past 5 years has been low compared to its peers. However, it is not a problem if you are not looking for income. Overpriced compared to earnings The stock is trading high compared to its peers on a price to earning basis and is above the sector median. Overpriced on cashflow basis The stock is trading high compared to its peers on a price to cash flow basis. It is priced above the median for its sectors. Proceed with caution if you are considering to buy. Poor return on equity The company management has delivered below median return on equity in the most recent 4 quarters compared to its peers. Poor return on assets The company management has delivered below median return on assets in the most recent 4 quarters compared to its peers. Low Revenue Growth This stock has shown below median revenue growth in the previous 5 years compared to its sector Low Dividend Growth This stock has shown below median dividend growth in the previous 5 years compared to its sector.
- 2. Page 2 of 10 Any information in this report is not , and should not be regarded as investment advice or as a recommendation regarding any particular security or course of action. We recommend seeking a licensed professional for investment advice.
- 3. Page 3 of 10 Any information in this report is not , and should not be regarded as investment advice or as a recommendation regarding any particular security or course of action. We recommend seeking a licensed professional for investment advice. RL:NYE (Ralph Lauren Corporation) Apparel Manufacturing | | Common Stock Stock Target Advisor Detailed Stock Report Report Date: 26th May, 2022 Adjusted Closing Share Volume Relative Returns Relative Performance (Total Returns) Security Capital Gain Dividend Return Total Return RL Ralph Lauren Corporation -22.9% +2.3% -20.7% VTI Vanguard Index Funds - Vanguard Total Stock Market ETF -8.2% +1.4% -6.8% Company Overview Ralph Lauren Corporation designs, markets, and distributes lifestyle products in North America, Europe, Asia, and internationally. The company offers apparel, including a range of men's, women's, and children's clothing and accessories, which comprise casual shoes, dress shoes, boots, sneakers, sandals, eyewear, watches, fashion and fine jewelry, scarves, hats, gloves, umbrellas, and belts, as well as leather goods, such as handbags, luggage, small leather goods, and belts; home products consisting of bed and bath lines, furniture, fabric and wallcoverings, lighting, tabletop, floor coverings, and giftware; and fragrances. It sells apparel and accessories under the Ralph Lauren Collection, Ralph Lauren Purple Label, Polo Ralph Lauren, Double RL, Lauren Ralph Lauren, Polo Golf Ralph Lauren, Ralph Lauren Golf, RLX Ralph Lauren, Polo Ralph Lauren Children, Chaps, and Club Monaco brands; women's fragrances under the Ralph Lauren Collection, Woman by Ralph Lauren, Romance Collection, Ralph Collection, and Big Pony Women's brand names; and men's fragrances under the Polo Blue, Safari, Purple Label, Polo Red, Polo Green, Polo Black, Polo Supreme, Polo Sport, and Big Pony Men's brand names. The company's restaurant concepts include The Polo Bar in New York City; RL Restaurant in Chicago; Ralph's in Paris; and Ralph's Coffee concept. Ralph Lauren Corporation sells its products to department stores, specialty stores, and golf and pro shops, as well as directly to consumers through its retail stores, concession-based shop-within-shops, and its digital commerce sites. The company directly operates 548 retail stores and 650 concession-based shop-within-shops; and operates 139 Ralph Lauren stores, and 143 Club Monaco stores and shops through licensing partners. Ralph Lauren Corporation was founded in 1967 and is headquartered in New York, New York.
- 4. Page 4 of 10 Any information in this report is not , and should not be regarded as investment advice or as a recommendation regarding any particular security or course of action. We recommend seeking a licensed professional for investment advice. Company Website https://www.ralphlauren.com Address 650 Madison Avenue, New York, NY, United States, 10022 Fiscal Year End March Employees 12100 Technical Indicators Value Value Beta 1.39 52 Week High 135.21 Short Ratio 2.24 52 Week Low 86.55 Shorted Shares 1,989,174 200 Day Moving Average 115.94 Shorted Shares Previous Month 1,870,450 50 Day Moving Average 107.72 Shares Held By Insiders 117.50% Short Percentage 5.00% Shares Held by Institutions 98.13 Dividend Yield 2.95%
- 5. Page 5 of 10 Any information in this report is not , and should not be regarded as investment advice or as a recommendation regarding any particular security or course of action. We recommend seeking a licensed professional for investment advice. RL:NYE (Ralph Lauren Corporation) Apparel Manufacturing | | Common Stock Stock Target Advisor Detailed Stock Report Report Date: 26th May, 2022 Market Performance Market Performance vs. Industry / Classification (Apparel Manufacturing) Market Performance vs. Exchange (Nasdaq Global Select) Value Sector Median Percentile Rank Grade Market Median Percentile Rank Grade YTD Capital Gain -21.18% -33.9% 80% -12.5% 29% Dividend Return 0.58% 0.8% 22% 1.0% 33% Total Return -20.60% -30.6% 75% -11.6% 28% Trailing 12 Months Capital Gain -24.47% -39.6% 71% -10.5% 24% Dividend Return 2.22% 1.9% 56% 2.8% 42% Total Return -22.25% -36.8% 67% -7.8% 23% Trailing 5 Years Capital Gain 41.72% -12.3% 80% 6.6% 69% Dividend Return 15.13% 12.8% 83% 12.8% 59% Total Return 56.84% 5.5% 90% 22.3% 72% Average Annual (5 Year Horizon) Capital Gain 12.39% 17.2% 29% 4.8% 69% Dividend Return 1.82% 1.8% 50% 2.1% 43% Total Return 14.22% 17.3% 29% 8.0% 68% Risk Return Profile Volatility (Standard Deviation) 39.65% 56.8% 93% 22.8% 26% Risk Adjusted Return 35.86% N/A 64% 40.2% 45% Market Capitalization 6.47B 3.89B 88% 1.36B 78%
- 6. Page 6 of 10 Any information in this report is not , and should not be regarded as investment advice or as a recommendation regarding any particular security or course of action. We recommend seeking a licensed professional for investment advice. Key Financial Ratios Ratios vs. Industry / Classification (Computer Hardware) Ratios vs. Exchange (Nasdaq Global Select) Value Sector Median Percentile Rank Grade Market Median Percentile Rank Grade Market Value peratio 13.5 11.2 31% 16.1 59% pbratio 2.5 2.7 63% 1.6 33% pcfratio 9.0 7.9 38% 7.2 42% pfcfratio 7.4 8.2 75% 10.9 66% Management Effectiveness retequity 18.53% 18.8% 44% 10.0% 74% retinvcap 19.01% 15.0% 75% 5.6% 85% retass 6.23% 6.2% 50% 2.5% 78% debtequityratio N/A 61.3% N/A 68.3% N/A Technical Ratios yield 2.95% 2.7% 56% 3.1% 48% sratio 2.24 4.19 80% 2.11 48% spercent 4.34% 7.4% 67% 3.6% 45% beta 1.39 1.47 67% 1.03 25%
- 7. Page 7 of 10 Any information in this report is not , and should not be regarded as investment advice or as a recommendation regarding any particular security or course of action. We recommend seeking a licensed professional for investment advice. RL:NYE (Ralph Lauren Corporation) Apparel Manufacturing | | Common Stock Stock Target Advisor Detailed Stock Report Report Date: 26th May, 2022 Recent Analyst Ratings Price Action Rating Action Analyst Rating Price date Maintains Telsey Advisory Group Outperform USD 160 » USD 140 2022-05-25 Maintains Barclays Equal-Weight USD 117 » USD 99 2022-05-25 Target Down JP Morgan & Company USD 130 2022-05-25 Maintains Deutsche Bank Capital Hold USD 116 » USD 101 2022-05-25 Target Lowered by Wells Fargo USD 95 2022-05-25 Downgraded by Citigroup Buy » Neutral USD 140 » USD 98 2022-05-23 Target Lowered by Credit Suisse Outperform USD 165 » USD 130 2022-05-18 Target Down Deutsche Bank Capital NA USD 116 2022-05-16 Downgraded by Wells Fargo Overweight » Equal Weight USD 135 » USD 110 2022-04-05 Upgraded by JP Morgan & Company Neutral » Overweight USD 142 2022-03-17 Downgraded by Wedbush Outperform » Neutral USD 150 » USD 127 2022-03-07 Target Raised by JP Morgan & Company Neutral USD 137 » USD 142 2022-02-15 Maintains UBS Buy USD 168 » USD 171 2022-02-07 Maintains Telsey Advisory Group Outperform USD 152 » USD 160 2022-02-04 Target Raised by Citigroup USD 135 » USD 140 2022-02-04 Maintains JP Morgan & Company Neutral USD 120 » USD 137 2022-02-04 Target Raised by Truist Securities USD 141 » USD 156 2022-02-04 Maintains Credit Suisse Outperform USD 155 » USD 165 2022-02-04 Target Raised by Cowen USD 162 » USD 171 2022-02-04 Maintains Wells Fargo Overweight USD 140 » USD 135 2022-02-01 Target Lowered by JP Morgan & Company USD 122 » USD 120 2022-01-24 Initiates Coverage On Truist Securities Buy USD 141 2021-12-16 Downgrades Goldman Sachs Sell USD 142 » USD 110 2021-12-14 Maintains Cowen Outperform USD 154 » USD 162 2021-12-13 Target Lowered by Deutsche Bank Capital Positive » Hold USD 133 » USD 125 2021-10-18
- 8. Page 8 of 10 Any information in this report is not , and should not be regarded as investment advice or as a recommendation regarding any particular security or course of action. We recommend seeking a licensed professional for investment advice. RL:NYE (Ralph Lauren Corporation) Apparel Manufacturing | | Common Stock Stock Target Advisor Detailed Stock Report Report Date: 26th May, 2022 Annual Financial (USD)
- 9. Page 9 of 10 Any information in this report is not , and should not be regarded as investment advice or as a recommendation regarding any particular security or course of action. We recommend seeking a licensed professional for investment advice. RL:NYE (Ralph Lauren Corporation) Apparel Manufacturing | | Common Stock Stock Target Advisor Detailed Stock Report Report Date: 26th May, 2022 Quarterly Financial (USD)
- 10. Page 10 of 10 Any information in this report is not , and should not be regarded as investment advice or as a recommendation regarding any particular security or course of action. We recommend seeking a licensed professional for investment advice. RL:NYE (Ralph Lauren Corporation) Apparel Manufacturing | | Common Stock Stock Target Advisor Detailed Stock Report Report Date: 26th May, 2022 Largest Industry Peers for Apparel Manufacturing Symbol Company Name Price(Change) Market Cap VFC V.F. Corporation +1.63 (+3.6%) USD 18.07B LEVI Levi Strauss & Co +0.81 (+4.9%) USD 6.55B CPRI Capri Holdings Limited +3.73 (+9.5%) USD 6.22B GIL Gildan Activewear Inc -0.12 (-0.4%) USD 5.74B PVH PVH Corp +3.44 (+5.5%) USD 4.34B UA Under Armour Inc +0.59 (+7.2%) USD 4.27B HBI Hanesbrands Inc +0.29 (+2.6%) USD 4.06B UAA Under Armour Inc +0.64 (+7.0%) USD 3.89B KTB Kontoor Brands Inc +1.56 (+4.3%) USD 2.13B GOOS Canada Goose Holdings Inc +0.73 (+4.0%) USD 2.01B ETFs Containing RL Symbol Company Name Weight Mer Price(Change) Market Cap LALT 0.00 % 0.88 % N/A N/A STNC Stance Equity ESG Large Cap Co.. 0.00 % 0.00 % +0.22 (+0.9%) N/A The Stock Target Advisor platform run millions of calculations every day on over 30,000 Canadian and American stocks, comparing and ranking their financial and market performance against their sectors and exchange. We represent the percentile ranking using the following grading system. Letter Grade Percentage Letter Grade Percentage Letter Grade Percentage A+ 97%-100% A 93%-96% A- 90%-92% B+ 97%-89% B 83%-86% B- 80%-82% C+ 77%-79% C 73%-76% C- 70%-72% D+ 67%-69% D 63%-66% D- 60%-62% F 0%-59%