Procurement Average Time To Procure Dashboard
•
0 likes•5 views

"You can download this product from SlideTeam.net" Presenting this set of slides with name Procurement Average Time To Procure Dashboard. This is a seven stage process. The stages in this process are Purchase, Procurement, Buy. https://bit.ly/3iDM9y4

Recommended
Recommended
More Related Content
Similar to Procurement Average Time To Procure Dashboard
Similar to Procurement Average Time To Procure Dashboard (20)
More from SlideTeam
More from SlideTeam (20)
Recently uploaded
Recently uploaded (20)
Procurement Average Time To Procure Dashboard
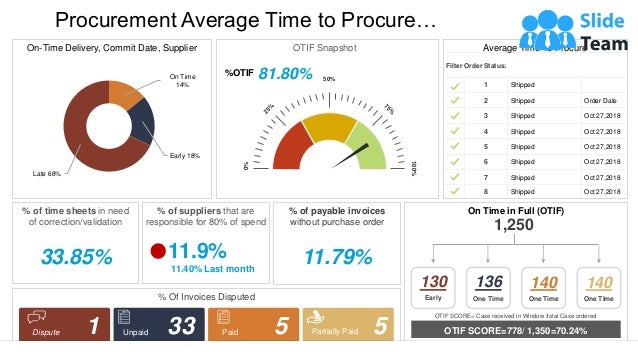
- 1. Procurement Average Time to Procure… Filter Order Status: 1 Shipped 2 Shipped Order Date 3 Shipped Oct 27,2018 4 Shipped Oct 27,2018 5 Shipped Oct 27,2018 6 Shipped Oct 27,2018 7 Shipped Oct 27,2018 8 Shipped Oct 27,2018 0% 100% 50% OTIF Snapshot %OTIF 81.80% On Time 14% Early 18% Late 68% On-Time Delivery, Commit Date, Supplier On Time in Full (OTIF) 1,250 130 Early 136 One Time 140 One Time 140 One Time OTIF SCORE=778/ 1,350=70.24% OTIF SCORE= Case received in Window /total Case ordered % of time sheets in need of correction/validation 33.85% 11.9% 11.40% Last month % of suppliers that are responsible for 80% of spend 11.79% % of payable invoices without purchase order Average Time To Procure % Of Invoices Disputed Dispute 1 Unpaid 33 5 Paid Partially Paid 5
- 2. Instructions To Edit This Slide This slide has been made in PowerPoint using basic PowerPoint shapes, and all graphics are 100% editable in PowerPoint. You can change color, size and orientation of any element to your liking, and add/edit any piece of text anywhere.
- 3. All images are 100% editable in PowerPoint Change color, size and orientation of any icon to your liking”
- 4. 1. Select the Graph and right click -> Select "Edit Data" 2. An excel matrix will automatically show up 3. Enter the values based on your requirements and hit enter 4. The Graph/Chart shape will automatically adjust according to your data, and anytime you can go and change the value again Edit Excel-linked Chart This is a Data Driven Chart/Graph and the shape automatically adjusts according to your data 1 2 3
- 5. Edit Color 1. Select the shape to change the color and Right click the object( click any object which you want to change color) 2. Choose Format Data Series in the dialog box. 3. Choose “Fill” in the Format Shape box then “Solid” or “Gradient” depending on the appearance of the object. Change colour as shown in the picture. 1 2 3
- 6. Select From Thousands Of Editable Icons On Every Topic These icons are available at the Icons section on www.slideteam.net