Project Delivery Roadmap And Portfolio Financials Dashboards

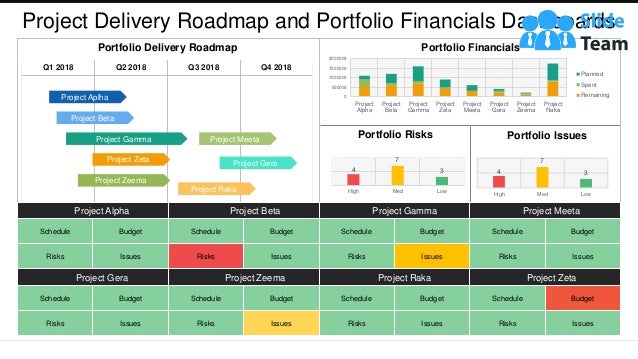
"You can download this product from SlideTeam.net" Check out our project delivery roadmap and portfolio financials dashboards PPT template. There are a variety of different kinds of business dashboards that you can use to display the information compiled in your reports. Bar charts, Gantt charts and tables are used for making comparisons and showing proportions. These are very effective when you visually compare a few categories. Our project delivery roadmap and portfolio financials dashboards PowerPoint graphic make it extremely easy to convert your business information into editable charts. The PPT slide has professional graphs and charts which are linked to excel sheets. So, you can change the values of these charts and graphs as per the information you want to represent. Also, ample space has been provided beside the charts so that you can enter important points related to the chart and its categories. This project delivery roadmap Presentation diagram assists you to display your financial information in the best possible manner. Gauge the future with our Project Delivery Roadmap And Portfolio Financials Dashboards. Decide on which avenue to follow. https://bit.ly/3r7B641

Recommended
Recommended
More Related Content
Similar to Project Delivery Roadmap And Portfolio Financials Dashboards
Similar to Project Delivery Roadmap And Portfolio Financials Dashboards (20)
More from SlideTeam
More from SlideTeam (20)
Recently uploaded
Recently uploaded (20)
Project Delivery Roadmap And Portfolio Financials Dashboards
- 1. Portfolio Delivery Roadmap Portfolio Financials Q1 2018 Q2 2018 Q3 2018 Q4 2018 Project Aplha Project Gamma Project Beta Project Zeta Project Zeema Project Meeta Project Gera Project Raka 0 500000 1000000 1500000 2000000 Project Alpha Project Beta Project Gamma Project Zeta Project Meeta Project Gera Project Zeema Project Raka Planned Spent Remaining Portfolio Risks Project Alpha Project Beta Project Gamma Project Meeta Schedule Budget Schedule Budget Schedule Budget Schedule Budget Risks Issues Risks Issues Risks Issues Risks Issues Project Gera Project Zeema Project Raka Project Zeta Schedule Budget Schedule Budget Schedule Budget Schedule Budget Risks Issues Risks Issues Risks Issues Risks Issues 4 7 3 High Med Low 4 7 3 High Med Low Portfolio Issues This graph/chart is linked to excel, and changes automatically based on data. Just left click on it and select “Edit Data”. Project Delivery Roadmap and Portfolio Financials Dashboards
- 2. Instructions To Edit This Slide This slide has been made in PowerPoint using basic PowerPoint shapes, and all graphics are 100% editable in PowerPoint. You can change color, size and orientation of any element to your liking, and add/edit any piece of text anywhere.
- 3. All images are 100% editable in PowerPoint Change color, size and orientation of any icon to your liking”
- 4. 1. Select the Graph and right click -> Select "Edit Data" 2. An excel matrix will automatically show up 3. Enter the values based on your requirements and hit enter 4. The Graph/Chart shape will automatically adjust according to your data, and anytime you can go and change the value again Edit Excel-linked Chart This is a Data Driven Chart/Graph and the shape automatically adjusts according to your data 1 2 3
- 5. Edit Color 1. Select the shape to change the color and Right click the object( click any object which you want to change color) 2. Choose Format Data Series in the dialog box. 3. Choose “Fill” in the Format Shape box then “Solid” or “Gradient” depending on the appearance of the object. Change colour as shown in the picture. 1 2 3
- 6. Select From Thousands Of Editable Icons On Every Topic These icons are available at the Icons section on www.slideteam.net