Download as PDF, PPTX

The document outlines a customizable project dashboard designed for tracking key performance indicators (KPIs), risks, assumptions, issues, and dependencies related to different workstreams. It emphasizes the ease of editing within PowerPoint, allowing users to modify graphics, update data in linked charts, and change colors of elements. Additionally, it offers access to a variety of editable icons for enhancing presentations.
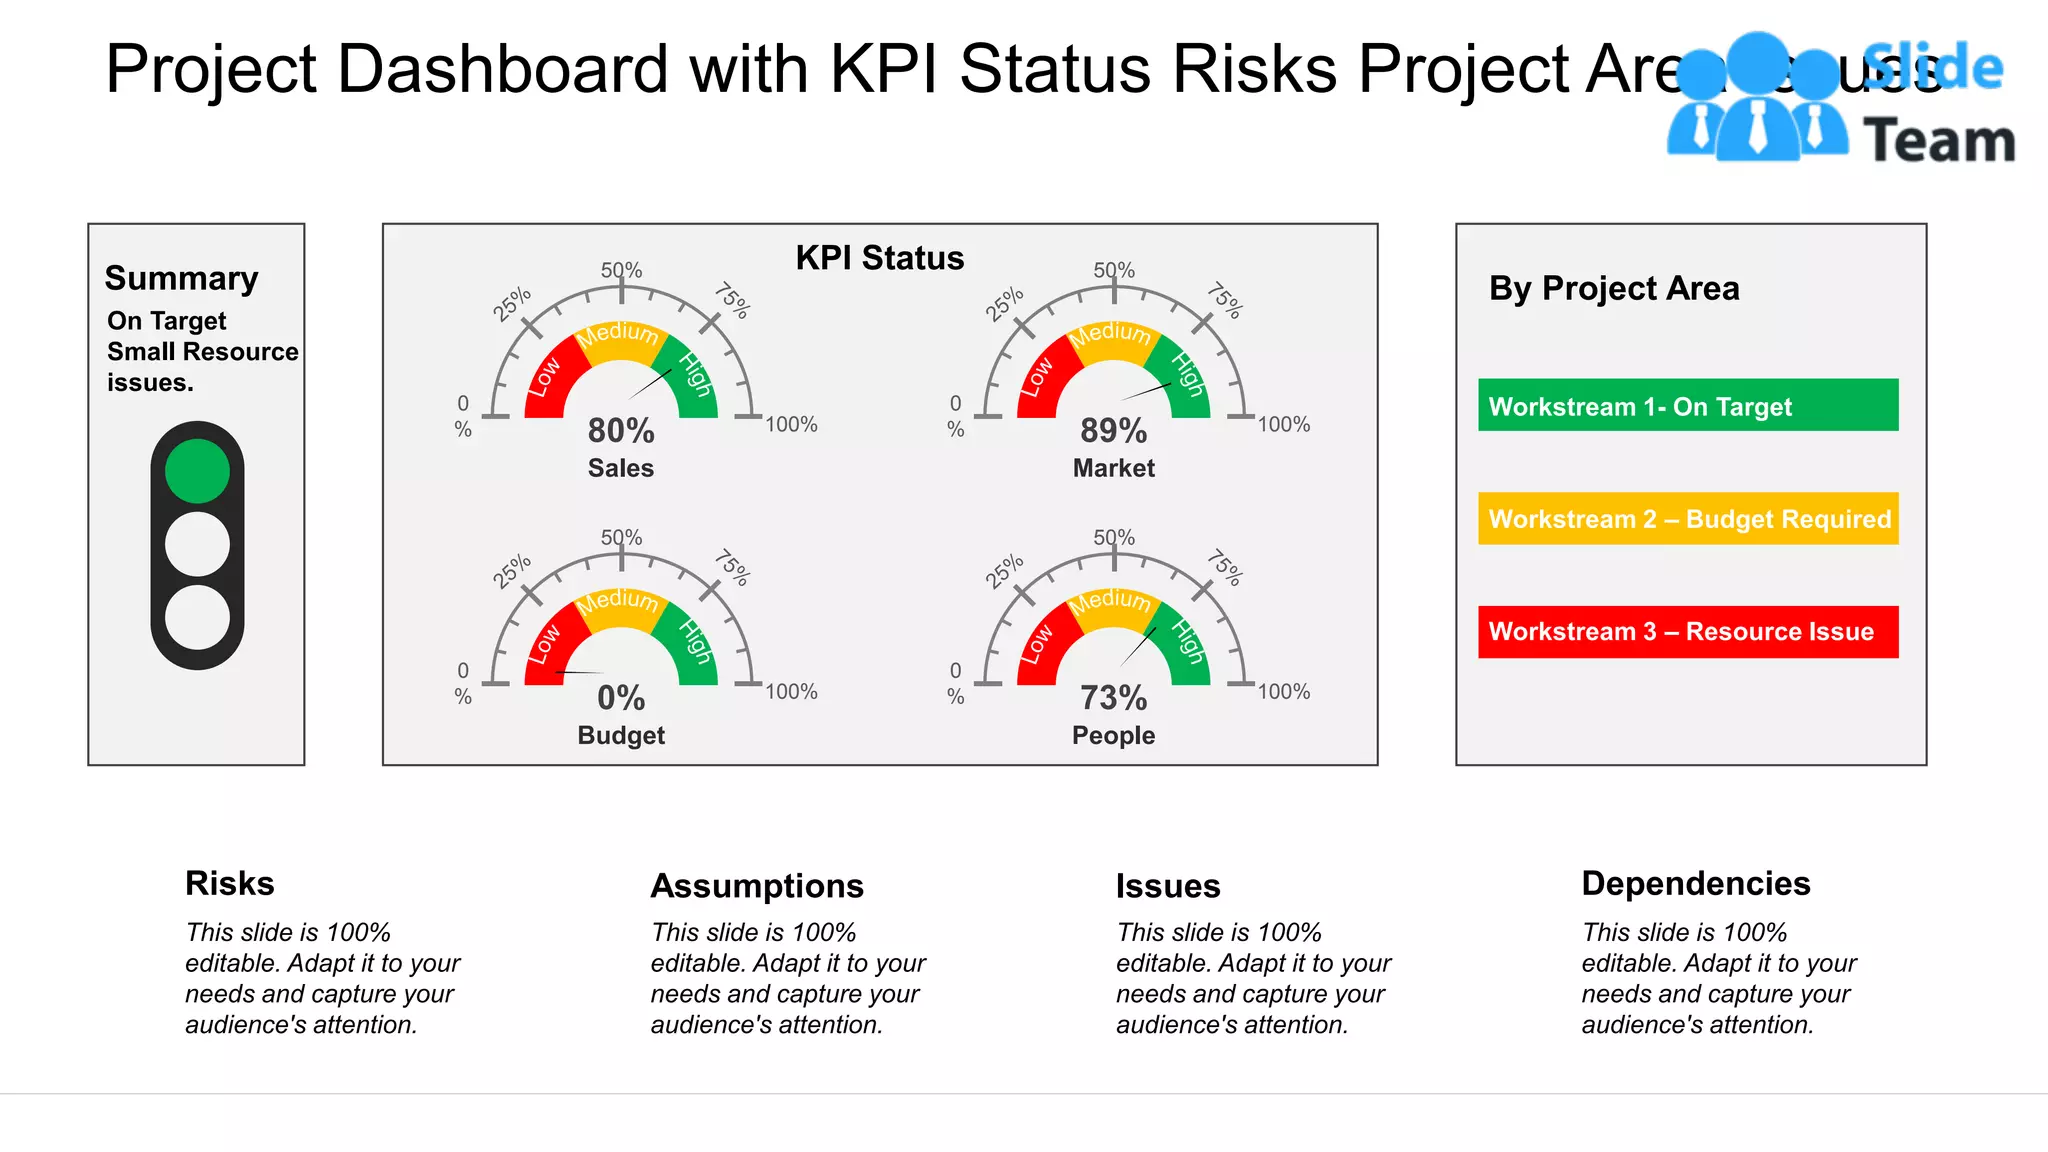
This slide presents a project dashboard with KPIs, status, risks, and issues across workstreams, emphasizing resource and budget concerns.
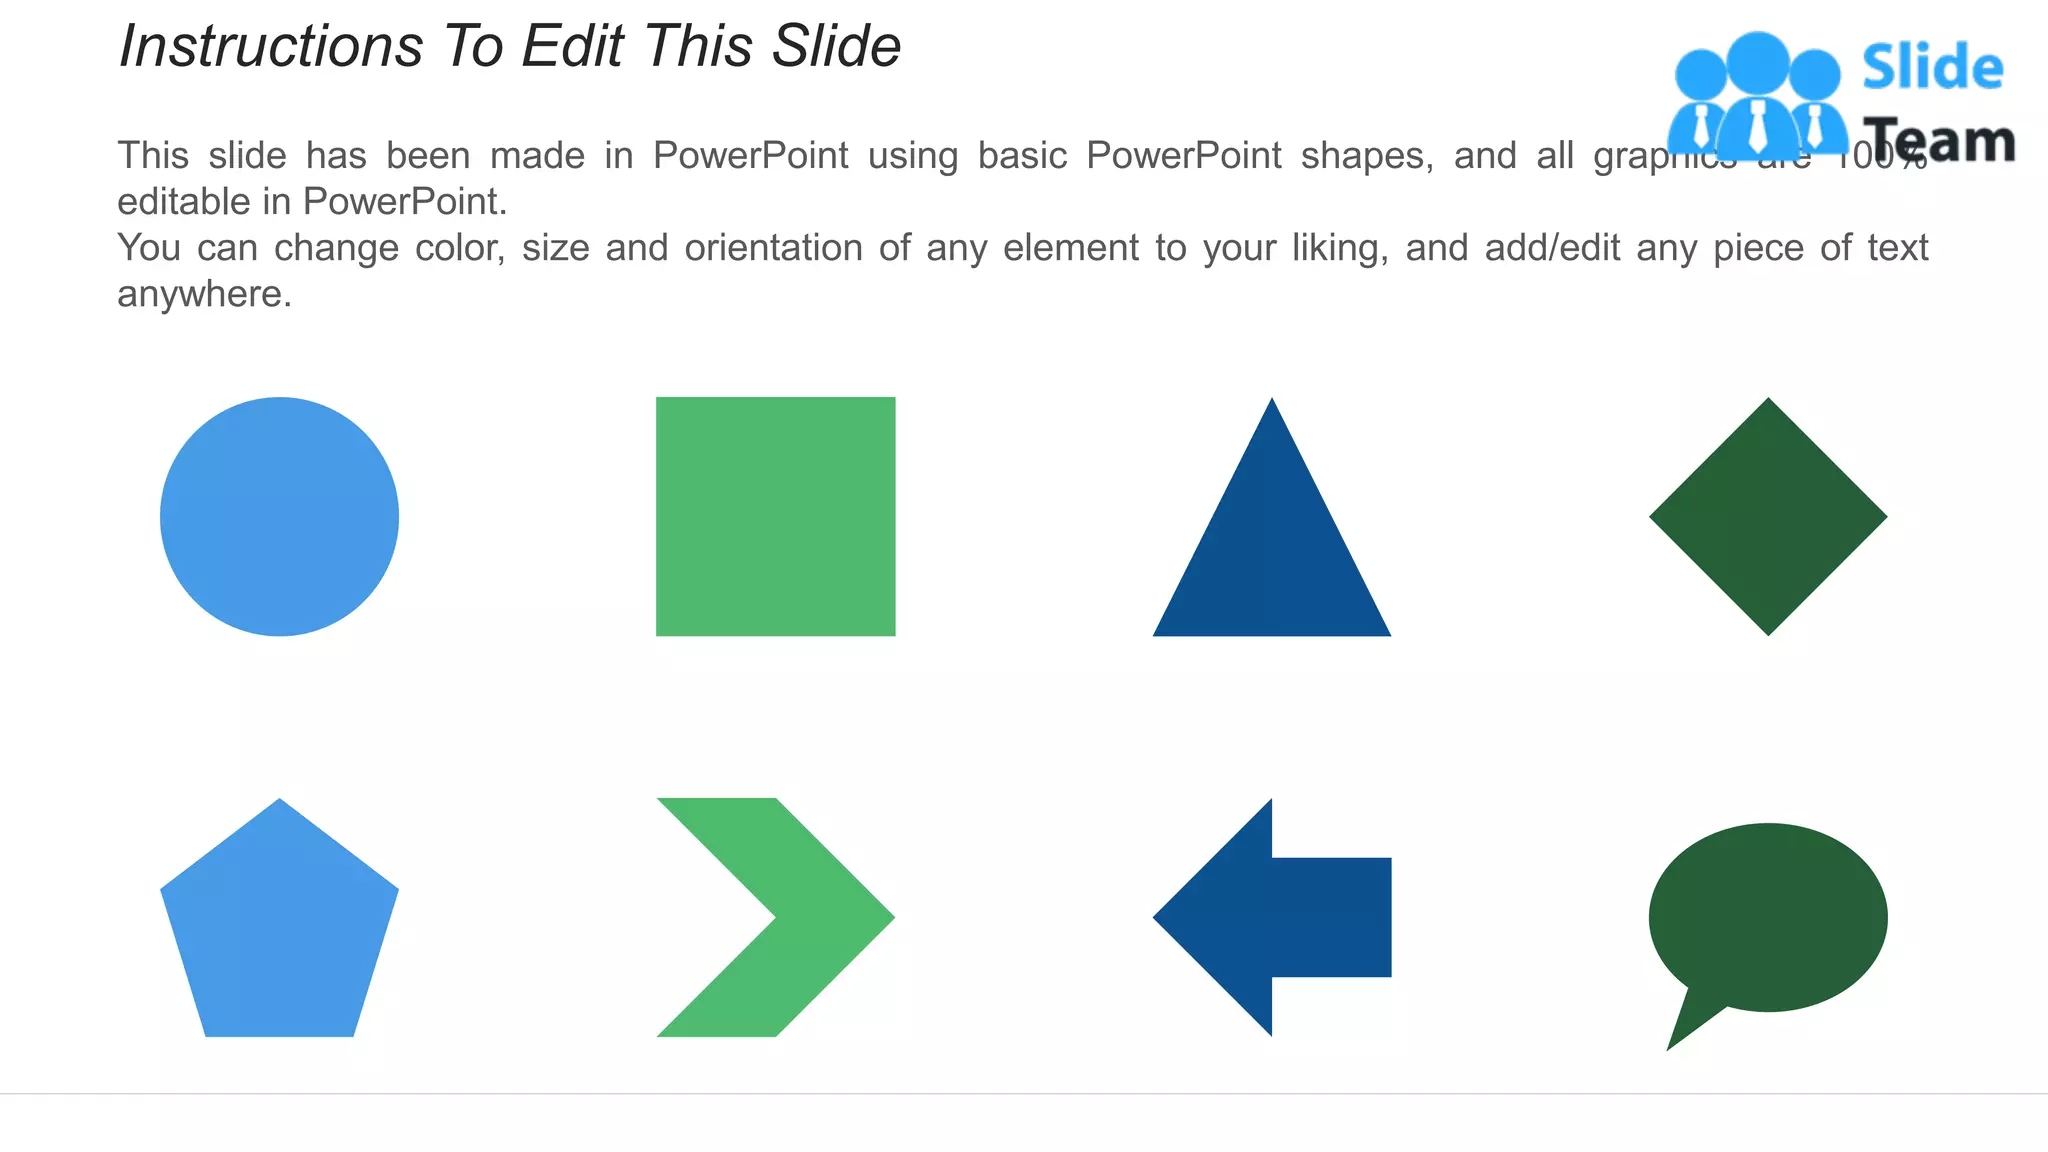
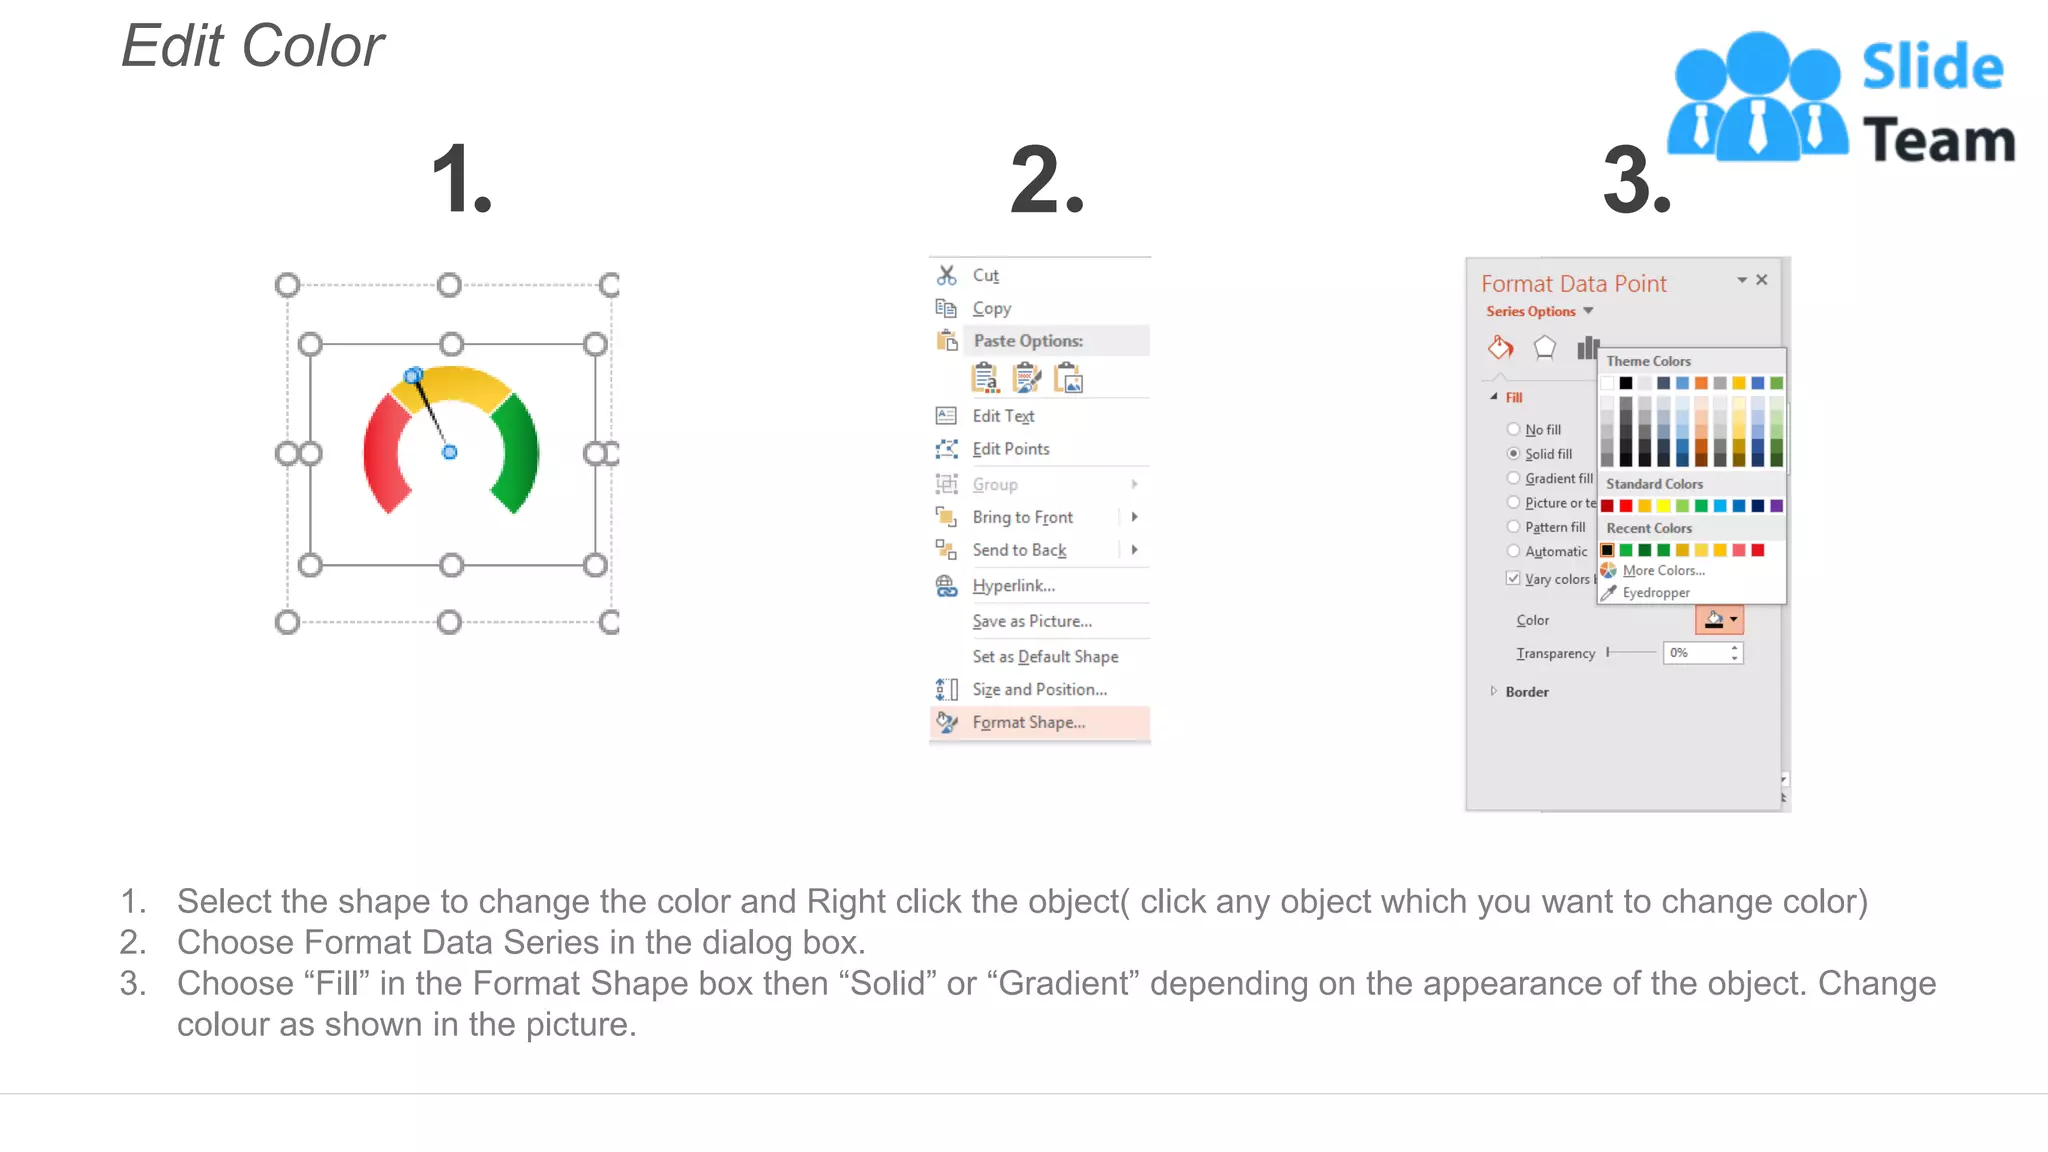
Instructions for editing PowerPoint slides using editable shapes, allowing customization of colors and text.
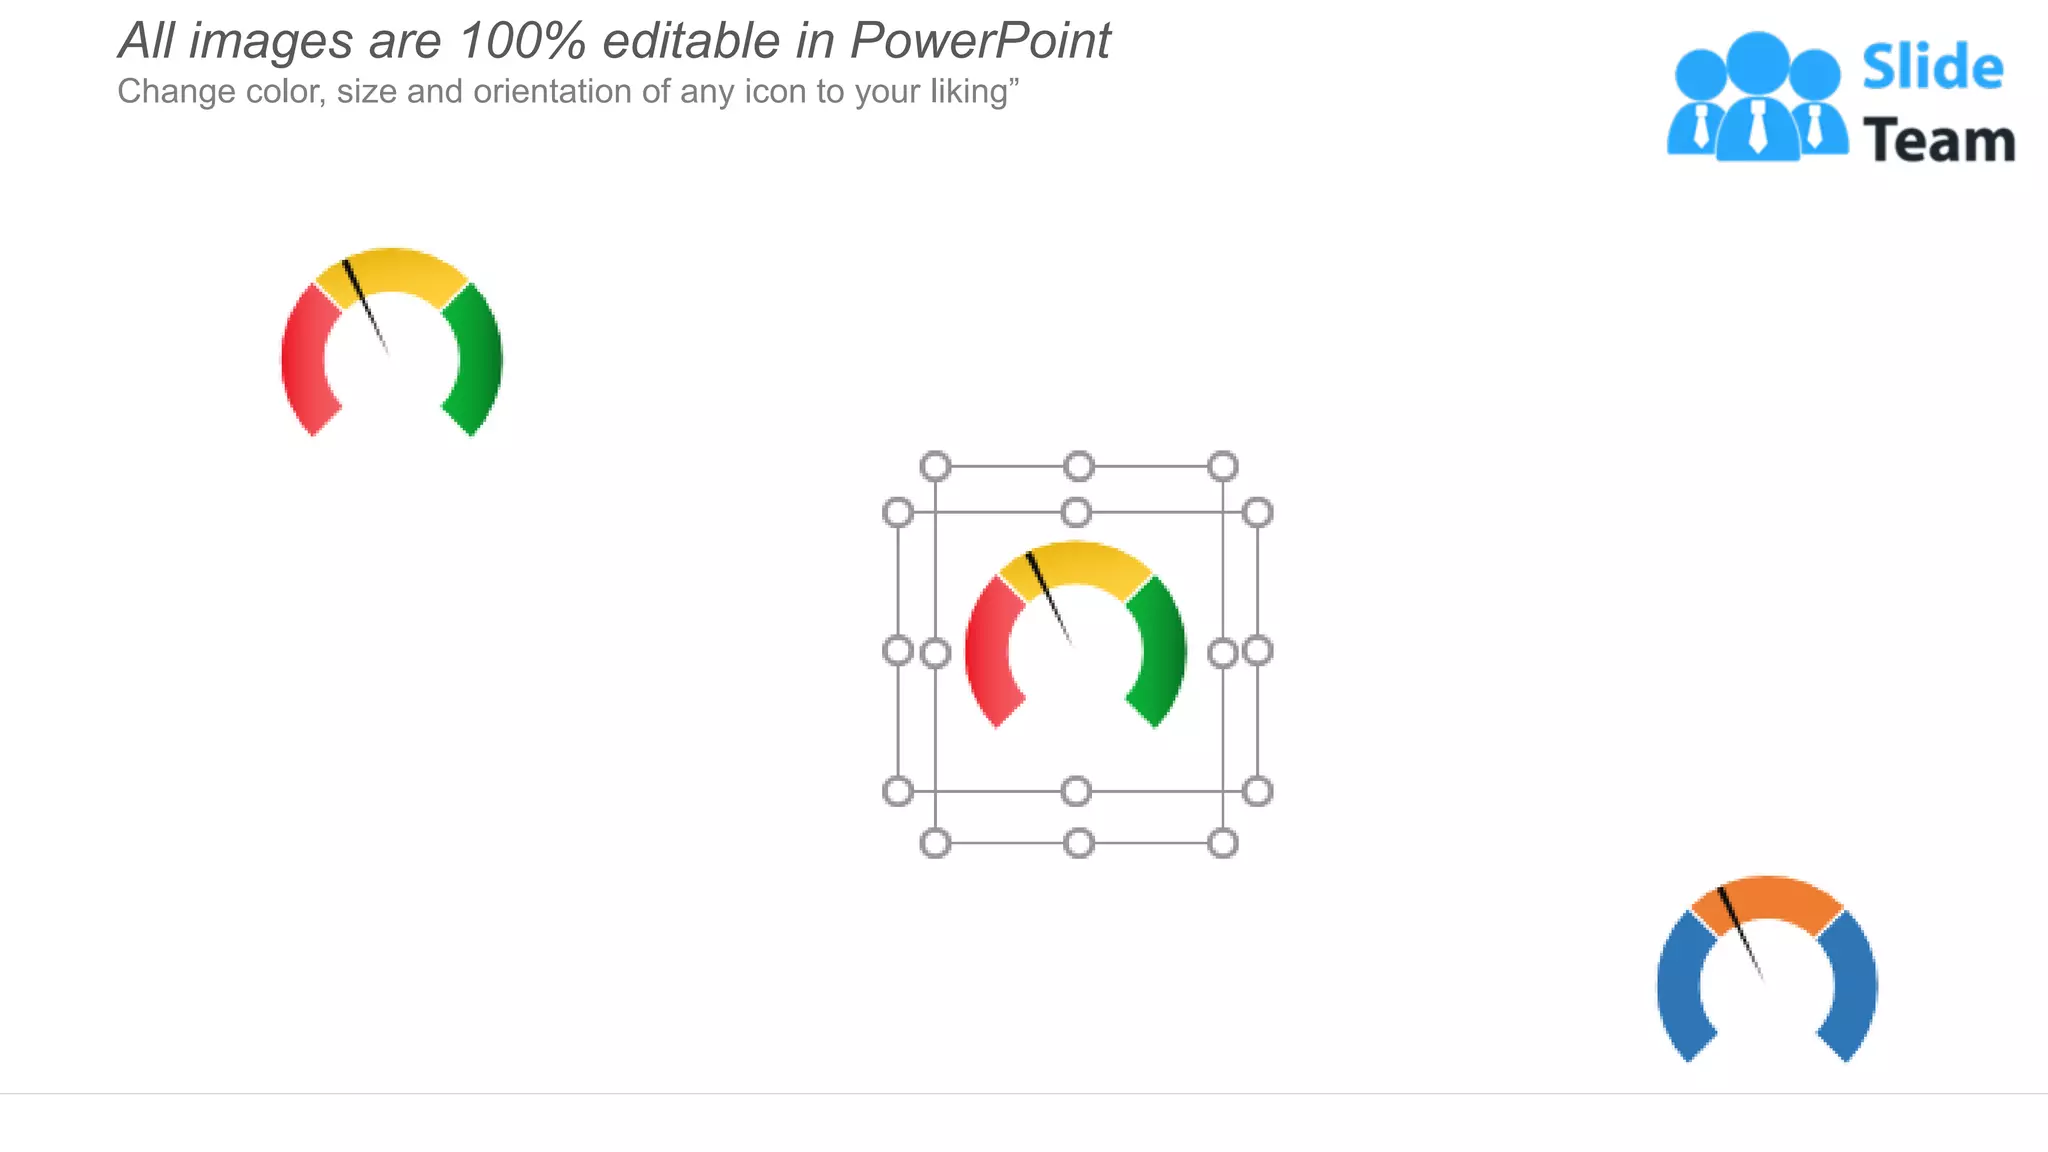
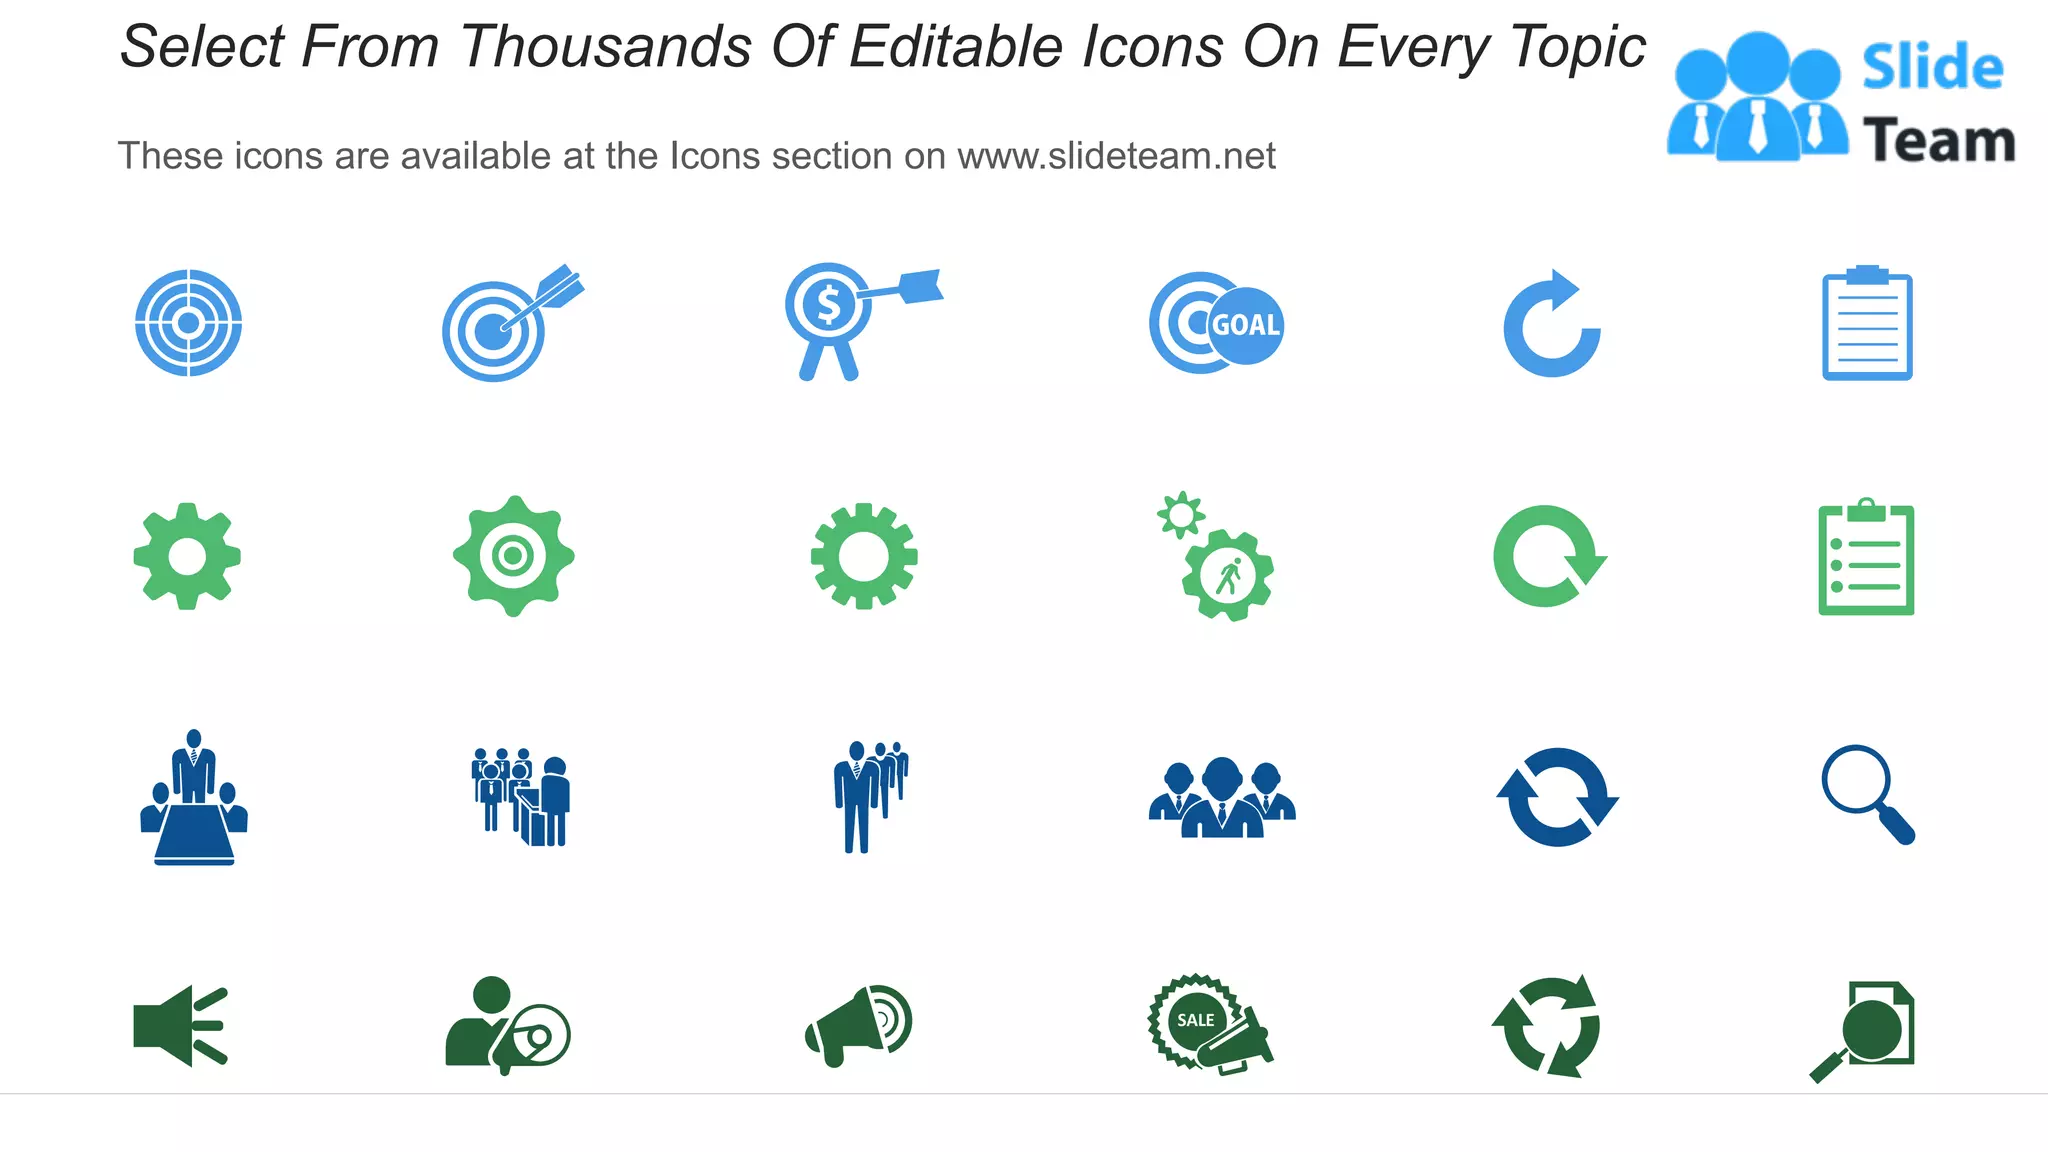
Details on how to customize icons and images within PowerPoint presentations to fit user preferences.
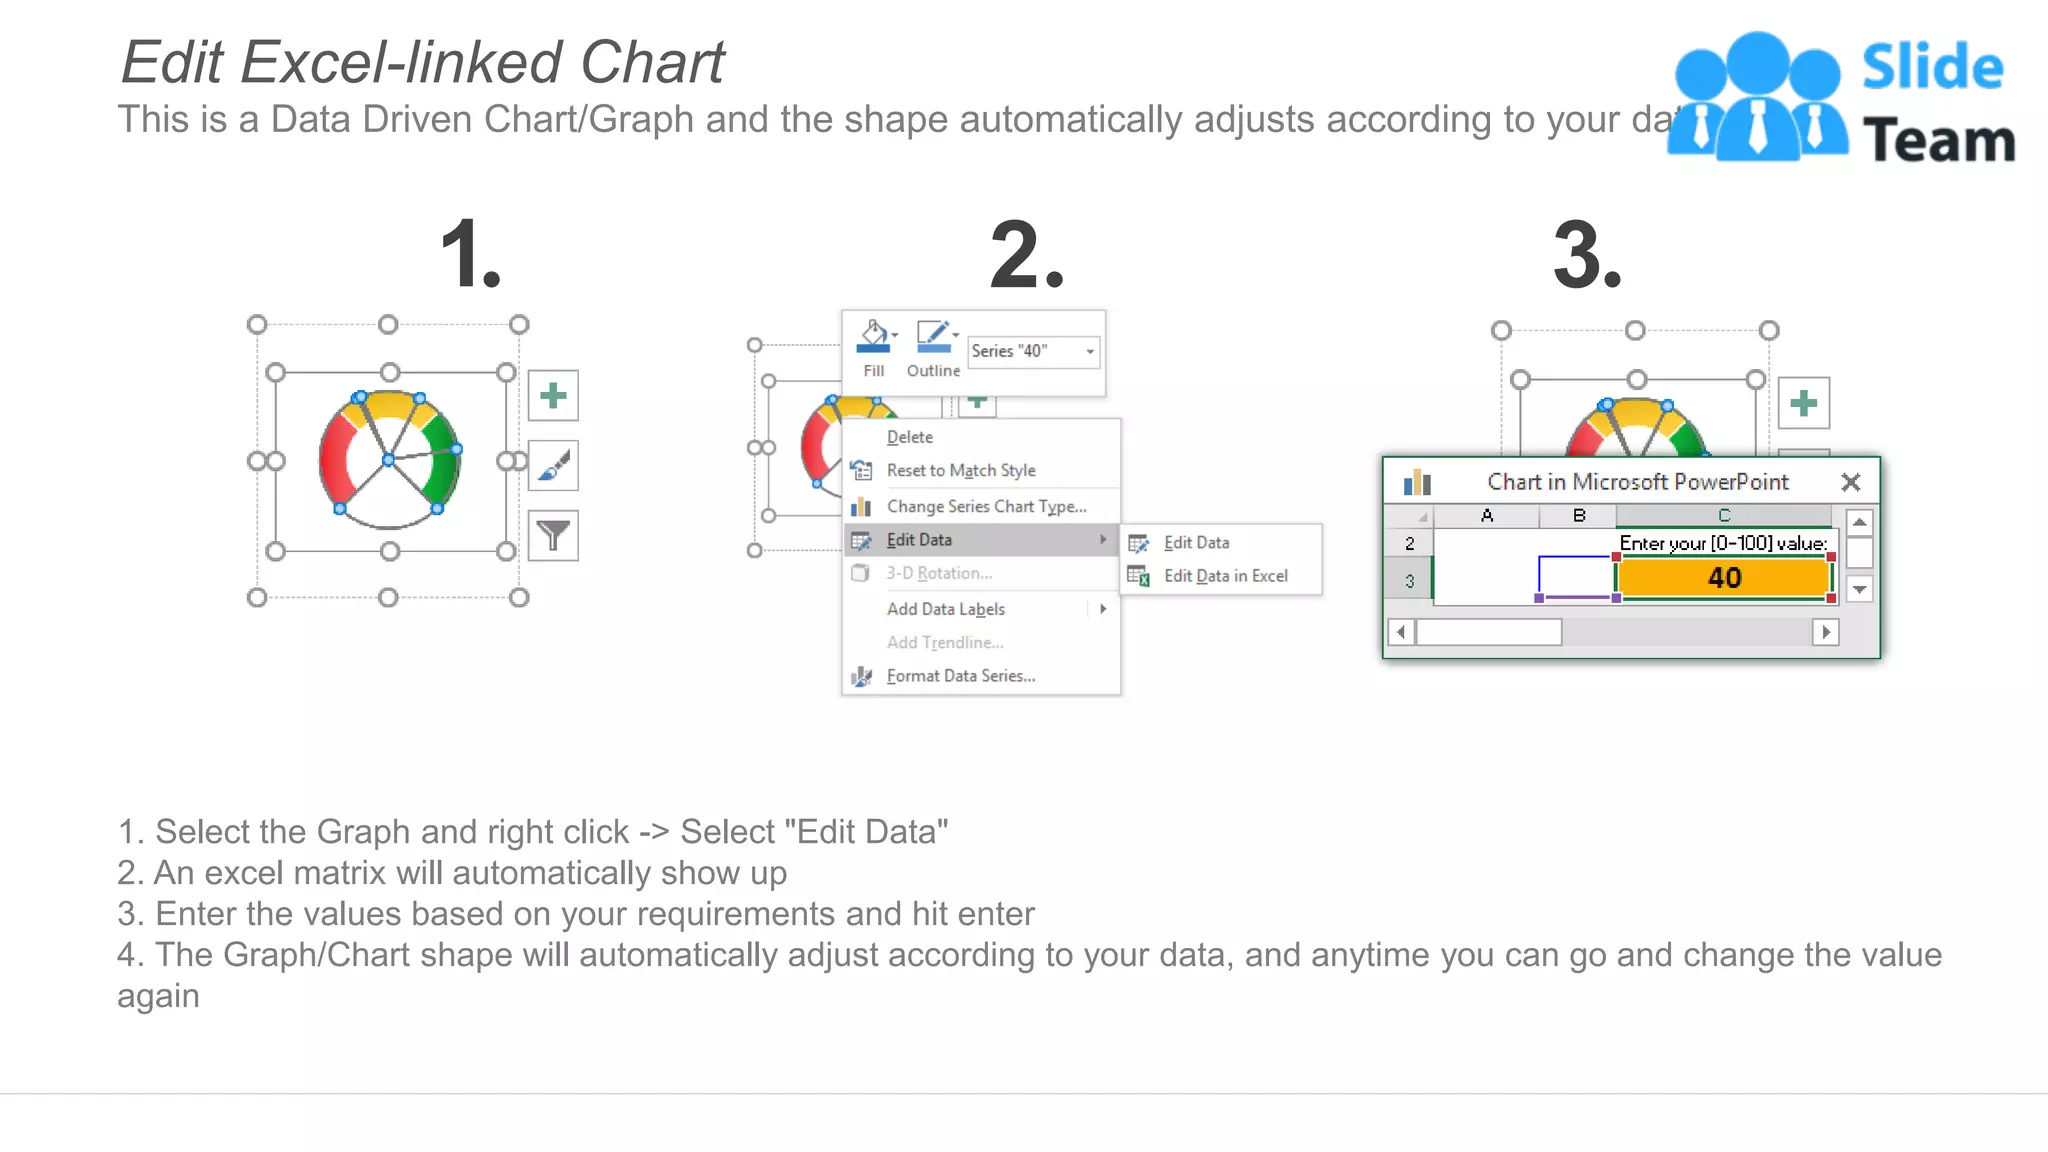
Instructions on editing linked charts in PowerPoint with Excel to automatically update data visualizations.
Guide on selecting and changing the colors of shapes in PowerPoint for better presentation aesthetics.
Information on sourcing and selecting from a wide range of editable icons for various presentation topics.


![PowerISO 9.2 Mac Crack + Serial Key Free Download 2026 [Latest] Software.pptx](https://cdn.slidesharecdn.com/ss_thumbnails/software-251207185653-5d5700e6-thumbnail.jpg?width=640&height=640&fit=bounds)


![Wondershare Filmora 15.0.11 Crack for Mac Key Full Download [Latest] pptx](https://cdn.slidesharecdn.com/ss_thumbnails/software-251207184836-1d16ba16-thumbnail.jpg?width=640&height=640&fit=bounds)


![iStat Menus 7.20 Crack for MacOS 2026 Full Version [Latest] pptx](https://cdn.slidesharecdn.com/ss_thumbnails/softwareoverview-251207191544-22b737dc-thumbnail.jpg?width=640&height=640&fit=bounds)


![Chapter4_Initiation_of_Sediment_Motion_v2[1].pptx](https://cdn.slidesharecdn.com/ss_thumbnails/chapter4initiationofsedimentmotionv21-251208223747-f94ef163-thumbnail.jpg?width=640&height=640&fit=bounds)
