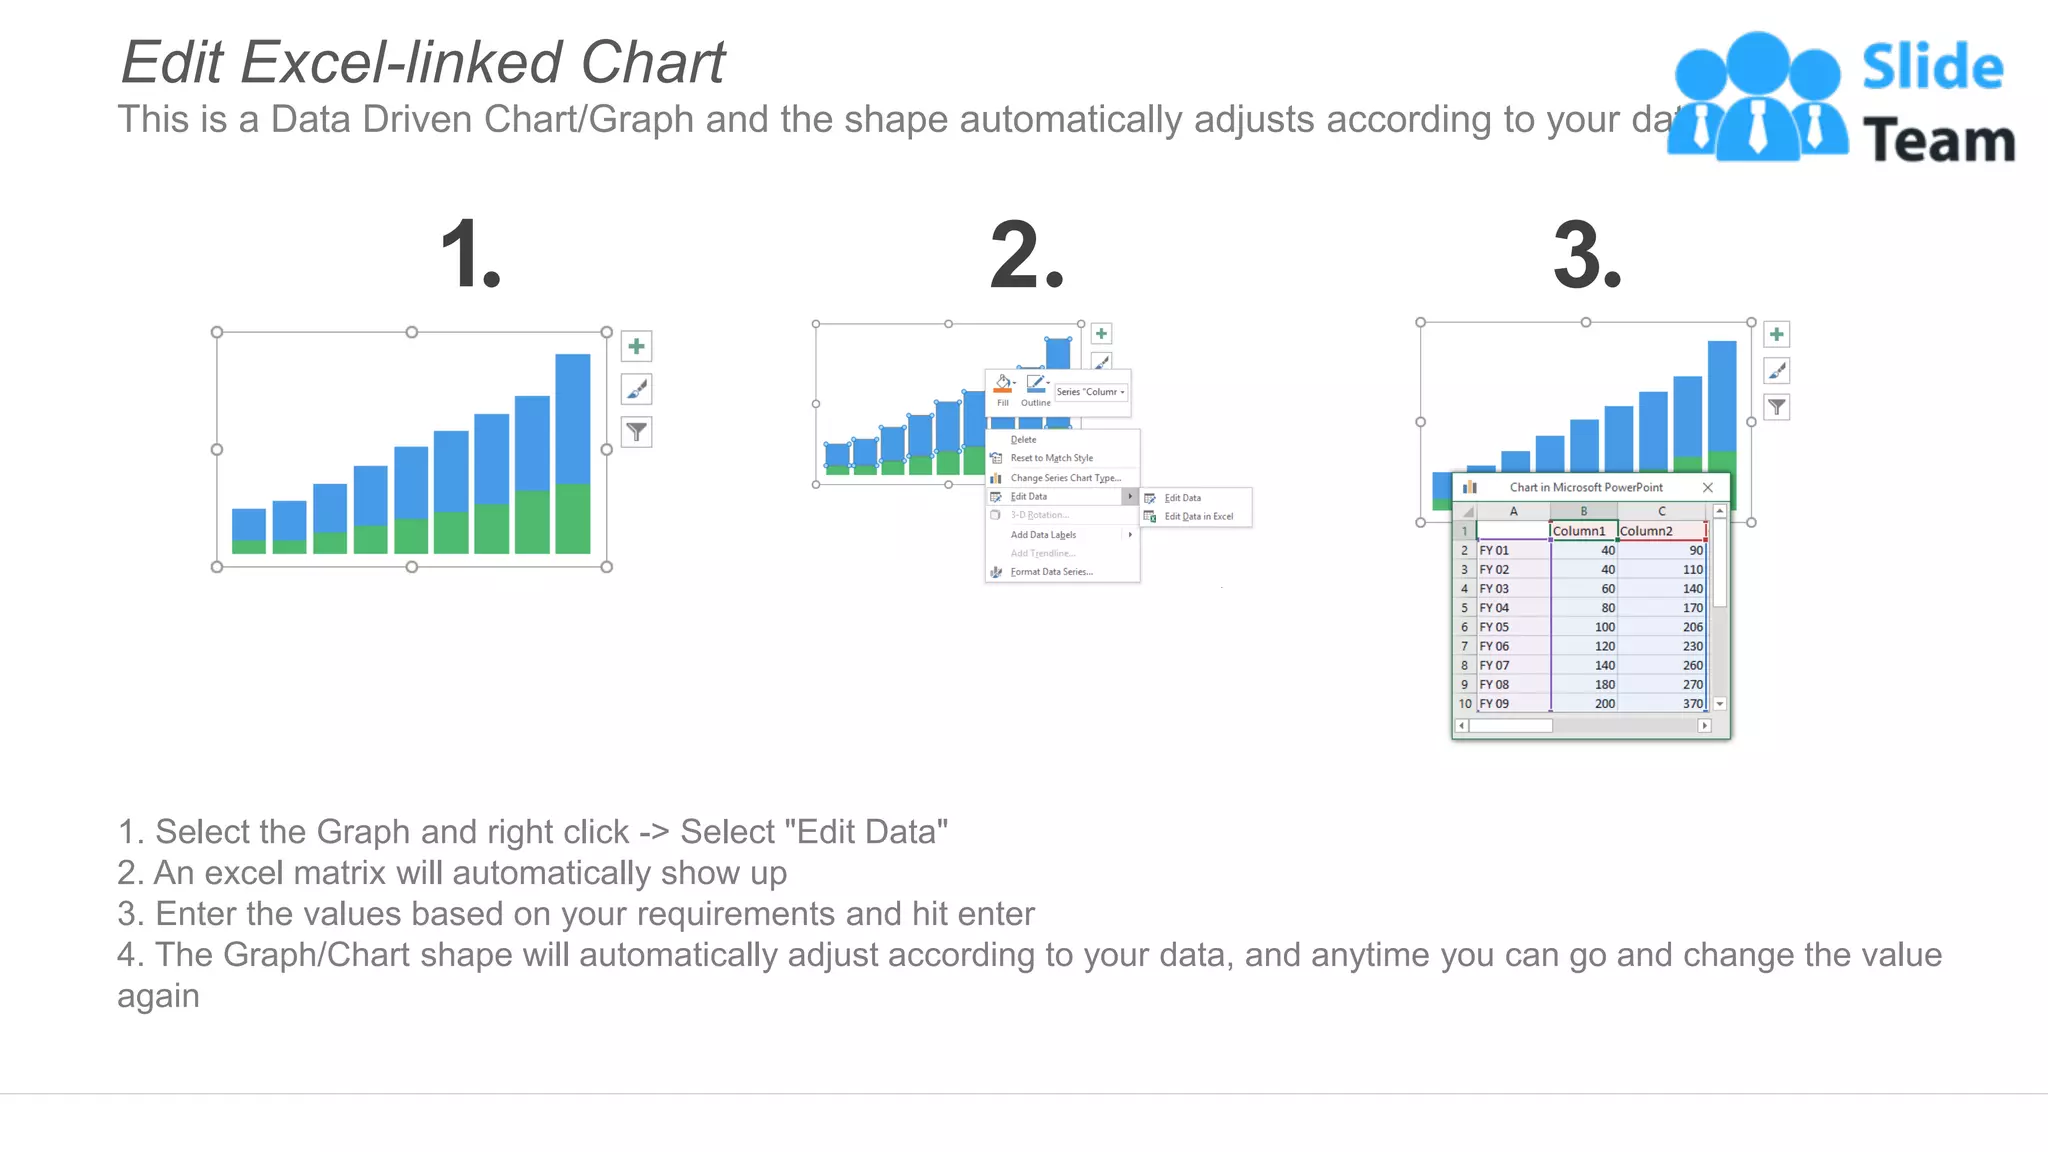
Procurement Purchase Order Cycle Dashboard
10%
25%
40%
55%
70%
2013 2014 2015 2016 2017 2018
Hundreds
Development Compliance Rate by Year
Contraect Rate Target 65%
7%
22%
35%
74%
76%
Digital Service
Hardware
Infrastructure
Marketing
Software
67%
Compliance Rate
5.4
4.5
2.9
3.6
4.9
6.4
Jan-18 Feb-18 Mar-18 Apr-18 May-18 Jun-18
Development of Avg. Purchase Order cycle (In Days)
120
375
280
No. Of Suppliers % of Suppliers
Short 15%
Medium 45%
Long 35%
0%
20%
40%
60%
80%
100%
Supplier Availability 9 Gold Partner
50 Silver Partner
100 Bronze Partner
0
200
400
600
800
1000
2013 2014 2015 2016 2017 2018
Number of Suppliers by Year
Controcted Supplier Unlisted Supplier
734
Suppliers
This graph/chart is linked to excel, and changes automatically based on data. Just left click on it and select “Edit Data”.
Instructions To Edit This Slide
This slide has been made in PowerPoint using basic PowerPoint shapes, and all graphics are 100%
editable in PowerPoint.
You can change color, size and orientation of any element to your liking, and add/edit any piece of text
anywhere.
All images are 100% editable in PowerPoint
Change color, size and orientation of any icon to your liking”
1. Select the Graph and right click -> Select "Edit Data"
2. An excel matrix will automatically show up
3. Enter the values based on your requirements and hit enter
4. The Graph/Chart shape will automatically adjust according to your data, and anytime you can go and change the value
again
Edit Excel-linked Chart
This is a Data Driven Chart/Graph and the shape automatically adjusts according to your data
1 2 3
Edit Color
1. Select the shape to change the color and Right click the object( click any object which you want to change color)
2. Choose Format Data Series in the dialog box.
3. Choose “Fill” in the Format Shape box then “Solid” or “Gradient” depending on the appearance of the object. Change
colour as shown in the picture.
1 2 3
Select From Thousands Of Editable Icons On Every Topic
These icons are available at the Icons section on www.slideteam.net

Procurement Purchase Order Cycle Dashboard

  • 1.
    Procurement Purchase OrderCycle Dashboard 10% 25% 40% 55% 70% 2013 2014 2015 2016 2017 2018 Hundreds Development Compliance Rate by Year Contraect Rate Target 65% 7% 22% 35% 74% 76% Digital Service Hardware Infrastructure Marketing Software 67% Compliance Rate 5.4 4.5 2.9 3.6 4.9 6.4 Jan-18 Feb-18 Mar-18 Apr-18 May-18 Jun-18 Development of Avg. Purchase Order cycle (In Days) 120 375 280 No. Of Suppliers % of Suppliers Short 15% Medium 45% Long 35% 0% 20% 40% 60% 80% 100% Supplier Availability 9 Gold Partner 50 Silver Partner 100 Bronze Partner 0 200 400 600 800 1000 2013 2014 2015 2016 2017 2018 Number of Suppliers by Year Controcted Supplier Unlisted Supplier 734 Suppliers This graph/chart is linked to excel, and changes automatically based on data. Just left click on it and select “Edit Data”.
  • 2.
    Instructions To EditThis Slide This slide has been made in PowerPoint using basic PowerPoint shapes, and all graphics are 100% editable in PowerPoint. You can change color, size and orientation of any element to your liking, and add/edit any piece of text anywhere.
  • 3.
    All images are100% editable in PowerPoint Change color, size and orientation of any icon to your liking”
  • 4.
    1. Select theGraph and right click -> Select "Edit Data" 2. An excel matrix will automatically show up 3. Enter the values based on your requirements and hit enter 4. The Graph/Chart shape will automatically adjust according to your data, and anytime you can go and change the value again Edit Excel-linked Chart This is a Data Driven Chart/Graph and the shape automatically adjusts according to your data 1 2 3
  • 5.
    Edit Color 1. Selectthe shape to change the color and Right click the object( click any object which you want to change color) 2. Choose Format Data Series in the dialog box. 3. Choose “Fill” in the Format Shape box then “Solid” or “Gradient” depending on the appearance of the object. Change colour as shown in the picture. 1 2 3
  • 6.
    Select From ThousandsOf Editable Icons On Every Topic These icons are available at the Icons section on www.slideteam.net