business_kpi_dashboard_showing_revenue_and_customer_lifetime_value_wd.pptx
•Download as PPTX, PDF•
0 likes•17 views

PM KPIs

Recommended
Recommended
More Related Content
Similar to business_kpi_dashboard_showing_revenue_and_customer_lifetime_value_wd.pptx
Similar to business_kpi_dashboard_showing_revenue_and_customer_lifetime_value_wd.pptx (20)
Recently uploaded
Recently uploaded (20)
business_kpi_dashboard_showing_revenue_and_customer_lifetime_value_wd.pptx
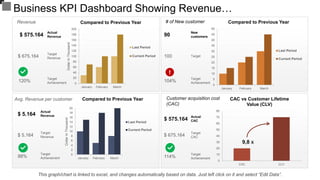
- 1. Business KPI Dashboard Showing Revenue… This graph/chart is linked to excel, and changes automatically based on data. Just left click on it and select “Edit Data”. 0 2 4 6 8 10 12 14 16 18 20 January February March Dollar In Thousand Compared to Previous Year Last Period Current Period Avg. Revenue per customer Actual Revenue $ 5.164 Target Revenue $ 5.164 Target Achievement 88% 0 20 40 60 80 100 120 140 160 180 200 January February March Dollar In Thousand Compared to Previous Year Last Period Current Period Revenue Actual Revenue $ 575.164 Target Revenue $ 675.164 Target Achievement 120% 0 5 10 15 20 25 30 35 40 45 50 January February March Compared to Previous Year Last Period Current Period # of New customer New customers 90 Target 100 Target Achievement 104% 0 10 20 30 40 50 60 70 80 CAC CLV CAC vs Customer Lifetime Value (CLV) 9,8 X Customer acquisition cost (CAC) Actual CAC $ 575.164 Target CAC $ 675.164 Target Achievement 114%
- 2. Instructions To Edit This Slide This slide has been made in PowerPoint using basic PowerPoint shapes, and all graphics are 100% editable in PowerPoint. You can change color, size and orientation of any element to your liking, and add/edit any piece of text anywhere.
- 3. All images are 100% editable in PowerPoint Change color, size and orientation of any icon to your liking”
- 4. 1. Select the Graph and right click -> Select "Edit Data" 2. An excel matrix will automatically show up 3. Enter the values based on your requirements and hit enter 4. The Graph/Chart shape will automatically adjust according to your data, and anytime you can go and change the value again Edit Excel-linked Chart This is a Data Driven Chart/Graph and the shape automatically adjusts according to your data 1 2 3
- 5. Edit Color 1. Select the shape to change the color and Right click the object( click any object which you want to change color) 2. Choose Format Data Series in the dialog box. 3. Choose “Fill” in the Format Shape box then “Solid” or “Gradient” depending on the appearance of the object. Change colour as shown in the picture. 1 2 3
- 6. Select From Thousands Of Editable Icons On Every Topic These icons are available at the Icons section on www.slideteam.net