Unit1f global disaster trends
•Download as PPTX, PDF•
0 likes•2,661 views

global disaster trends

Recommended
More Related Content
What's hot
What's hot (20)
Similar to Unit1f global disaster trends
Similar to Unit1f global disaster trends (20)
More from Dr.R. SELVAM
More from Dr.R. SELVAM (20)
Recently uploaded
Recently uploaded (20)
Unit1f global disaster trends
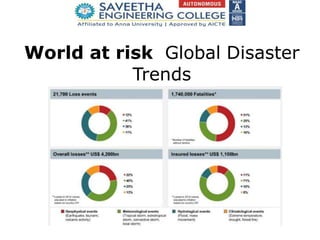
- 1. World at risk Global Disaster Trends
- 3. Hazard trends (2) •The graph on the last slide shows that the number of reported disasters has risen significantly in recent years. •Part of this rise is likely to be due to more accurate recording and better communications with isolated regions. •Note the rapid rise since around 1960, when satellite remote sensing and global communications began. •Population growth has led to more people living in potentially hazardous locations. This means there are greater numbers at risk. •Many of these people at risk live in the developing world, and are vulnerable due to their low coping capacity.
- 4. Hazard trends (3) Number of natural disasters by type, 1970–2005
- 5. Hazard trends (4) • • • Some types of disaster show clearer trends thanothers. • The graph on the last slide compares trends in three disaster types. • The trend for earthquakes is fairly stable. There is no evidence that the number of earthquake events is increasing. There are likely to have been more people in earthquake-prone areas in 2000 than in 1980, and this would explain the slight rise in disasters. There is a clearer upward trend for floods and wind storms. This may indicate an increase in the vulnerable population and a rise in the number ofhazardous events. It could be the result of global climate change and/or other environmental changes.
- 6. Hazard trends (5) • • • • Around 50–70 volcanoes erupt every year. There is no trend, upward or downward, in eruption frequency. • Very large magnitude eruptions (e.g. Mt Pinatubo in 1991) are rare. There is a rising trend in the number of people affected (see table). Notice that 8 of the top 10 eruptions have occurred since 1990. This reflects growing population density in the developing world. Country Year Number of people affected Philippines (Mt Pinatubo) 1991 1,036,065 Nicaragua 1992 300,075 Ecuador 2006 300,013 Indonesia 1982 300,000 Indonesia 1969 250,000 Comoros 2005 245,000 Philippines 1993 165,009 Papua New Guinea 1994 152,002 Ecuador 2002 128,150 Dem. Rep. Congo 2002 110,400 Top ten volcanic eruptions since 1900 by number of people affected
- 7. Hurricane trends (1) • • • Trends in hurricanes, especially in the Atlantic, are a controversial matter. Some researchers have linked increased hurricane activity to global warming. Others argue that there is a natural cycle in the Atlantic called the Atlantic Multidecadal Oscillation (AMO) which explains the high number of major hurricanes in the 1940s and 1950s, and more recently. • Despite variations in major hurricane frequency, there is a long-term trend in the USA of falling hurricane-related deaths but rising economic costs.
- 8. Hurricane trends (2) • • • • One certain trend is the rise in the number of people living on the UScoast. In Florida and the Gulf Coast, some coastal areas have seen populations rise by 400% since 1980. This means increasing numbers of people are at risk from hurricanes. Although awareness of hurricanes, education, warning and evacuation systems have all improved in the USA, the potential for economic loss continues to grow as coastal populations rise. • The full impact of rising populations was felt in 2005, when the Florida and Gulf Coasts were struck by five major hurricanes (Dennis, Emily, Wilma, Rita, Katrina), causing an estimated US$120 billion in damage and the loss of 2,200 lives.
- 10. Global warming (2) • • • • • Many scientists believe that increased global warming will lead to more unpredictable weather and a rise in extreme weather events. Global temperatures have risen since 1910, and at a consistently rapid rate since the late 1970s. The fact that there are only 30–35 years of reliable data about global temperatures makes the scientists’ task of accurately predicting future changes more difficult. Some data, such as the 20 cm rise in global sea level since 1900 and thedecline in Arctic sea ice since the 1970s, are more reliable. There is growing suspicion that rising trends in drought and flood events may herald the effects of global warming to come.
- 11. Flood disaster trends (1) Reported global flood disasters and death tolls, 1977–2007
- 12. Flood disaster trends (2) • • Trends in global flood disasters show significant rises since the early 1990s. This could be an early signal of climate change. • It may also be related to rising populations, rapid urbanisation, deforestation and other land-use changes. • Separating the climate change signal from the human factors that increase flood risk is a real challenge.
- 13. El Niño/La Niña • • As well as global warming, the El Niño/La Niña cycle is known to haveclimatic consequences on a global scale. • Changes in Pacific Ocean circulation have knock-on weather effects in otherparts of the world through teleconnections. • Hazards associated with El Niño are well known, such as drought in Indonesia and flooding in Peru. El Niño/La Niña cycles, which are unpredictable, add yet another layerof complexity to the calculation of hazardrisk.
- 14. Summer 2007 UK floods • • • • In summer 2007, many areas in theUK received over 100 mm of rainfall in 24 hours, causing widespread flooding. The media were quick to link the unprecedented flooding (50,000 homes and 7,000 businesses flooded, total cost £3 billion+) to global warming. The basic cause of the flooding was a southerly jet stream, meaning low pressure and rain over the UK at a time when high pressure was to be expected. Many meteorologists have linked this situation to La Niña conditions in the Pacific. Rainfall pattern, summer 2007
- 15. Human trends (1) • • • • Some trends among the human population add to increasingrisk. One of these is urbanisation. Over 50% of the world’s population now lives in urban areas, compared to 29% in 1950. These crowded spaces are especially vulnerable to major earthquakes, floods and hurricanes. • World poverty continues to be a major issue, reducing the capacity tocope with, and increasing the vulnerability to hazards. Although the global proportion of people living on less than $1 per day is falling, total numbers rose from 36 million to 50 million in Latin America, and 164 to 314 million in Africa between 1981 and 2001.
- 16. Human trends (2) • • Pressure on land from growing populations leads to deforestation and conversion to farmland. • Deforestation can significantly increase hazard risk. • The risk of landslide is greater on slopes when trees areremoved. • With no vegetation to intercept rain, flash-flood risk rises. • Without the evapotranspiration provided by trees, rainfall becomes more variable and aridity increases. Occasional flash floods can produce a cocktail of increased hazard risk and falling food and water security.
- 17. Global trends Disasters related to human development levels Overall, global trends show that the numbers of reported disasters and people affected are rising, but the number of people killed by disasters is falling.
- 18. Disaster management (1) Disaster management cycle Falling death tolls suggest improvements in disaster management.
- 19. Disaster management (2) • • • • • • Death tolls are reduced when populations are prepared for a possible hazard. Some hazards can be predicted, e.g. floods, hurricanes, drought and volcanic eruptions. Prediction allows for warning, and, when possible, evacuation. This can save lives, but is unlikely to reduce economic losses. After a disaster, immediate rescue and relief is essential. ‘Rapid response’ has improved considerably over the last few decades. International relief efforts now occur quickly in response todisasters. This saves lives but the numbers affected and the economic losses are still high. The challenge is to ‘disaster proof’ communities using appropriate building techniques, land-use zoning, education and developing prevention technology. These responses are longer term, costly and beyond the reach of many in the developing world.