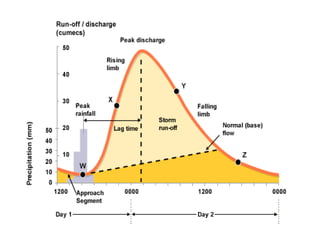
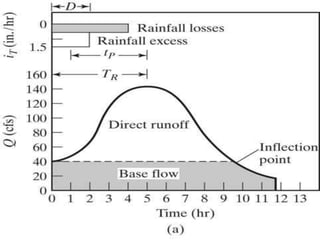
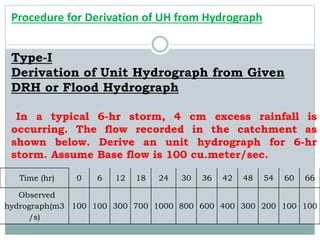
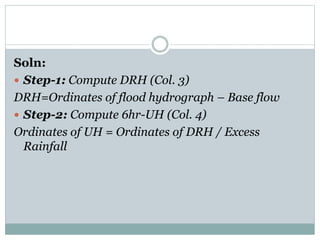
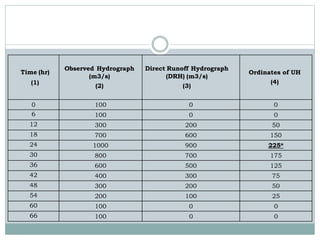
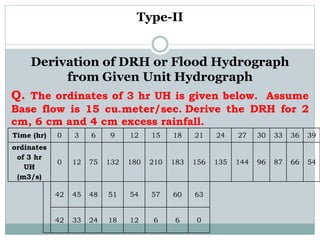
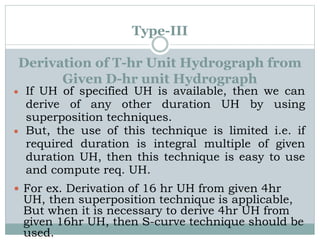
Unit Hydrograph
Prepared by
Prof. S. G. Taji
Dept. of Civil Engineering
S.R.E.S’s Sanjivani College of Engineering,
Kopargaon
HYDROGRAPH
It is a graph showing the rate of
flow (discharge) versus time past a
specific point in a river, or other
channel or conduit carrying flow.
It can also called as a graph
showing the volume of water
reaching a particular outfall.
 Such hydrographs are commonly used in the
design of sewerage, more specifically, the
design of surface water sewerage systems
and combined sewers.
COMPONENTS OF A HYDROGRAPH
 Rising limb:
 The rising limb of hydro graph, also known as concentration
curve, reflects a prolonged increase in discharge from a catchment
area, typically in response to a rainfall event
 Recession (or falling) limb:
 The recession limb extends from the peak flow rate onward.
 The end of stormflow (aka quickflow or direct runoff) and the
return to groundwater-derived flow (base flow) is often taken as
the point of inflection of the recession limb.
 The recession limb represents the withdrawal of water from the
storage built up in the basin during the earlier phases of the
hydrograph.
Peak discharge:
 The highest point on the hydro graph when the rate of
discharge is greatest
Lag time:
 The time interval from the center of mass of rainfall excess
to the peak of the resulting hydrograph
Time to peak:
 The time interval from the start of the resulting hydro graph
Discharge:
 The rate of flow (volume per unit time) passing a specific
location in a river or other channel
Hydrograph usually consists of a fairly regular
lower portion that changes slowly throughout the
year and a rapidly fluctuating component that
represents the immediate response to rainfall.
The lower, slowly changing portion is termed
base flow. The rapidly fluctuating component is
called direct runoff.
Unit Hydrograph
UNIT HYDROGRAPH
 The amount of run-off resulting from 1 unit (1cm,
1mm, 1ft, etc.) of rainfall excess.
 is essentially a tool for determining the direct runoff
response to rainfall.
 Once you know the watershed’s response to one
storm, you can predict what its response for another
will look like.
Basic Assumptions of UH
UH
1. The effective rainfall is uniformly distributed within its duration
2. The effective rainfall is uniformly distributed over the whole
drainage basin
3. The base duration of direct runoff hydrograph due to an effective
rainfall of unit duration is constant.
4. The ordinates of DRH are directly proportional to the total
amount of DR of each hydrograph
5. For a given basin, the runoff hydrograph due to a given period of
rainfall reflects all the combined physical characteristics of basin
(time-invariant)
Procedure for Derivation of UH from Hydrograph
Type-I
Derivation of Unit Hydrograph from Given
DRH or Flood Hydrograph
Time (hr) 0 6 12 18 24 30 36 42 48 54 60 66
Observed
hydrograph(m3
/s)
100 100 300 700 1000 800 600 400 300 200 100 100
In a typical 6-hr storm, 4 cm excess rainfall is
occurring. The flow recorded in the catchment as
shown below. Derive an unit hydrograph for 6-hr
storm. Assume Base flow is 100 cu.meter/sec.
Soln:
 Step-1: Compute DRH (Col. 3)
DRH=Ordinates of flood hydrograph – Base flow
 Step-2: Compute 6hr-UH (Col. 4)
Ordinates of UH = Ordinates of DRH / Excess
Rainfall
Time (hr)
(1)
Observed Hydrograph
(m3/s)
(2)
Direct Runoff Hydrograph
(DRH) (m3/s)
(3)
Ordinates of UH
(4)
0 100 0 0
6 100 0 0
12 300 200 50
18 700 600 150
24 1000 900 225*
30 800 700 175
36 600 500 125
42 400 300 75
48 300 200 50
54 200 100 25
60 100 0 0
66 100 0 0
Type-II
Derivation of DRH or Flood Hydrograph
from Given Unit Hydrograph
Time (hr) 0 3 6 9 12 15 18 21 24 27 30 33 36 39
ordinates
of 3 hr
UH
(m3/s)
0 12 75 132 180 210 183 156 135 144 96 87 66 54
42 45 48 51 54 57 60 63
42 33 24 18 12 6 6 0
Q. The ordinates of 3 hr UH is given below. Assume
Base flow is 15 cu.meter/sec. Derive the DRH for 2
cm, 6 cm and 4 cm excess rainfall.
(1)11 (2) (2)*2=(3) (2)*6=(4) (2)*4=(5)
Time (hr) ordinates of 3 hr
UH
DRH due to 2 cm
ER
DRH due to 6 cm ER DRH due to 4 cm ER
0 0 0 0 0
3 12 24 72 48
6 75 150 450 300
9 132 264 792 528
12 180 360 1080 720
15 210 420 1260 840*
18 183 366 1098 732
21 156 312 936 624
24 135 270 810 540
27 144 288 864 576
30 96 192 576 384
33 87 174 522 348
36 66 132 396 264
39 54 108 324 216
42 42 84 252 168
45 33 66 198 132
48 24 48 144 96
51 18 36 108 72
54 12 24 72 48
57 6 12 36 24
60 6 12 36 24
63 0 0 0 0
Type-III
Derivation of T-hr Unit Hydrograph from
Given D-hr unit Hydrograph
 If UH of specified UH is available, then we can
derive of any other duration UH by using
superposition techniques.
 But, the use of this technique is limited i.e. if
required duration is integral multiple of given
duration UH, then this technique is easy to use
and compute req. UH.
 For ex. Derivation of 16 hr UH from given 4hr
UH, then superposition technique is applicable,
But when it is necessary to derive 4hr UH from
given 16hr UH, then S-curve technique should be
used.
Type-III (A): Derivation of req. T-hr UH from Given
D-hr UH (where T is the multiple integral of D)
Time (hr) 0 3 6 9 12 15 18 21 24 27 30 33 36 39
ordinates of
3 hr UH
(m3/s)
0 12 75 132 180 210 183 156 135 144 96 87 66 54
4
2
45 48 51 54 57 60 63
4
2
33 24 18 12 6 6 0
Q. The ordinates of 3 hr UH is given below. Assume
Base flow is 15 cu.meter/sec.
Derive the 9 hr UH.
Soln:
 Step-1: See the given duration and req. duration.
Given Duration of UH = 3 hr
Req. duration = 9hr
i.e. 9 is the integral multiple of 3. Thus, superposition technique is
applicable.
 Step-2: if we add 3 hr UH by 3 times then we got 9 hr UH
i.e. 3hr + 3hr + 3hr = 9 hr
but, at the same when we adding the 3 UH of 1 cm each, resulted
hydrograph will be DRH of 1+1+1= 3 cm excess rainfall.
Thus, in 2nd step, lag ordinates of given UH by 3 hr and then again
lag by 3 hr (Col. 3 & 4)
 Step-3: Add these lagged UH i.e. Col.6, this will give us DRH of
3cm ER.
 Step-4: Divide col.6/3cm (bcoz we want to plot UH)
(1) (2) (3) (4) (2)+(3)+(4)=(6) (7)
Time (hr)
ordinates of 3 hr
UH (m3/s)
lagged by 3 hr lagged by 6 hr
DRH due to sum of 3 UH i.e 3 cm
ER
Ordinates of
9hr UH
0 0 - 0 0
3 12 0 - 12 4
6 75 12 0 87 29
9 132 75 12 219 73
12 180 132 75 387 129
15 210 180 132 522 174
18 183 210 180 573 191*
21 156 183 210 549 183
24 135 156 183 474 158
27 144 135 156 435 145
30 96 144 135 375 125
33 87 96 144 327 109
36 66 87 96 249 83
39 54 66 87 207 69
42 42 54 66 162 54
45 33 42 54 129 43
48 24 33 42 99 33
51 18 24 33 75 25
54 12 18 24 54 18
57 6 12 18 36 12
60 6 6 12 24 8
63 0 6 6 12 4
66 0 6 6 2
69 0 0 0
72 0 0
75 0 0
Thank You…………..

Unit hydrograph

  • 1.
    Unit Hydrograph Prepared by Prof.S. G. Taji Dept. of Civil Engineering S.R.E.S’s Sanjivani College of Engineering, Kopargaon
  • 2.
    HYDROGRAPH It is agraph showing the rate of flow (discharge) versus time past a specific point in a river, or other channel or conduit carrying flow. It can also called as a graph showing the volume of water reaching a particular outfall.
  • 3.
     Such hydrographsare commonly used in the design of sewerage, more specifically, the design of surface water sewerage systems and combined sewers.
  • 4.
    COMPONENTS OF AHYDROGRAPH  Rising limb:  The rising limb of hydro graph, also known as concentration curve, reflects a prolonged increase in discharge from a catchment area, typically in response to a rainfall event  Recession (or falling) limb:  The recession limb extends from the peak flow rate onward.  The end of stormflow (aka quickflow or direct runoff) and the return to groundwater-derived flow (base flow) is often taken as the point of inflection of the recession limb.  The recession limb represents the withdrawal of water from the storage built up in the basin during the earlier phases of the hydrograph.
  • 5.
    Peak discharge:  Thehighest point on the hydro graph when the rate of discharge is greatest Lag time:  The time interval from the center of mass of rainfall excess to the peak of the resulting hydrograph Time to peak:  The time interval from the start of the resulting hydro graph Discharge:  The rate of flow (volume per unit time) passing a specific location in a river or other channel
  • 7.
    Hydrograph usually consistsof a fairly regular lower portion that changes slowly throughout the year and a rapidly fluctuating component that represents the immediate response to rainfall. The lower, slowly changing portion is termed base flow. The rapidly fluctuating component is called direct runoff. Unit Hydrograph
  • 9.
    UNIT HYDROGRAPH  Theamount of run-off resulting from 1 unit (1cm, 1mm, 1ft, etc.) of rainfall excess.  is essentially a tool for determining the direct runoff response to rainfall.  Once you know the watershed’s response to one storm, you can predict what its response for another will look like.
  • 10.
    Basic Assumptions ofUH UH 1. The effective rainfall is uniformly distributed within its duration 2. The effective rainfall is uniformly distributed over the whole drainage basin 3. The base duration of direct runoff hydrograph due to an effective rainfall of unit duration is constant. 4. The ordinates of DRH are directly proportional to the total amount of DR of each hydrograph 5. For a given basin, the runoff hydrograph due to a given period of rainfall reflects all the combined physical characteristics of basin (time-invariant)
  • 11.
    Procedure for Derivationof UH from Hydrograph Type-I Derivation of Unit Hydrograph from Given DRH or Flood Hydrograph Time (hr) 0 6 12 18 24 30 36 42 48 54 60 66 Observed hydrograph(m3 /s) 100 100 300 700 1000 800 600 400 300 200 100 100 In a typical 6-hr storm, 4 cm excess rainfall is occurring. The flow recorded in the catchment as shown below. Derive an unit hydrograph for 6-hr storm. Assume Base flow is 100 cu.meter/sec.
  • 12.
    Soln:  Step-1: ComputeDRH (Col. 3) DRH=Ordinates of flood hydrograph – Base flow  Step-2: Compute 6hr-UH (Col. 4) Ordinates of UH = Ordinates of DRH / Excess Rainfall
  • 13.
    Time (hr) (1) Observed Hydrograph (m3/s) (2) DirectRunoff Hydrograph (DRH) (m3/s) (3) Ordinates of UH (4) 0 100 0 0 6 100 0 0 12 300 200 50 18 700 600 150 24 1000 900 225* 30 800 700 175 36 600 500 125 42 400 300 75 48 300 200 50 54 200 100 25 60 100 0 0 66 100 0 0
  • 14.
    Type-II Derivation of DRHor Flood Hydrograph from Given Unit Hydrograph Time (hr) 0 3 6 9 12 15 18 21 24 27 30 33 36 39 ordinates of 3 hr UH (m3/s) 0 12 75 132 180 210 183 156 135 144 96 87 66 54 42 45 48 51 54 57 60 63 42 33 24 18 12 6 6 0 Q. The ordinates of 3 hr UH is given below. Assume Base flow is 15 cu.meter/sec. Derive the DRH for 2 cm, 6 cm and 4 cm excess rainfall.
  • 15.
    (1)11 (2) (2)*2=(3)(2)*6=(4) (2)*4=(5) Time (hr) ordinates of 3 hr UH DRH due to 2 cm ER DRH due to 6 cm ER DRH due to 4 cm ER 0 0 0 0 0 3 12 24 72 48 6 75 150 450 300 9 132 264 792 528 12 180 360 1080 720 15 210 420 1260 840* 18 183 366 1098 732 21 156 312 936 624 24 135 270 810 540 27 144 288 864 576 30 96 192 576 384 33 87 174 522 348 36 66 132 396 264 39 54 108 324 216 42 42 84 252 168 45 33 66 198 132 48 24 48 144 96 51 18 36 108 72 54 12 24 72 48 57 6 12 36 24 60 6 12 36 24 63 0 0 0 0
  • 16.
    Type-III Derivation of T-hrUnit Hydrograph from Given D-hr unit Hydrograph  If UH of specified UH is available, then we can derive of any other duration UH by using superposition techniques.  But, the use of this technique is limited i.e. if required duration is integral multiple of given duration UH, then this technique is easy to use and compute req. UH.  For ex. Derivation of 16 hr UH from given 4hr UH, then superposition technique is applicable, But when it is necessary to derive 4hr UH from given 16hr UH, then S-curve technique should be used.
  • 17.
    Type-III (A): Derivationof req. T-hr UH from Given D-hr UH (where T is the multiple integral of D) Time (hr) 0 3 6 9 12 15 18 21 24 27 30 33 36 39 ordinates of 3 hr UH (m3/s) 0 12 75 132 180 210 183 156 135 144 96 87 66 54 4 2 45 48 51 54 57 60 63 4 2 33 24 18 12 6 6 0 Q. The ordinates of 3 hr UH is given below. Assume Base flow is 15 cu.meter/sec. Derive the 9 hr UH.
  • 18.
    Soln:  Step-1: Seethe given duration and req. duration. Given Duration of UH = 3 hr Req. duration = 9hr i.e. 9 is the integral multiple of 3. Thus, superposition technique is applicable.  Step-2: if we add 3 hr UH by 3 times then we got 9 hr UH i.e. 3hr + 3hr + 3hr = 9 hr but, at the same when we adding the 3 UH of 1 cm each, resulted hydrograph will be DRH of 1+1+1= 3 cm excess rainfall. Thus, in 2nd step, lag ordinates of given UH by 3 hr and then again lag by 3 hr (Col. 3 & 4)  Step-3: Add these lagged UH i.e. Col.6, this will give us DRH of 3cm ER.  Step-4: Divide col.6/3cm (bcoz we want to plot UH)
  • 19.
    (1) (2) (3)(4) (2)+(3)+(4)=(6) (7) Time (hr) ordinates of 3 hr UH (m3/s) lagged by 3 hr lagged by 6 hr DRH due to sum of 3 UH i.e 3 cm ER Ordinates of 9hr UH 0 0 - 0 0 3 12 0 - 12 4 6 75 12 0 87 29 9 132 75 12 219 73 12 180 132 75 387 129 15 210 180 132 522 174 18 183 210 180 573 191* 21 156 183 210 549 183 24 135 156 183 474 158 27 144 135 156 435 145 30 96 144 135 375 125 33 87 96 144 327 109 36 66 87 96 249 83 39 54 66 87 207 69 42 42 54 66 162 54 45 33 42 54 129 43 48 24 33 42 99 33 51 18 24 33 75 25 54 12 18 24 54 18 57 6 12 18 36 12 60 6 6 12 24 8 63 0 6 6 12 4 66 0 6 6 2 69 0 0 0 72 0 0 75 0 0
  • 20.