Importance of CFPs in Agricultural Watersheds
•Download as PPTX, PDF•
1 like•99 views


Recommended
Recommended
More Related Content
What's hot
What's hot (19)
Viewers also liked
Viewers also liked (16)
Similar to Importance of CFPs in Agricultural Watersheds
Similar to Importance of CFPs in Agricultural Watersheds (20)
Importance of CFPs in Agricultural Watersheds
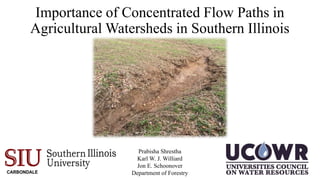
- 1. Importance of Concentrated Flow Paths in Agricultural Watersheds in Southern Illinois Prabisha Shrestha Karl W. J. Williard Jon E. Schoonover Department of Forestry
- 2. Outline • Introduction • Objectives • Methods • Results • Discussion • Limitations & Future Research
- 3. Introduction- Agriculture and Soil Erosion • Agriculture - leading source of surface water pollution • Agriculture - major source of sediments, nutrients, pesticides and pathogens • Sediment - largest contaminant of surface water by weight and volume • Soil erosion in agricultural fields is a growing concern - on-site and off-site environmental impacts (EPA 2009)
- 4. Introduction-Soil Erosion On-site Impacts -removal of top soil -reduction in water-holding capacity -reduction in soil fertility -decrease in agricultural yields Off-site Impacts -impairment of water quality -destruction of aquatic habitats -downstream flooding -sedimentation in watercourses and dams
- 5. Introduction-Concentrated Flow Paths (CFPs) • CFPs are narrow and shallow channels • commonly observed in agricultural fields • intermediate size between rills and permanent gullies • Direct conduit for sediment and nutrient delivery Figure 1: Conceptual model of concentrated flow path formation (Pankau 2010)
- 6. Introduction-Importance of CFPs • CFPs increase the connectivity in the landscape in terms of sediment and nutrient delivery from upland contributing areas to streams • CFPs are both sediment source and transport mechanism • Can be ten times more than non-rill and interill areas • Up to two orders of magnitude higher than transport rate by raindrop splash (Poesen et al. 2003)
- 7. Introduction – Importance of CFPs • BMPs are recommended to address agricultural NPS pollution • BMPs such as riparian buffers - increase surface roughness and infiltration capacity • CFP formation through riparian buffers has been shown to decrease the sediment trapping efficiency of BMPs Figure 2: Riparian buffer zones (Hill 2009)
- 8. Objectives • Investigate the prevalence of CFPs in agricultural watersheds at a regional scale • Assess the percentage of field area drained by the CFPs • Determine the effects of field characteristics on occurrence of CFPs
- 9. Methods – Study Area • Jackson County, IL • Total study area = 35,599 acres • 389 agricultural fields – percent drainage calculation • 379 agricultural fields- statistical analysis
- 10. Methods-Spatial Analysis Lidar Point Cloud data Watershed delineation Digital Elevation Models Percent drainage calculation
- 11. Elevation map with CFPs • Elevation map from Lidar point cloud data • The color gradient, yellow to blue, represents higher to lower elevation • The orange lines represent the concentrated flow paths determined using flow accumulation lines
- 12. Watershed Delineation 35% of field drained by CFP’s 94% of field drained by CFP’s
- 13. Methodology-Statistical Analysis • Multiple Regression with models selected from the Akaike’s Information Criterion (AIC) method • Values of independent variables were acquired from the SSURGO database • Weighted average of the independent variables was used for the analysis Variables Parameters Dependent CFP area CFP length CFP area to length ratio Drainage density Independent K factor Organic matter Percent clay Percent sand Saturated hydraulic conductivity Slope Slope length T factor
- 14. Results-CFP Characteristics Number of CFPs Total 1964 Average per field 5 Minimum 0 Maximum 17 CFP length (Feet) Average 1578.7 Minimum 22.3 Maximum 27890.9
- 15. Results-CFP Characteristics Soil Texture Number of fields Number of CFPs Clay loam 1 12 Fine sandy loam 8 41 Loam 4 15 Silt loam 172 908 Silty clay 166 848 Silty clay loam 26 133
- 16. 0 20 40 60 80 100 120 140 0-10 10-20 20-30 30-40 40-50 50-60 60-70 70-80 80-90 90-100 Numberoffields Percent drained Results –Percent of Field Drained by CFP’s Statistics % drainage Average 81.41 Minimum 35.58 Maximum 99.75
- 17. Results –Multiple Regression Variables P value Organic matter 0.0014 T factor 0.0501 Percent clay 0.0019 Model 1: Regression analysis of CFP area (p value <0.0001, Adj. R sq.=0.0104) Variables P value Slope 0.0137 Organic matter 0.0001 Percent sand 0.0393 Model 2: Regression analysis of CFP length (p value <0.0001, Adj. R sq.=0.0184)
- 18. Results –Multiple Regression Variables P value Saturated hydraulic conductivity 0.0011 Slope 0.0536 T factor 0.0077 Percent clay 0.0019 Model 3: Regression analysis of CFP area to length ratio (p value <0.0001, Adj. R sq.=0.0155) Variables P value Slope 0.0318 Slope length 0.0051 Organic matter <0.0001 Model 4: Regression analysis of Drainage density (p value <0.0001, Adj. R sq.=0.0172)
- 19. Results –Multiple Regression Dependent variable Adjusted R square CFP area 0.0104 CFP length 0.0184 Ratio between CFP area and length 0.0155 Drainage density 0.0172 Table: Adjusted R square values for all the regression model
- 20. Discussion • Percent area drained by CFPs vary from 36-99% • A small field scale study in the area showed percent drainage of 82.5-100% (Pankau 2010) • This finding has important implications for future riparian buffer design, as currently most buffers are static width and designed to handle sheet flow • Investigated field characteristics showed association with CFP properties, but did not explain much of the variation (1-1.8%) observed • Other factors such as precipitation and surface runoff might influence CFP formation • Field scale study along with the use of remotely sensed data could provide more information on the association between field properties and CFPs
- 21. Limitations • Remotely sensed data – measurement uncertainties • Field scale study - required for validation of the findings and up-to- date information Future Research Targeting conservation efforts • Research relating water quality impairment to CFP occurrence would be helpful in quantifying the impact of CFPs BMP design • Research utilizing both field scale measurements and remotely sensed data would be helpful in understanding the CFP forming hydrologic processes and changes in CFP morphology over time
- 22. Summary • Lidar-derived DEMs are useful in identifying CFP’s, which are the main conduit for nonpoint source pollution leaving agricultural fields • CFPs are prevalent in agricultural watersheds of southern Illinois • This result has important implications for riparian buffer design (variable width buffer) • Field characteristics did not explain much of the variation observed in CFP occurrence • Further research in understanding physical processes forming CFPs and resulting morphological changes can help in targeting conservation efforts such as BMPs and regulations to protect soil health and water quality
- 23. Acknowledgements Immeasurable appreciation and deepest gratitude for the help and support extended to the following persons who in one way or another have contributed in making this study possible. Dr. Logan Park, member of my research committee, for his precious time, valuable comments, suggestions and positive insights; Ryan Pankau, Soil Conservationist at ILNRCS and former graduate student, for his support and cooperation in accessing NRCS data and information and suggestions; Dr. John D. Reeve, the statistician, for the shared mathematical expertise that contributed in data analysis and interpretation; Fellow graduate students at the Department of Forestry, for their help throughout the academic exploration;
Editor's Notes
- Downstream flooding- due to reduced capacity of eroded soil to absorb water Water quality- sediment, nutrient, chemicals
- Soil removal - ~ 5 years ~ 10-12 inch
- No BMPs target CFPs
- Resolution and Year DEM= 3 m Spatial analyst ext hydrology tbx
- Data collection year – 2011 Organization – Illinois Height Modernization Program (ILHMP) managed by the ISGS Calculated Horizontal Accuracy of the point cloud data = 2 feet Calculated Fundamental Vertical Accuracy of the classified data = 0.22 feet
- Orthoimagery from Department of Transportation (2011) - Resolution of 0.3 meters
- % of occurrence
- Pankau (2010) – 82-100 % drainage ~80% of the fields – CFPs >70-80
- 600,000 lbs in 3 years – filter strip study in sugercane fields – Dr. Jeong Loess soils – not consolidated easily