
Recommended
More Related Content
Similar to Low Fertility in the Twenty-First Century 589Demography, V.docx
Similar to Low Fertility in the Twenty-First Century 589Demography, V.docx (19)
More from SHIVA101531
More from SHIVA101531 (20)
Recently uploaded
Recently uploaded (20)
Low Fertility in the Twenty-First Century 589Demography, V.docx
- 1. Low Fertility in the Twenty-First Century 589 Demography, Volume 40-Number 4, November 2003: 589–603 589 L IS LOW FERTILITY A TWENTY-FIRST-CENTURY DEMOGRAPHIC CRISIS?* S. PHILIP MORGAN Nearly half of the world’s population in 2000 lived in countries with fertility rates at or below replacement level, and nearly all countries will reach low fertility levels in the next two decades. Concerns about low fertility, fertility that is well below replacement, are widespread. But there are both persistent rationales for having children and institutional adjustments that can make the widespread intentions for two children attainable, even in increasingly individualistic and egalitar- ian societies. ike many demographers of my generation, I was attracted to demography by The Population Bomb (Ehrlich 1974), The Limits to Growth (Meadows et al. 1974) and The Tragedy of the Commons (Hardin 1968), the neo-Malthusian
- 2. classics. The crisis was high fertility and the resulting rapid population growth. The population crisis was dire, seemed intractable, and afflicted the poorest countries. But an ongoing global fertility transition has made population stabilization by the middle of the twenty-first century a reasonable forecast. Stylized versions of these fertility transitions posit shifts from high to low fertility, with fertility rates eventually oscillating around replacement level. However, observed declines show the total fertility rate (TFR) slicing below replacement levels with little resistance, and many are skeptical about its recuperation (e.g., Lesthaeghe and Willems 1999). Herein lies a potential demographic crisis: the dynamics of population decline mir- ror those of population increase. Halving times mirror doubling times, and population momentum can be negative as well as positive (Lutz, O’Neill, and Scherbov 2003). The social problems associated with low fertility are also mirror images of those associated with high fertility: women now have fewer children than they want (see, e.g., Hewlett’s (2002) high-profile book about the personal crises of unintended childlessness), and women have children at late ages, with some questioning whether they should have de- layed childbearing (e.g., Wolf 2001). At the aggregate level, dramatic population aging threatens the solvency of programs for the old, and country- level population decline could soon become a common reality (Demeny 2003).
- 3. But I’m getting ahead of my story. Below, I review the dramatic, ongoing global spread of low fertility. Then I turn to the heart of my argument, which acknowledges the inevitability of low fertility but not of very low fertility. Finally, I answer the question posed in my title: is low fertility a twenty-first-century crisis? EMERGING GLOBAL LOW FERTILITY Table 1 shows a year-2000 snapshot of the global fertility transition based on data from the United Nations (United Nations Population Division 2002). Each of the following observations are important and dramatic: *S. Philip Morgan, Department of Sociology, Duke University, Box 90088, Durham, NC 27708-0088; E- mail: [email protected] An earlier version of this paper was presented as the presidential address at the annual meeting of the Population Association of America, Minneapolis, May 2, 2003. For comments on previ- ous drafts, I thank Thomas DiPrete, Charles Hirschman, M. E. Hughes, David Brady, Samuel Preston, Ronald Rindfuss, Herbert Smith, and Etienne van de Walle. This research was supported by Grants R01 HD-041042 and R03 HD-41035 from the National Institutes of Health. 590 Demography, Volume 40-Number 4, November 2003 1. The United Nations (U.N.) lists only 16 (of a total of 187) countries as not showing clear evidence of a fertility transition (see column 1).
- 4. Lingering high fertility has become geographically isolated and affects fewer of the world’s coun- tries and people. Only 3% of the global population now lives in countries not yet in fertility transition. The U.N. projects that all these countries will soon begin a transition. 2. At the other extreme, there are 64 countries with fertility at replacement level or lower. Twenty-three countries recently made the transition to low fertility (see column 4), and another 41 countries have had several decades of low fertility punctuated by a baby boom and bust (see column 5). Together, approximately 45% of the world’s population now lives in countries with low fertility. 3. Between these extremes, 105 countries are said to be experiencing fertility transitions (see columns 2 and 3) because empirical evidence shows that once begun, these declines do not stop until fertility reaches replacement level or be- low (see Bongaarts and Watkins 1996). For 96% of these 105 countries in transi- tion, their most recent estimate is their lowest recorded fertility.1 4. Only two countries have halted their transition at a fertility level that is sub- stantially above replacement (at TFRs of 2.5 to 3.0). Others with currently high TFRs could do so, but evidence clearly suggests that arrested
- 5. declines will be rare. Thus, these data and U.N. projections portend a remarkable achievement. In a few decades, high fertility will likely be of historical interest (Bongaarts and Bulatao 2000; United Nations Population Division 2003a).2 Replacing a focus on high fertility, concerns about very low fertility have already arrived. Table 2 shows TFRs for six countries. The lowest observed TFRs, for countries like Spain and Italy, provide an empirical basis for concerns about population decline. Fertility in a number of countries is well below replacement. As an example of the conse- quences of such low fertility, the U.N. projection of the Italian population to 2050 (with Table 1. Stages of the Transition to Low Fertility in 187 Countries Early Early Declining Declining Declined Transition Transition No With With to and Baby Boom and Transition TFR > 5 5 < TFR < 2.1 TFR � 2.1 TFR < 2.1 2.1 < TFR < 3 Total (1) (2) (3) (4) (5) (6) (7) Number of Countries 16 32 73 23 41 2 187 Percentage of Global Population Living
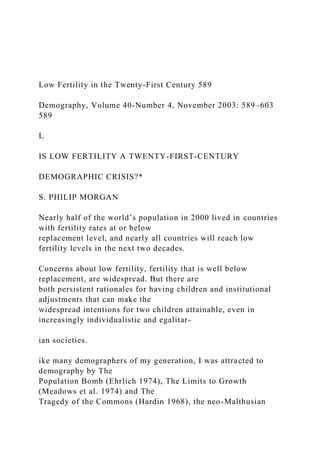
- 6. in Countries at Selected Stages of Transition 3.0 9.5 42.6 24.6 19.6 0.7 100.0 Source: United Nations Population Division (2002: table 1.1). 1. Calculations are from United Nations Population Division (2000: tables I.3–I.6). 2. The United Nations Population Division (2003a) forecasts the TFRs of the 49 poorest countries to be low but above replacement level. For these countries, the forecasts are for TFR levels between 2 and 3 in 2050, with the medium variant of approximately 2.5. Thus, fertility is not forecast to be at replacement level or below for all countries. Low Fertility in the Twenty-First Century 591 only a modest increase in its current fertility of 1.2 to 1.35, the U.N. low-variant esti- mate) produces a 30% decline in total population. Figure 1 shows the projected 2050 age distribution. The old-age dependency burden implied here is dramatic. Such pervasive low fertility and rapidly aging populations could be cited in constructing low fertility as a major twenty-first-century crisis. But there are exceptions to very low fertility; the United Table 2. Variation in Low Total Fertility Rates (TFR) Country TFR
- 7. Spain 1.16 Italy 1.20 Greece 1.30 Germany 1.33 France 1.89 United States 2.03 U.S.: White non-Hispanic 1.84 Sources: United Nations Population Division (2002). U.S. data for 2001 are from Ventura, Hamilton, and Sutton (2003). 0 1,000 2,000 3,000 4,000 0 10 20 30 40 50 60 70
- 8. 80 90 100+ A ge ( B o th S ex es ) Population (in 1,000s) TFR 1.2 1.35 (U.N. low-variant estimate) Figure 1. Projected Population by Age: Italy 2050 Source: United Nations Population Division (2003b). 592 Demography, Volume 40-Number 4, November 2003 States is the most obvious exception. Also note that the higher
- 9. fertility of the United States cannot be attributed solely to its minority populations. Non-Hispanic whites have a TFR of 1.84, a high fertility level by European standards. IS VERY LOW FERTILITY INEVITABLE? Some evidence and arguments suggest that very low fertility is inevitable. For example, in his presidential address, Bumpass (1990) argued that secular trends producing family change, and an imbedded fertility transition, had not run their course. Commenting on classic arguments about family change (e.g., Goode 1963), Bumpass argued that “...the theoretical perspectives of a half-century ago were essentially correct” (p. 483). These theories linked modernization and family change and had essentially two components: a structural component and an ideological one. The structural component acknowledged the changed circumstances of industrial (and postindustrial) economies, which increased the cost of children. Of special importance was the incompatibility of work and familial obligations for women. Citing not only this earlier work but also the contemporary work of Lesthaeghe and colleagues (Lesthaeghe 1983; Lesthaeghe and Surkyn 1988), Bumpass argued that this structural change was accompanied by ideologies that stressed that individuals should assess these costs and act in their self- interest. Bumpass con- cluded that “there is no reason to think that these processes are exhausted or are likely to reverse” (p. 493).
- 10. Another view is that a future with very low fertility is much less certain. I assign this view the title from Campbell’s (1974) presidential address, “beyond the demographic tran- sition.” Campbell focused on a demographic surprise: the baby boom. This baby boom and subsequent bust called for explanation distinct from the secular decline in high-parity births. An adequate explanation, focusing on the United States, follows from Ryder’s (1980) decomposition of trends in the baby boom and bust. Ryder’s analysis isolated the dynamic components of change as the timing and number of low-parity births. I argue that by moving beyond the demographic transition and focusing on low-parity births, one can anticipate a floor on low fertility and better understand low- fertility trends and differ- ences. From this view, very low fertility is not inevitable. Of course, this is very different from saying it will never be observed. To argue against the inevitability of very low fertility, I will first emphasize the dis- tinction between low- and high-parity births and stress that motivations remain for low- parity births. Second, I will suggest that institutional adjustments are possible that would make having small families compatible with contemporary developed-country settings. Low- Versus High-Parity Births The distinction between first and second births and higher-order births is crucial. In eco-
- 11. nomically advanced contexts, 75%–90% of births are first or second births. Trends in this direction are long term—secular fertility declines have resulted from a move to small families, not to “no families.” Without such a distinction between low- and high-parity births, one might reasonably assume that the average family size could decline to zero. Children are costly in modern contexts: the fewer children one has, the better, and having no children is the best. However, there have not been large increases in the proportion of women who intend to have no children. In fact, the proportion of women who intend to have two children is dominant in most developed countries (Bongaarts 2002). One explanation for this pervasive intention to have two children comes from stud- ies of the value of children, which have shown that the rationales for having first and second children differ from those for higher-order births. Using data from the mid-1970s for the United States, the Philippines, and South Korea, Bulatao (1981) showed that across contexts, first children were desired for affective reasons, such as to have a child to love and care for, to carry on the family name, and to bring spouses closer together. Low Fertility in the Twenty-First Century 593 Second children were rationalized as “family building”; to provide a sibling for the first
- 12. child was especially important. Also, second and third births were frequently desired for balancing the sex composition of the family.3 Higher-order births served primarily eco- nomic functions. Bulatao suggested that higher-parity births declined because the ration- ales for them were undermined by socioeconomic change, whereas factors motivating first and second births were not. Furthermore, an important ideological shift has encouraged parents to focus attention on just a few children. At the heart of this change is the notion that each child is unique and deserves substantial parental investment, including purchased resources and parental time and attention. Being a good parent is now largely inconsistent with having more than a small number of children. Blake (1972) argued that in the 1960s, there were not strong norms against having large families. This has changed: large families are now viewed as inconsistent with good parenting. Because of this ideological change, low fertility coex- ists with strong and pervasive desires to be a parent. Clearly, there have been other relevant ideological changes. A major argument for the continued decline of fertility below replacement levels points to powerful trends toward individualism and self-actualization. But are these trends inevitably antinatalist? Giddens (1991) theorized wide-ranging effects of the rejection of the traditional structured life course. People now have great flexibility in how they structure their lives, making it diffi-
- 13. cult to find standards against which to judge their own progress or success. Achieving identity through a coherent “narrative of the self” is always a work in progress. Raising a child can bring predictable routines to daily life that promote well-being and provide continuity to one’s “narrative” (see Friedman, Hechter, and Kanazawa 1994; King 2000; Morgan and King 2001). In short, beyond adolescence and young adulthood, parenthood may provide a powerful source of connectedness and meaning. Thus, parenthood can be constructed as a response to increased individualism and self-actualization. Furthermore, greater individualism may undermine traditional constraints on fertility. For instance, continued secularization and individualism could undermine norms against nonmarital childbearing and against parenthood by gay couples. Currently, all western countries that approximate replacement- level fertility have signifi- cant levels of nonmarital childbearing (Rindfuss, Guzzo, and Morgan forthcoming). My final point may be more controversial. I believe that biological predispositions reinforce the desire for parenthood, especially the affective reasons for having children (that parents fall in love with their children), and the willingness of parents to have fewer children to increase their children’s life chances (see Lam 2003). It is true that biological predispositions don’t “cause anything.” As Pinker (1997, 2002) noted, genes associated with risk taking don’t make people take risks, but they do
- 14. increase the pleasure sensation resulting from things like jumping out of a plane or driving fast. Likewise, neural cir- cuitry producing a warm glow when parents hold their helpless, big-eyed infant didn’t make them have that baby, but it does help them to fall in love with the baby. In fact, love may be the root of altruism toward one’s children. Hrdy (1999) asserted that maternal attachment is conditional, as evidenced most strongly in the coevolution of babies to ex- tract maternal commitment. In short, having few children and heavily investing in them “fits” well with our evolutionary inheritance and, thus, with the neural wiring in our and our children’s brains. In sum, even “large families” in the twenty-first century will be small. Nevertheless, motivations and rationales for first, second, and (sometimes) third children remain rel- evant in modern contexts. Ideological change, psychological needs, and biological pre- dispositions buttress these motivations and rationales. 3. Moves toward gender equality may be undermining the importance of balancing the sex composition of the family (Pollard and Morgan 2002). 594 Demography, Volume 40-Number 4, November 2003 Institutional Adjustments The second stage of my argument against the inevitability of
- 15. very low fertility is that institutional adjustments can make small families feasible in the twenty-first century. Social contexts can support or thwart desires for children. My argument is not new. At the heart of demography is the decomposition of change into that owing to distributional shifts and to changing rates. A common way to think about future trends is in terms of secular change in the distributions (e.g., age or educational distributions) while other distribution-specific rates stay the same. This is a useful counterfactual, but one fre- quently counter to fact. For example, Preston (1984) noted the increasing proportion of elderly and a decreasing proportion of children over the 1960– 1980 period. Such changes (given a Malthusian, fixed-resource constraint) should have advantaged the young and disadvantaged the old. Instead, predictable changes across time in the sizes of America’s dependent groups (children and the elderly) were trumped in importance by institutional responses. Key in Preston’s account were public policy decisions to provide collectively for the medical care and income maintenance of older persons while main- taining a benign neglect of children. Let’s take this as a template for thinking about the importance of institutions and institutional responses. At the heart of most explanations of recent changes in family and fertility are the changing roles of women and their movement into the labor force. A straightforward application of distributional shifts and constant
- 16. rates projects lower fertil- ity with greater female labor-force participation. Rindfuss, Guzzo, and I (forthcoming) showed such an association in cross-sectional data for 22 countries in the Organization for Economic Cooperation and Development (OECD) with multiple decades of low-fertility experience (see Figure 2; the data in the figure are for 1960, but the data for 1950 and 1970 produce the same result). This negative cross-sectional association makes perfect sense when fertility is relatively high. High fer- tility is incompatible with women’s nonfamilial work in most observed or likely contexts. R = –0.605 1.0 1.5 2.0 2.5 3.0 3.5 4.0 0.2 0.6 1.0 Female Labor-Force Participation Rate
- 17. T o ta l F er ti li ty R at e 0.80.4 Figure 2. Total Fertility Rate, by Female Labor-Force Participation Rate, 1960: 22 OECD Countries Source: Rindfuss et al. (forthcoming). Low Fertility in the Twenty-First Century 595 In contrast, many of us who have studied fertility over multiple decades find the scatterplot for 1990, shown in Figure 3, remarkable. By 1990, fertility was much lower than in 1960. But the anomalous finding is the reversal of the country-level association
- 18. between female labor-force participation and fertility: the negative association is now strongly positive. Figure 4 plots the simple correlation coefficient, calculated year-by-year, between the TFR and female labor-force participation. This graphic reveals that the previous scatterplots shown in Figures 2 and 3 characterize a dramatic change from a strong nega- tive association to strong positive one. An adequate explanation for this change requires a move away from cross-sectional analysis. Let us compare two countries that typify this change: the United States, which had the highest 1997 TFR among the 22 OECD countries we examined (Rindfuss et al. forthcoming), and Italy, which had the lowest. As Table 3 shows, both countries have over two decades of replacement-level or lower fertility experience, and both countries experienced increases in female labor-force participation that averaged 0.4% and 0.5% per year in Italy and the United States, respectively. Over this period, the U.S. TFR was insensitive to increasing female labor-force participation. In contrast, a 1% increase in female labor-force participation in Italy was associated with greater than a 3.2% decline in fertility. How could such a pervasive and fundamental social change (increasing fe- male labor-force participation) accompany such divergent fertility trends? The answer lies in varying institutional responses. Rindfuss
- 19. (1991) stressed the im- portance of affordable, quality child care in weakening the incompatibility of work and childbearing and child rearing. Bianchi (2000) stressed gender and technological changes that affected the division of household labor (also see Bianchi et al. 2000; Gershuny 2000). In the United States, these changes allowed women’s time with children to remain virtu- ally unchanged over the 1965–1990 period. Esping-Anderson (1999) argued that welfare- state regimes offer different institutional environments for parenting. McDonald (2000) conceptualized very low fertility as an incompatible change in familial and nonfamilial R = 0.459 1.0 1.5 2.0 2.5 0.2 0.4 0.6 0.8 1.0 Female Labor-Force Participation Rate T o ta l F
- 20. er ti li ty R at e Figure 3. Total Fertility Rate, by Female Labor-Force Participation Rate, 1990: 22 OECD Countries Source: Rindfuss et al. (forthcoming). 596 Demography, Volume 40-Number 4, November 2003 institutions. I find the intuitive appeal of these institutional arguments to be powerful and their overlap to be considerable. Quantitative tests of institutional arguments provide some evidence of pronatalist impacts, but tests to date are limited by a focus on a few specific features, especially family-related public policy. A broader consideration of the cumulative childbearing envi- ronment would provide compelling explanations of cross- national differences. Quantita- tive studies of multiple countries face great challenges in measuring and incorporating this
- 21. context. Pampel’s (2001) interesting and important country- level analysis of welfare-state and institutional arguments suggests that governmental support can attenuate the effects of increasing female labor-force participation on fertility, but his regressions leave the United States as a large outlier. With little public support of families, why is U.S. fertility among the highest in the developed world? The U.S. story clearly does not lie in the relative generosity of welfare systems that were explicitly included in Pampel’s analysis; instead, it must lie in the responsiveness of nongovernmental institutions (perhaps consumer mar- kets or changes in the family, especially gender roles). For example, my colleagues and I (DiPrete et al. forthcoming) compared the costs of a first child in West Germany and the United States. Costs were narrowly defined as the Table 3. Sensitivity/Elasticity of Female Labor-Force Participation (FLFP) and the Total Fertility Rate (TFR): Italy and the United States Years Since Average FLFP Sensitivity or 1997 Sensitivity Country First TFR < 2.0 Increase aElasticitya TFR Rank Italy 21 0.4 –3.2– 1.19 01 United States 25 0.5 0.3 2.06 22 aSensitivity or elasticity = ln(TFRt / TFR1) / ln(FLFPt / FLFP1), where subscript 1 = the first year in series TFR < 2.0 and year t = 1997 or the last year with observed data.
- 22. –0.8 –0.6 –0.4 –0.2 0.0 0.2 0.4 0.6 0.8 1.0 1960 1965 1970 1975 1980 1990 1995 Year C o rr el at io n C o
- 23. ef fi ci en t 1985 Figure 4. Year-by-Year Correlation Between the Total Fertility Rate and the Female Labor-Force Participation Rate, 1960–1995: 22 OECD Countries Source: Rindfuss et al. (forthcoming). Low Fertility in the Twenty-First Century 597 change in family income that accompanies a birth. Longitudinal data showed that West German women exit the labor force for much longer periods than do American women, with a correspondingly greater decline in earnings for West German women. German gov- ernment transfers compensate for a substantial part of this difference, but the net costs on this dimension remain greater for West German women. Indeed, the greater cost and longer exits from the labor force are associated with lower rates of first birth in West Germany than in the United States. Apparently, institutional responses other than government trans- fers, perhaps greater gender equality and labor-market responses, such as flex time, more
- 24. than compensate for the paltry U.S. government transfers (in women’s and couples’ deci- sions to have a first child). In sum, the context matters, and contexts vary. Covariation of institutional contexts with fertility levels shows that very low fertility is not inevitable. However, this state- ment leaves us a long way from a precise answer to the question, what mix of institutions produce an environment conducive to replacement-level fertility? Answering this question is the agenda of the next decade for studies of low fertility. The richness of analyses will be aided by the study of more societies (and more non- Western societies) as low fertility spreads. One way that demography has traditionally contributed to answering such questions is by identifying more precisely what proximate variables produce fertility change and variability. An Integrative Framework I recommend Bongaarts’ (2001a, 2002) conceptual framework, which views the TFR as resulting from the population’s intended family size multiplied by a set of factors that are not subsumed or cannot be subsumed in the respondent’s fertility intentions. These factors reflect unanticipated effects. In Table 4, I offer hypothetical values for these proximate determinants that are more fully justified elsewhere (Morgan and Hagewen forthcoming). The values present a stylized view of Italy and the United
- 25. States. Consistent with substan- tial evidence suggesting small differences in intended family sizes across developed coun- tries (Bongaarts 2001b, 2002),4 let us assume an intended family size of 2.0 and 2.2 for Italy and the United States, respectively. In this framework, a parameter of 1.0 reflects no effect net of intentions, values above 1.0 increase fertility relative to intentions, and values lower than 1.0 decrease fertility relative to intentions. For example, the net effect of unwanted fertility (Fu) pushes the TFR higher than would be predicted by intentions alone: by about 12% in the United States and by 1/3 this amount in Italy. Not having a child of the sex one prefers (Fg) or having a child that dies (Fr) also cannot be anticipated and may increase fertility in a similar way, but these effects are small and do not vary in this illustration. The last three factors—the tempo effect, infecundity, and competition—are poten- tially powerful in explaining very low fertility. Bongaarts and Feeney (1998) showed that adjustments for fertility delay (Ft), the postponement of births to later ages (and, necessarily, subsequent years), can explain a substantial part of the very low fertility observed in contemporary settings. The estimates for fertility delay capture the range of values observed circa 1995. Specifically, shifts in the timing of childbearing reduce fer- tility by about 15% (a factor of .85) in Italy and by 8% (a factor of .92) in the United
- 26. States. As Bongaarts (2002; Bongaarts and Feeney 1998) has pointed out, these reduc- tions are, by definition, temporary (on a decadal time scale). Infecundity is the flip side of unwanted fertility. Intended family sizes are inevitably reduced by infecundity, and this impact (Fi) is directly related to the age pattern of 4. Of course, more sophisticated questions and analyses may reveal differences between countries. This perspective should refocus demographers’ attention on fertility intentions and levels of certainty respondents attach to their intentions. 598 Demography, Volume 40-Number 4, November 2003 childbearing. The pattern of later childbearing in Italy reduces fertility by 10%, while the pattern in the United States reduces fertility by half this amount. Finally, competition (Fc) refers to decisions to revise childbearing intentions, that is, to have fewer (or more) children than anticipated, on the basis of one’s life experiences. One might view this as the extent of antinatalist opportunities or the lack of institutional adjustment reducing say, work-family incompatibility. But also included in this variable are reductions in intended family size later in the life course because one does not marry and does not want to have a nonmarital birth or to raise a child without a committed
- 27. partner. As an illustration of these combined forces, Ginsborg (2003:73–74) suggested the following explanation for low Italian fertility: (Italy) offered its own peculiar mixture of transformation and continuity . . . . (T)here were strong forces pushing towards a European model of modernity . . . leading to greater individual choice, the spread of contraception and legalized abortion, the partial emanci- pation of women and their entry into the labor market. (In addition), tradition weighed heavily in both the public and private spheres: the felt obligation to have children within marriage, the power of the family as an intergenerational collective, the state’s disinterest . . . in reproductive politics. Consistent with evidence I presented earlier, especially with the data presented in Table 3, the competition parameter (Fc) is set to reflect sharp differences in institutional con- straints between Italy and the United States. I find this proximate-determinants model useful. Note how a modest set of hypo- thetical differences cumulate to produce substantial differences in fertility. Low fertility has multiple causes, and convincing explanations may read like country-specific social histories. Quesnel-Vallée and I (forthcoming) applied this model to U.S. longitudinal data from the National Longitudinal Survey of Youth for the period 1982– 2000. Because we focused
- 28. on a cohort of women, we were able to eliminate the tempo effect (Ft), an important factor in Bongaarts’s period formulation. We showed that only about 38% of women realized their stated intended parity at age 22 by age 40. The individual- level error between intent Table 4. Bongaarts’s Conceptual Model of the Factors Affecting the Period Total Fertility Rate (TFR)a: Illustrative Values for Italy and the United States Country________________________________________ Posttransition Posttransition Component Description Italy United States IFS intended family size 2 2.2 Fu unwanted fertility 1.04 1.12 Fg gender preferences 1.02 1.02 Fr replacement effect 1.005 1.005 Ft tempo effect 0.85 0.92 Fi infecundity 0.9 0.95 Fc competition 0.75 0.9 TFR 1.22 1.99 aTFR = IFS × Fu × Fg × Fr × Ft × Fi × Fc .
- 29. Low Fertility in the Twenty-First Century 599 and behavior averaged 1.0 birth per woman; the net error was – 0.33 birth. Thus, consistent with much prior research (e.g., Westoff and Ryder 1977), the predictive validity of inten- tions is far from perfect, and errors do not necessarily “balance”; in this case, women more frequently missed low than high. Our prediction is that such an analysis for Italy would show a similar level of error but, following from Bongaarts’s framework, with a much larger negative net error. Italians are almost always missing on the low side, that is, they almost always have fewer children than intended. We (Quesnel-Vallée and Morgan forthcoming) also found that errors between intended and realized family sizes are ordered, as one would expect given the arguments I presented so far. Related to the competition parameter, those who do not marry, or marry late, are likely to have fewer births than intended. This occurs in a context in which roughly one- third of births are nonmarital; marriage would likely play a greater role in Italy, where nonmarital births are rare. Highly educated women, but not highly educated men, are more likely than their less-educated counterparts to have fewer children than intended. We inter- preted this finding as an effect of competition between employment and familial options that are felt more intensely by women than by men. Finally, women and men who have children later—say, after age 25—are much more likely to have fewer children than in-
- 30. tended (compared with those having children earlier). This finding could be explained in terms of infecundity at later ages, although other interpretations are plausible. By way of summary and as a proposed working model, variation in low fertility is not produced by a disinterest in having children. Most women want children, and their mean intentions approximate what is needed for replacement-level fertility. But as women age, they are faced with a set of competing demands that are most easily accommodated by a delay in fertility. Postponement is a major reason for contemporary low fertility. Demog- raphers know that shifts in the timing of childbearing affect period fertility rates, but few appreciate that postponement effects can act for three or more decades at substantial lev- els. The good news is that the underlying quantum of period fertility is substantially greater than the currently very low TFRs. But this “mechanical” effect of temporal shifts is not the full story. Although post- ponement is frequently the least costly solution to competing fertility and nonfamilial opportunities, postponement brings risks that women will not have all the children they intend. One reason is the higher levels of infecundity at older ages. In addition, at older ages, competing demands may interact with being “too old,” in a social sense, for children (Rindfuss and Bumpass 1978). Thus, women revise their intentions downward at older ages, and continuing delay and competing opportunities
- 31. translate some delayed fertility into forgone fertility. Although this general process is occurring everywhere in the developed world, it plays out differently in particular societies. Public policy and institutional responses can assist women in realizing their intended fertility by easing the difficulty of combining child rearing, working, and participating in other activities, and by making parenthood practical at younger ages (Lutz et al. 2003). Some countries have contexts that are more conducive to childbearing than do others. Current cross-national fertility differences are largely the unanticipated consequences of current public policy and institutional arrange- ments. But these differences indicate that lowest-low fertility is not our inevitable desti- nation and demise. IS LOW FERTILITY A “CRISIS”? One need not be a pessimist to concede that a future without problems is unlikely. Cherlin (1999), however, warned against “going to extremes” and defining all problems as either a crisis or as trivial. Some problems and challenges are real but are of a second order. Perspective can be gained by identifying some as the kind of problems one would like to have. What characteristics define problems one would like to have? First, these problems
- 32. 600 Demography, Volume 40-Number 4, November 2003 result from solving some bigger, more troublesome challenge. Second, these problems have solutions and befall those with the resources to solve them. In my view, low fertility is not a twenty-first-century crisis— not yet, anyway. It is a genuine problem, but the kind of problem we want to have. That is, it is the result of solving a bigger, more threatening social problem: the crisis of continued population growth. Low fertility is also a problem that can be addressed through public policy and institutional adjustments. Finally, low fertility is a problem that befalls developed coun- tries that, by and large, have the resources to respond. At the global level, population growth will slow over the next few decades because of increasingly pervasive low fertility. For those of us attracted to demography by neo- Malthusian concerns and who still believe that there are limits to human population growth, how can this be seen as anything but good news? It is clearly good news compared with the forecasts that primed the interests of many contemporary demographers. Continued atten- tion to this decline and efforts to assure it are crucial. Besides, it was naive to think that fertility would magically stabilize exactly at replacement levels. Thinking globally, I pre- fer the current low-fertility problem to fertility at 2.5 or 3 births per woman, at least for the first half of the twenty-first century.
- 33. Low fertility produces rapidly aging populations and possible country-level popula- tion decline. It will reduce the proportion of the global population living in Europe and North America (see Demeny 2003). For whom is this a problem? It clearly depends on one’s perspective. An African American colleague recently questioned my research agenda: “so you’re studying the disappearance of white folks.” I was taken aback; this is not how I prefer to characterize my work. But he had made his point: for many, “fewer white people” does not sound like the greatest crisis of the twenty-first century. Buchanan (2002), in Death of the West, was mightily concerned. He embraced the concept of differential growth rates with adolescent hormonal passion and subtlety. The book’s subtitle is its thesis: How Dying Populations and Immigrant Invasions Imperil Our Country and Civilization. Buchanan’s argument, like Wattenberg’s (1989) earlier version, The Birth Dearth, is only the latest in a vintage that links population decline, family decline, and the decline of a “valued moral or national order” (Teitelbaum and Winter 1985:132). Less polemical low-fertility concerns focus on a shortage of warriors, workers, and consumers. But given current technology and the global economy, these concerns seem to be second-order twenty-first-century problems. Fans of U.S. military might are breathless over its speed and technology, not its size. Furthermore, in a global economy, workers
- 34. and consumers don’t need to be homegrown or national coresidents.5 Of course, the severity of the problem of low fertility and population decline varies on a country-by-country basis. Effective responses bring to mind the concept of a multiphasic response (Davis 1963). Moderate levels of immigration could easily offset modest below-replacement levels of fertility (say, cohort fertility of 1.7 or 1.8 births per woman). Source populations are numerous and willing (given receptive environments). In addition, short-term concerns about labor-force availability could easily be satisfied by postponing retirement. Retirement ages in some countries are low when compared with healthy life expectancy. Finally, for societies that cannot even approximate replacement fertility on a decadal time scale, a full-blown crisis exists. For such countries, there is likely much more wrong than low fertility. Societies that can respond to the legitimate needs of their citizens and invest in the next generations will, I believe, approximate replacement-level fertility. These are places where the low-fertility public policy battles should be fought. A coalition of those concerned about low fertility, the welfare of children, the stress of the second shift, 5. For that matter, soldiers need not be citizens. Noncitizen residents are numerous and are targeted re- cruits for the U.S. all-volunteer military.
- 35. Low Fertility in the Twenty-First Century 601 and gender equality could press for institutional adjustments that improve the quality of life for mothers, fathers, children, and families. Demographic research can provide evi- dence regarding which changes would make a difference. If enacted, such changes might just allow women to have the children they want while providing the children that low- fertility societies need. REFERENCES Bianchi, S.M. 2000. “Maternal Employment and Time With Children: Dramatic Change or Sur- prising Continuity?” Demography 37:401–14. Bianchi, S.M., M.A. Milkie, L.C. Sayer, and J.P. Robinson. 2000. “Is Anyone Doing the House- work? Trends in the Gender Division of Household Labor.” Social Forces 79(1):191–228. Blake, J. 1972. “Coercive Pronatalism and American Population Policy.” Pp. 81–109 in Commis- sion on Population and the American Future, Vol. 6: Research Reports, edited by R. Parke and C.F. Westoff. Washington, DC: U.S. Government Printing Office. Bongaarts, J. 2001a. The End of the Fertility Transition in the Developed World. Population Re- search Division Working Paper No. 152. New York: Population Council.
- 36. ———. 2001b. “Fertility and Reproductive Preferences in Post- Transitional Societies.” Pp. 260–81 in Global Fertility Transition, edited by R.A. Bulatao and J.B. Casterline. New York: Population Council. ———. 2002. “The End of Fertility Transition in the Developed World.” Population and Develop- ment Review 28:419–44. Bongaarts, J. and R.A. Bulatao, eds. 2000. Beyond Six Billion: Forecasting the World’s Popula- tion. Washington, DC: National Academy Press. Bongaarts, J. and G. Feeney. 1998. “On the Quantum and Tempo of Fertility.” Population and Development Review 24:271–91. Bongaarts, J. and S.C. Watkins. 1996. “Social Interactions and Contemporary Fertility Transitions.” Population and Development Review 22:639–82. Buchanan, P.J. 2002. The Death of the West: How Dying Populations and Immigrant Invasions Imperil Our Country and Civilization. New York: Thomas Dunne Books. Bulatao, R.A. 1981. “Values and Disvalues of Children in Successive Childbearing Decisions.” Demography 18:1–25. Bumpass, L. 1990. “What’s Happening to the Family? Interactions Between Demographic and In- stitutional Change.” Demography 27:483–98.
- 37. Campbell, A.A. 1974. “Beyond the Demographic Transition.” Demography 11:549–61. Cherlin, A.J. 1999. “Going to Extremes: Family Structure, Children’s Well-being, and Social Sci- ence.” Demography 36:421–28. Davis, K. 1963. “The Theory of Change and Response in Modern Demographic History.” Popula- tion Index 29:345–66. Demeny, P. 2003. “Population Policy Dilemmas in Europe at the Dawn of the Twenty-First Cen- tury.” Population and Development Review 29:1–28. DiPrete, T.A., S.P. Morgan, H. Engelhardt, and H. Paclova. Forthcoming. “Do Cross-National Dif- ferences in the Costs of Children Generate Cross-National Differences in Fertility Rates?” Population Research and Policy Review. Ehrlich, P.R. 1974. The Population Bomb. New York: Ballantine Books. Esping-Andersen, G. 1999. Social Foundations of Post- Industrial Economies. New York: Oxford University Press. Friedman, D., M. Hechter, and S. Kanazawa. 1994. “A Theory of the Value of Children.” Demog- raphy 31:375–401. Gershuny, J. 2000. Changing Times: Work and Leisure in Postindustrial Society. Oxford, England: Oxford University Press. Giddens, A. 1991. Modernity and Self-Identity: Self and Society
- 38. in the Late Modern Age. Stanford, CA: Stanford University Press. 602 Demography, Volume 40-Number 4, November 2003 Ginsborg, P. 2003. Italy and Its Discontents: Family, Civil Society, State, 1980–2001. New York: Palgrave Macmillan. Goode, W.J. 1963. World Revolution and Family Patterns. New York: Free Press of Glencoe. Hardin, G. 1968. “The Tragedy of the Commons.” Science 162:1243–48. Hewlett, S.A. 2002. Creating a Life: Professional Women and the Quest for Children. New York: Talk Miramax Books. Hrdy, S.B. 1999. Mother Nature: A History of Mothers, Infants, and Natural Selection. New York: Pantheon Books. King, R.B. 2000. “Women’s Fertility in Late Modernity.” Unpublished doctoral dissertation, Soci- ology Department, University of Pennsylvania. Lam, D. 2003. “Evolutionary Biology and Rational Choice in Models of Fertility.” Offspring: Hu- man Fertility Behavior in Biodemographic Perspective, edited by K.W. Wachter and R.A. Bulatao. Washington, DC: National Academies Press. Lesthaeghe, R. 1983. “A Century of Demographic and Cultural
- 39. Change in Western Europe: An Exploration of Underlying Dimensions.” Population and Development Review 9:411–35. Lesthaeghe, R. and J. Surkyn. 1988. “Cultural Dynamics and Economic Theories of Fertility Change.” Population and Development Review 14:1–45. Lesthaeghe, R. and P. Willems. 1999. “Is Low Fertility a Temporary Phenomenon in the European Union?” Population and Development Review 25:211–28. Lutz, W., B.C. O’Neill, and S. Scherbov. 2003. “Europe’s Population at a Turning Point.” Science 299(5615):1991–92. McDonald, P.F. 2000. Gender Equity, Social Institutions and the Future of Fertility.” Journal of Population Research 17:1–16. Meadows, D.H., D.L. Meadows, R. Jorgens, and W.W. Behrens. 1974. The Limits to Growth: A Report for the Club of Rome’s Project on the Predicament of Mankind. New York: Universe Books. Morgan, S.P. and K. Hagewen. Forthcoming. “Is Very Low Fertility Inevitable in America? In- sights and Forecasts From An Integrative Model of Fertility.” In Creating the Next Generation, edited by A. Booth and A.C. Crouter. Mahwah, NJ: Lawrence Erlbaum. Morgan, S.P. and R.B. King. 2001. “Why Have Children in the 21st Century? Biological Predispo- sition, Social Coercion, Rational Choice.” European Journal of
- 40. Population 17:3–20. Pampel, F.C. 2001. The Institutional Context of Population Change: Patterns of Fertility and Mor- tality Across High-Income Nations. Chicago: University of Chicago Press. Pinker, S. 1997. “Against Nature.” Discover 18:92–95. ———. 2002. The Blank Slate: The Modern Denial of Human Nature. New York: Viking. Pollard, M.S. and S.P. Morgan. 2002. “Emerging Gender Indifference: Sex Composition of Chil- dren and the Third Birth.” American Sociological Review 67:600–13. Preston, S.H. 1984. “Children and the Elderly: Divergent Paths for America’s Dependents.” De- mography 21:435–57. Quesnel-Vallée, A. and S.P. Morgan. Forthcoming. “Missing the Target? Correspondence of Fertil- ity Intentions and Behavior in the U.S.” Population Research and Policy Review. Rindfuss, R.R. 1991. “The Young Adult Years: Diversity, Structural Change, and Fertility.” Demography 28:493–512. Rindfuss, R.R. and L.L. Bumpass. 1978. “Age and the Sociology of Fertility: How Old Is Too Old.” Pp. 43–56 in Social Demography, edited by K.E. Taeuber, L.L. Bumpass, and J.A. Sweet. New York: Academic Press. Rindfuss, R.R., K.B. Guzzo, and S.P. Morgan. Forthcoming.
- 41. “The Changing Institutional Context of Low Fertility.” Population Research and Policy Review. Ryder, N.B. 1980. “Components of Temporal Variations in American Fertility.” Pp. 15–49 in De- mographic Patterns in Developed Societies, edited by R.W. Hiorns. London: Taylor and Francis. Teitelbaum, M.S. and J.M. Winter. 1985. The Fear of Population Decline. Orlando: Academic Press. Low Fertility in the Twenty-First Century 603 United Nations Population Division. 2000. World Population Prospects: The 2000 Revision, Vol- ume III: Analytical Report. New York: United Nations. ———. 2002. World Population Prospects: The 2000 Revision. New York: United Nations. Avail- able on-line at http://www.un.org/esa/population/publications/wpp2000/chapter 1.pdf ———. 2003a. World Population Prospects: The 2002 Revision. New York: United Nations. Avail- able on-line at http://www.un.org/esa/population/publications/wpp2002/WPP20 02- HIGHLIGHTSrev1.PDF ———. 2003b. World Population Prospects: The 2002 Revision Population Database. Available on-line at http://esa.un.org/unpp/
- 42. Ventura, S.J., B.E. Hamilton, and P.D. Sutton. 2003. “Revised Birth and Fertility Rates for the United States, 2000 and 2001.” National Vital Statistics Reports 51(4). Hyattsville, MD: Na- tional Center for Health Statistics. Wattenberg, B.J. 1989. The Birth Dearth. New York: Pharos Books. Westoff, C.F. and N.B. Ryder. 1977. “The Predictive Validity of Reproductive Intentions.” Demog- raphy 14:431–53. Wolf, N. 2001 Misconceptions: Truth, Lies, and the Unexpected on the Journey to Motherhood. New York: Doubleday. << /ASCII85EncodePages false /AllowTransparency false /AutoPositionEPSFiles true /AutoRotatePages /None /Binding /Left /CalGrayProfile (Gray Gamma 2.2) /CalRGBProfile (sRGB IEC61966-2.1) /CalCMYKProfile (ISO Coated v2 300% 050ECI051) /sRGBProfile (sRGB IEC61966-2.1) /CannotEmbedFontPolicy /Error /CompatibilityLevel 1.3 /CompressObjects /Off /CompressPages true /ConvertImagesToIndexed true /PassThroughJPEGImages true /CreateJobTicket false /DefaultRenderingIntent /Perceptual
- 43. /DetectBlends true /DetectCurves 0.1000 /ColorConversionStrategy /sRGB /DoThumbnails true /EmbedAllFonts true /EmbedOpenType false /ParseICCProfilesInComments true /EmbedJobOptions true /DSCReportingLevel 0 /EmitDSCWarnings false /EndPage -1 /ImageMemory 1048576 /LockDistillerParams true /MaxSubsetPct 100 /Optimize true /OPM 1 /ParseDSCComments true /ParseDSCCommentsForDocInfo true /PreserveCopyPage true /PreserveDICMYKValues true /PreserveEPSInfo true /PreserveFlatness true /PreserveHalftoneInfo false /PreserveOPIComments false /PreserveOverprintSettings true /StartPage 1 /SubsetFonts false /TransferFunctionInfo /Apply /UCRandBGInfo /Preserve /UsePrologue false /ColorSettingsFile () /AlwaysEmbed [ true ] /NeverEmbed [ true ] /AntiAliasColorImages false
- 44. /CropColorImages true /ColorImageMinResolution 149 /ColorImageMinResolutionPolicy /Warning /DownsampleColorImages true /ColorImageDownsampleType /Bicubic /ColorImageResolution 150 /ColorImageDepth -1 /ColorImageMinDownsampleDepth 1 /ColorImageDownsampleThreshold 1.50000 /EncodeColorImages true /ColorImageFilter /DCTEncode /AutoFilterColorImages true /ColorImageAutoFilterStrategy /JPEG /ColorACSImageDict << /QFactor 0.40 /HSamples [1 1 1 1] /VSamples [1 1 1 1] >> /ColorImageDict << /QFactor 0.15 /HSamples [1 1 1 1] /VSamples [1 1 1 1] >> /JPEG2000ColorACSImageDict << /TileWidth 256 /TileHeight 256 /Quality 30 >> /JPEG2000ColorImageDict << /TileWidth 256 /TileHeight 256 /Quality 30 >> /AntiAliasGrayImages false /CropGrayImages true /GrayImageMinResolution 149 /GrayImageMinResolutionPolicy /Warning /DownsampleGrayImages true
- 45. /GrayImageDownsampleType /Bicubic /GrayImageResolution 150 /GrayImageDepth -1 /GrayImageMinDownsampleDepth 2 /GrayImageDownsampleThreshold 1.50000 /EncodeGrayImages true /GrayImageFilter /DCTEncode /AutoFilterGrayImages true /GrayImageAutoFilterStrategy /JPEG /GrayACSImageDict << /QFactor 0.40 /HSamples [1 1 1 1] /VSamples [1 1 1 1] >> /GrayImageDict << /QFactor 0.15 /HSamples [1 1 1 1] /VSamples [1 1 1 1] >> /JPEG2000GrayACSImageDict << /TileWidth 256 /TileHeight 256 /Quality 30 >> /JPEG2000GrayImageDict << /TileWidth 256 /TileHeight 256 /Quality 30 >> /AntiAliasMonoImages false /CropMonoImages true /MonoImageMinResolution 599 /MonoImageMinResolutionPolicy /Warning /DownsampleMonoImages true /MonoImageDownsampleType /Bicubic /MonoImageResolution 600 /MonoImageDepth -1 /MonoImageDownsampleThreshold 1.50000
- 46. /EncodeMonoImages true /MonoImageFilter /CCITTFaxEncode /MonoImageDict << /K -1 >> /AllowPSXObjects false /CheckCompliance [ /None ] /PDFX1aCheck false /PDFX3Check false /PDFXCompliantPDFOnly false /PDFXNoTrimBoxError true /PDFXTrimBoxToMediaBoxOffset [ 0.00000 0.00000 0.00000 0.00000 ] /PDFXSetBleedBoxToMediaBox true /PDFXBleedBoxToTrimBoxOffset [ 0.00000 0.00000 0.00000 0.00000 ] /PDFXOutputIntentProfile (None) /PDFXOutputConditionIdentifier () /PDFXOutputCondition () /PDFXRegistryName () /PDFXTrapped /False /CreateJDFFile false /Description << /ARA <FEFF06270633062A062E062F06450020064706300647002006
- 52. 2005D105D005DE05E605E205D505EA0020004100630072006F 006200610074002005D5002D00410064006F0062006500200052 0065006100640065007200200035002E0030002005D505D205E 805E105D005D505EA002005DE05EA05E705D305DE05D505E A002005D905D505EA05E8002E> /HRV (Za stvaranje Adobe PDF dokumenata najpogodnijih za visokokvalitetni ispis prije tiskanja koristite ove postavke. Stvoreni PDF dokumenti mogu se otvoriti Acrobat i Adobe Reader 5.0 i kasnijim verzijama.) /HUN <FEFF004b0069007600e1006c00f30020006d0069006e01510073 00e9006701710020006e0079006f006d006400610069002000650 06c0151006b00e90073007a00ed007401510020006e0079006f00 6d00740061007400e100730068006f007a0020006c00650067006 9006e006b00e1006200620020006d0065006700660065006c0065 006c0151002000410064006f00620065002000500044004600200 064006f006b0075006d0065006e00740075006d006f006b006100 7400200065007a0065006b006b0065006c0020006100200062006 500e1006c006c00ed007400e10073006f006b006b0061006c0020 006b00e90073007a00ed0074006800650074002e0020002000410 020006c00e90074007200650068006f007a006f00740074002000 500044004600200064006f006b0075006d0065006e00740075006 d006f006b00200061007a0020004100630072006f006200610074 002000e9007300200061007a002000410064006f0062006500200 0520065006100640065007200200035002e0030002c0020007600 610067007900200061007a002000610074007400f3006c0020006 b00e9007301510062006200690020007600650072007a006900f3 006b006b0061006c0020006e00790069007400680061007400f30 06b0020006d00650067002e> /ITA <FEFF005500740069006c0069007a007a0061007200650020007 10075006500730074006500200069006d0070006f007300740061 007a0069006f006e0069002000700065007200200063007200650 0610072006500200064006f00630075006d0065006e0074006900 2000410064006f00620065002000500044004600200070006900f 900200061006400610074007400690020006100200075006e0061
- 55. geopend met Acrobat en Adobe Reader 5.0 en hoger.) /NOR <FEFF004200720075006b0020006400690073007300650020006 9006e006e007300740069006c006c0069006e00670065006e0065 002000740069006c002000e50020006f007000700072006500740 0740065002000410064006f006200650020005000440046002d00 64006f006b0075006d0065006e00740065007200200073006f006 d00200065007200200062006500730074002000650067006e0065 007400200066006f00720020006600f80072007400720079006b0 06b0073007500740073006b007200690066007400200061007600 20006800f800790020006b00760061006c0069007400650074002 e0020005000440046002d0064006f006b0075006d0065006e0074 0065006e00650020006b0061006e002000e50070006e006500730 02000690020004100630072006f00620061007400200065006c00 6c00650072002000410064006f006200650020005200650061006 40065007200200035002e003000200065006c006c006500720020 00730065006e006500720065002e> /POL <FEFF0055007300740061007700690065006e006900610020006 4006f002000740077006f0072007a0065006e0069006100200064 006f006b0075006d0065006e007400f3007700200050004400460 02000700072007a0065007a006e00610063007a006f006e007900 63006800200064006f002000770079006400720075006b00f3007 7002000770020007700790073006f006b00690065006a0020006a 0061006b006f015b00630069002e002000200044006f006b00750 06d0065006e0074007900200050004400460020006d006f017c00 6e00610020006f007400770069006500720061010700200077002 000700072006f006700720061006d006900650020004100630072 006f00620061007400200069002000410064006f0062006500200 0520065006100640065007200200035002e003000200069002000 6e006f00770073007a0079006d002e> /PTB <FEFF005500740069006c0069007a00650020006500730073006 1007300200063006f006e00660069006700750072006100e700f5 0065007300200064006500200066006f0072006d0061002000610 0200063007200690061007200200064006f00630075006d006500
- 60. 3e0020043f0435044004350434043404400443043a043e0432043 e0433043e0020043404400443043a0443002e0020002004210442 0432043e04400435043d045600200434043e043a0443043c04350 43d0442043800200050004400460020043c043e0436043d043000 20043204560434043a04400438044204380020044300200041006 30072006f006200610074002004420430002000410064006f0062 0065002000520065006100640065007200200035002e003000200 4300431043e0020043f04560437043d04560448043e0457002004 3204350440044104560457002e> /ENU (Use these settings to create Adobe PDF documents best suited for high-quality prepress printing. Created PDF documents can be opened with Acrobat and Adobe Reader 5.0 and later.) /DEU <FEFF004a006f0062006f007000740069006f006e007300200066 006f00720020004100630072006f0062006100740020004400690 07300740069006c006c0065007200200038002000280038002e00 32002e00310029000d00500072006f00640075006300650073002 0005000440046002000660069006c006500730020007700680069 00630068002000610072006500200075007300650064002000660 06f00720020006f006e006c0069006e0065002e000d00280063002 90020003200300031003000200053007000720069006e00670065 0072002d005600650072006c0061006700200047006d006200480 020000d000d0054006800650020006c0061007400650073007400 2000760065007200730069006f006e002000630061006e0020006 2006500200064006f0077006e006c006f00610064006500640020 00610074002000680074007400700073003a002f002f0070006f00 7200740061006c002d0064006f007200640072006500630068007 4002e0073007000720069006e006700650072002d00730062006d 002e0063006f006d002f00500072006f0064007500630074006900 6f006e002f0046006c006f0077002f00740065006300680064006f 0063002f00640065006600610075006c0074002e0061007300700 078000d0054006800650072006500200079006f00750020006300 61006e00200061006c0073006f002000660069006e00640020006 10020007300750069007400610062006c006500200045006e0066 006f0063007500730020005000440046002000500072006f00660
- 61. 069006c006500200066006f007200200050006900740053007400 6f0070002000500072006f00660065007300730069006f006e0061 006c00200030003800200061006e0064002000500069007400530 074006f0070002000530065007200760065007200200030003800 200066006f007200200070007200650066006c006900670068007 40069006e006700200079006f0075007200200050004400460020 00660069006c006500730020006200650066006f0072006500200 06a006f00620020007300750062006d0069007300730069006f00 6e002e000d> >> /Namespace [ (Adobe) (Common) (1.0) ] /OtherNamespaces [ << /AsReaderSpreads false /CropImagesToFrames true /ErrorControl /WarnAndContinue /FlattenerIgnoreSpreadOverrides false /IncludeGuidesGrids false /IncludeNonPrinting false /IncludeSlug false /Namespace [ (Adobe) (InDesign) (4.0) ] /OmitPlacedBitmaps false /OmitPlacedEPS false /OmitPlacedPDF false /SimulateOverprint /Legacy >> << /AddBleedMarks false
- 62. /AddColorBars false /AddCropMarks false /AddPageInfo false /AddRegMarks false /ConvertColors /ConvertToCMYK /DestinationProfileName () /DestinationProfileSelector /DocumentCMYK /Downsample16BitImages true /FlattenerPreset << /PresetSelector /MediumResolution >> /FormElements false /GenerateStructure false /IncludeBookmarks false /IncludeHyperlinks false /IncludeInteractive false /IncludeLayers false /IncludeProfiles false /MultimediaHandling /UseObjectSettings /Namespace [ (Adobe) (CreativeSuite) (2.0) ] /PDFXOutputIntentProfileSelector /DocumentCMYK /PreserveEditing true /UntaggedCMYKHandling /LeaveUntagged /UntaggedRGBHandling /UseDocumentProfile /UseDocumentBleed false >> ] >> setdistillerparams << /HWResolution [2400 2400] /PageSize [595.276 841.890] >> setpagedevice
- 63. [INSERT TITLE HERE] 3 Running head: [INSERT TITLE HERE] [INSERT TITLE HERE] Student Name Allied American University Author Note This paper was prepared for [INSERT COURSE NAME], [INSERT COURSE ASSIGNMENT] taught by [INSERT INSTRUCTOR’S NAME]. Directions: Please complete the following tasks. Be sure to read the directions carefully. When you have completed all parts of the Homework Assignment, create a zipped folder containing all files, then upload this .zip file to iBoard. PART I: Project
- 64. Mega Bytes, your computer hardware and software company, has approached the local public school system about providing computer instruction at the junior and senior high school level. The local public schools are using computer equipment that is approximately 10 years old. You can assume that all the training will take place in a single room in one building and that the room is available and furnished with suitable computer furniture. You will be making a presentation before the school Board of Directors and you will cover the following points: Why it is important to use current hardware and software The cost involved in purchasing equipment for a 20-student capacity computer lab A proposed software training program, which includes your hourly rate and the estimated number of hours required per semester to train a single class The benefits to the students, faculty, and community-at-large Open a new Word document and save it as School Outline.docx. Create an outline that contains headings and subheadings for at least 10 slides. Hint: Remember to work in Outline view to enter text for the headings and subheadings. Save the document. Open a new Excel® workbook and save it as School Figures.xlsx. Name Sheet 1 Hardware, create a worksheet that contains information about the hardware you believe should be purchased, and the price of each item. For example, you could create a worksheet that appears like the one shown below: Quantity Machine Unit Cost Total 20
- 65. Laptops $1,200.00 $24,000.00 3 Color Printers $400.00 $1,200.00 2 Network Hubs $2,000.00 $4,000.00 Total $29,200.00 Name Sheet 2 Software, and create a worksheet that contains information about the software you believe should be purchased and the price of each item. For example, you could list the Microsoft® Office 2010 suite. Name Sheet 3 Training and create a worksheet that contains your hourly rate and an estimate of the cost of training a single full-semester class. Save the workbook. Open a new PowerPoint® presentation and save it as School Presentation.pptx. Apply the presentation design of your choice then create a title slide. Import the document School Outline.docx into the presentation. Copy the appropriate cells from each worksheet in School Figures.xlsx into its own slide. Do not create links between Excel® and PowerPoint®. Size and position the copied cells attractively on each slide. On each slide containing copied cells, double-click the cells then fill the first row with the shading color of your choice. Optional: Add artwork, transitions, and builds into the slides that you consider appropriate.
- 66. Save the file as part of the zipped folder to be uploaded to iBoard. P O P U L A T I O N A N D D E V E L O P M E N T R E V I E W 4 0 ( 3 ) : 5 2 7 – 5 4 4 ( S E P T E M B E R 2 0 1 4 ) 5 2 7 ©2014 The Population Council, Inc. N O T E S A N D C O M M E N TA R Y A Population Policy Rationale for the Twenty-First Century Wolfgang lutz In the twenty-first century most countries will have ended the phase of rapid population growth and will see their populations stabilize and often decline. What, then, should be the role of population policy? Should the goal be long-term constancy of population size, probably calling for pronatalist or pro-immigration policies? Or should policies seek to influence the size of the labor force or the composition of the population with respect to age or other demographic dimensions such as place of residence, level of education, or health status? And if we can settle on a goal, do we have the means to attain
- 67. it? These are the questions I take up in this article. My premise is that governments in the future will see significant enough externalities from changing population size and structure to warrant policy engagement. Currently, many governments, particularly in Eastern Europe and Eastern Asia, are faced with rapidly aging and, soon to come, shrinking populations. Yet population researchers have little advice to offer on what can or should be done under such conditions beyond some fairly inconclusive discussion of pronatalist policies. My hope is to stimulate more systematic thinking about the goals and modalities of aggregate-level population poli- cies in this century. I should note two matters bearing on the content of my discussion. First, I am concerned with populations and population issues as ordinarily construed in demography. These are distinct from individual human rights issues such as those related to reproductive rights and health. Whether or not any policy that may affect aggregate population trends is consistent with individual human rights is a crucial question, but it is not a “population” is- sue to be studied in demographic terms. Second, population composition as considered here is not just characterized by age and sex, or by geographic
- 68. location. Other dimensions can be added based on their contribution to 5 2 8 A P o P u l A t i o n P o l i c y r A t i o n A l e f o r t h e t w e n t y - f i r s t c e n t u r y heterogeneity in aggregate-level population dynamics and their substantive relevance for the study of social and economic development. One such di- mension, educational attainment, turns out to be the single most important source of observable population heterogeneity after age and sex (Lutz and KC 2011). Hence in discussions of population structure below I will consistently refer to age, sex, and highest level of educational attainment. This can also be seen as introducing the “quality” dimension into population modeling. Put in a nutshell, I propose that the primary goal of twenty- first-century population policies should be to strengthen the human resource base for national and global sustainable development. Population policies under this rationale could be viewed as public human resource management—by anal- ogy with human resource management in the private sector. They would not identify any particular population size, growth rate, fertility rate, or age struc- ture as a goal in its own right. This approach is thus in line with
- 69. the often- praised decision made at the 1994 International Conference on Population and Development (ICPD) to dispense with demographic targets. Population policies, I argue, should instead try to efficiently and flexibly manage human resources with respect to achieving the highest long-term wellbeing of current and future generations while fully respecting human rights. Before setting out and developing this approach, I will discuss what I see as the shortcomings of the three rationales that currently figure most prominently as a basis for population policy: acceptance of replacement-level fertility as a demographic goal; realizing a “demographic dividend” from the changing age structure; and filling the “unmet need” for family planning. Replacement-level fertility: Not a meaningful policy goal The notion that replacement-level fertility would be an optimal demographic condition seems to be ubiquitous. When asked what would be a desirable fertility level, most politicians, journalists, and even demographers would answer slightly above two children per woman; many would mention the precise level of the total fertility rate (TFR): 2.1. This number represents replacement-level fertility under low mortality. Yet the notion
- 70. of replace- ment level only makes sense in the highly stylized theoretical model of a stationary population. It has little to do with actually maintaining the size of a population in contemporary societies, which have irregular age structures and experience migration and mortality changes. Given these realities, the fertility levels that would result in constant population size will have to vary over time and can be significantly different from 2.1. Two recent research projects have independently concluded that for most countries there are economic reasons why long-term fertility at levels somewhat below replacement would be preferable to replacement level. The first, a study by Lee and Mason (2012) drawing on the approach of their w o l f g A n g l u t z 5 2 9 multi-country National Transfer Accounts (NTA) project, shows that the capi- tal/output ratio increases under population decline, hence that a moderate shrinking of the population yields higher average consumption. While from a pure fiscal/public finance point of view their analysis shows that fertility should be significantly above replacement, combining this view with the goal
- 71. of maximizing consumption yields a much lower desirable long- term TFR: 1.24 for low-income countries, 1.50 for the middle-income group, and 1.79 for the high-income group. A different line of research, taking account of the heterogeneity of the population with respect to education and the fact that educated persons require costly investment early in life but are more productive later, arrives at very similar conclusions. Striessnig and Lutz (2013, 2014) explore the implications of alternative long-term fertility levels on education-weighted support ratios. In these support ratios, the working-age population in the denominator is weighted by a set of assumed education-specific productivity weights, and in the numerator children are weighted by education costs and the elderly by pension costs. Extensive simulations performed for the European Union show the level of fertility that would minimize the education- weighted dependency ratio. Under this model the long-term “optimal” fertility level, defined as the level that minimizes the dependency burden, is well below replacement level. This is the case for a population assumed to be closed to migration and with life expectancy gradually increasing; if migration gains were included in the model, the optimal fertility level would fall even further below replacement. At least
- 72. in the terms of this model, current fertility levels in Europe (after adjusting for downward tempo distortions) do not appear to be far from the optimum levels, provided that the productivity gains from education continue. Demographic dividend—trumped by education The effect of changes in age structure on economic growth has been widely studied in demography and population economics. The beneficial effect of changes in age structure after a decrease in fertility has become known as the demographic dividend. Yet the possibility that the beneficial effect in question might owe more to a changing educational structure than to a changing age structure has only recently been considered. Improving educational attain- ment of the adult population can affect economic growth through various channels. Higher skill levels of the labor force can directly translate into higher productivity and into better and faster uptake of new technologies (Mankiw, Romer, and Weil 1992). Education is also a catalyst for innovation and tech- nology adoption (Benhabib and Spiegel 1994, 2005). Economic growth is affected not only by the rate of accumulation of human capital, but also by its stock. Yet in the demographic dividend literature, the treatment of educa- tion is marginal. The pioneering article by Bloom and Williamson (1998) is
- 73. representative: it found education to be a significant factor in income growth, 5 3 0 A P o P u l A t i o n P o l i c y r A t i o n A l e f o r t h e t w e n t y - f i r s t c e n t u r y notably in East Asia, but did not discuss in depth its role as a contribution to the East Asian “economic miracle.” While many of the key studies include education in their model specifications—typically by treating it as an enabling factor—the demographic dividend, as the term is commonly used, refers only to changes in age-dependency ratios. Over the course of demographic tran- sition, these changes supposedly result in a demographic window that first opens under low-dependency conditions and then closes in a predictable way as the old-age dependency ratio starts to increase. A systematic consideration of the effects of a changing education struc- ture in addition to a changing age structure is taken up in a recent article by Crespo Cuaresma, Lutz, and Sanderson (2013). The article assesses the em- pirical evidence with respect to the relative effects of changes in age structure as compared to those in education structure. Using new data that provide a consistent reconstruction of educational attainment distributions by age and
- 74. sex, the authors reassess the empirical evidence on the associations among economic growth, changes in age structure, labor force participation, and edu- cational attainment. Using a panel of 105 countries for the period 1980–2005, they find that once the effect of human capital dynamics is controlled for, there is no evidence that changes in age structure affect labor productivity. In other words, educational attainment expansions are able to account for the sizable productivity effects that other writers had assumed to be caused by age-structure changes. Since increases in female education, declines in fertil- ity, and economic growth tend to happen around the same time, the effects are difficult to disentangle. The authors show that, in a proper multivariate statistical analysis, controlling for the expansion of education largely elimi- nates the age-structure effect. The age-structure dividend found in the new analysis is reduced to a modest accounting effect, whose size is significantly smaller than that of the productivity changes resulting from the investment in education. If, instead of GDP per capita, economic growth is measured in terms of total GDP, as is often done in international comparisons, then even the accounting effect disappears. The conclusion is that improvements in education, rather than fertility declines, are the main driver of subsequent
- 75. economic growth. These results call into question the notion of a demographic window opening and closing. If human capital is the key driver of productivity and there is continued improvement in skills, healthy life expectancy continues to increase, and there is some flexibility in the ages at retirement, then there is no need to fear a closing window. Modest effect of family planning programs on unmet need and fertility “Meeting the unmet need” for reproductive health and family planning has over the past 20 years become one of the most prominent goals of the w o l f g A n g l u t z 5 3 1 international population community. It has been seen as helping to consoli- date the ICPD concern with human rights by respecting individually desired family-size decisions, while still tacitly pursuing the pre-Cairo aggregate-level aim of reducing fertility levels in high-fertility countries. Today the phrase is widely used for advocacy in reproductive health and family planning pro- grams. Sometimes quantitative information on the prevalence of unmet need
- 76. in developing countries is presented together with hypothetical calculations showing how much lower fertility levels in those countries would be if the unmet need were met (Bradley et al. 2012). This approach is based on the strong assumption that programs that improve the supply of contraceptives and lower their cost would lead to a near elimination of unmet need. Women with an unmet need for contraception, by the official WHO definition, are sexually active, want to stop or delay childbearing, but are not currently using contraception. Estimates of the proportions in this category are typically derived from Demographic and Health Survey (DHS) data. Es- timates may be affected by inclusion of women at low risk of pregnancy for reasons such as spousal separation—more than 20 percent of married women in African DHS surveys were reportedly not using contraception because of lack of exposure—but in most countries removing that component has only a minor effect on proportions with unmet need. Recent DHS surveys have included specific questions asking women classified as having an unmet need what were the obstacles or reasons for not using contraception. Table 1 shows unweighted averages of proportions citing particular reasons among female respondents in recent African surveys, tabulated by level of
- 77. educational at- tainment. In addition to lack of exposure, the most important reasons cited by women at all levels of education are health concerns about the possible nega- tive effects or side effects of using contraception. It is unclear to what degree these answers reflect actual negative experience or are based on unfounded rumors. Next in line among obstacles to contraceptive use is opposition to family planning. This includes both opposition by the woman herself and opposition by her husband or extended family—factors not immune to pro- gram influence but likely to be resistant. Surprisingly, the obstacles that are most directly addressed by the provision of reproductive health services, the access to and cost of contraceptive supplies and services, seem to be of only minor importance. According to the DHS data, of all African women who are classified as having an unmet need for contraception less than 3 percent cite lack of access and less than 6 percent cite cost as important reasons for not using contraception. Among the more educated the proportions are still lower. Yet in the international discussion these supply reasons are often taken as the main sources of unmet need (Bradley et al. 2012). One can reasonably be skeptical of the size of direct effects on fertility of programs
- 78. that primarily aim at improving access to contraception and reducing its cost, at least in the African context. 5 3 2 A P o P u l A t i o n P o l i c y r A t i o n A l e f o r t h e t w e n t y - f i r s t c e n t u r y Stronger evidence on program effects should come from experimental designs, either with formal controls or through natural experiments. Unfortu- nately, few such studies have been undertaken. The classic Matlab experiment in Bangladesh in the 1970s is the best known—yielding a 1.5- birth impact on total fertility during the first two decades of the experiment (Bongaarts et al. 2012). Other quasi-experiments have led to reported TFR declines in the range 0.5–1.0, results that are attributed both to direct program effects and to the indirect effect on desired fertility. In countries with high fertility, that is a distinct if modest positive outcome. On the other hand, there is no doubt about the association of girls’ education with greater contraceptive use and lower fertility. There is mas- sive empirical evidence supporting this link, ranging from the early compre- hensive assessment by Cochrane (1979) to the most recent global survey by
- 79. Lutz, Butz, and KC (2014). This evidence is also succinctly summarized by Bongaarts (2010), who shows for 30 DHS countries not only that desired family size is significantly lower for more-educated women but also that “as education rises, fertility is lower at a given level of contraceptive use, con- traceptive use is higher at a given level of demand, and demand is higher at a given level of desired family size” (p. 31). Figure 1 illustrates the relation- ship between female education and contraceptive use for DHS countries in West Africa. Of course, within educational categories there is still substantial fertility variation: in the Figure 1 countries for women with secondary or higher education, for example, the most recent DHS estimates of fertility range from 2.9 for Senegal to 4.9 for Niger. On the other hand, there are also community-level effects of the average level of education on fertility. It can be inferred that fertility depends not only on individual-level education but also on many contextual factors. TABLE 1 Obstacles to using contraception cited by women classified as having an unmet need for limiting fertility by level of education, recent DHS surveys in Africa, unweighted averages (percent) No Secondary Cited reason education Primary and above