
Recommended
Recommended
More Related Content
What's hot
What's hot (17)
Similar to Benzocaine Synthesis Lab Report
Similar to Benzocaine Synthesis Lab Report (20)
More from RamanKhadka2
Recently uploaded
Recently uploaded (20)
Benzocaine Synthesis Lab Report
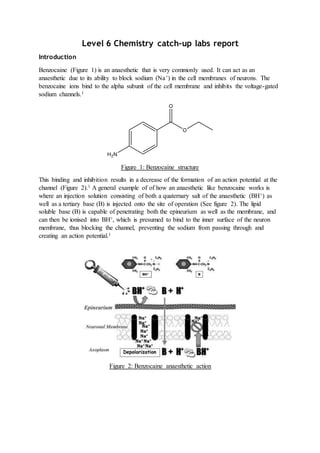
- 1. Level 6 Chemistry catch-up labs report Introduction Benzocaine (Figure 1) is an anaesthetic that is very commonly used. It can act as an anaesthetic due to its ability to block sodium (Na+) in the cell membranes of neurons. The benzocaine ions bind to the alpha subunit of the cell membrane and inhibits the voltage-gated sodium channels.1 Figure 1: Benzocaine structure This binding and inhibition results in a decrease of the formation of an action potential at the channel (Figure 2).1 A general example of of how an anaesthetic like benzocaine works is where an injection solution consisting of both a quaternary salt of the anaesthetic (BH+) as well as a tertiary base (B) is injected onto the site of operation (See figure 2). The lipid soluble base (B) is capable of penetrating both the epineurium as well as the membrane, and can then be ionised into BH+, which is presumed to bind to the inner surface of the neuron membrane, thus blocking the channel, preventing the sodium from passing through and creating an action potential.1 Figure 2: Benzocaine anaesthetic action
- 2. This inhibition prevents most/any transmissions being sent along the neurons, thus providing the benzocaine it’s anaesthetic properties. Due to benzocaine’s high efficacy, it’s a widely used anaesthetic and there’s a demand in the production for the drug (Scheme 1). Scheme 1: Synthetic route of benzocaine Scheme 1 showcases the synthetic route taken to produce benzocaine during the catch-up lab sessions. The identification and purity of the product was then tested using a wide range of analytical techniques. Molecule identity The main techniques used to identify the molecule would be 1H NMR (Figure 3) and DEPTQ (Figure 5), mainly due to the identity of the final product having been known, so the analytical techniques were more for a confirmation of identity rather than a complete identification. However, IR spectroscopy was also conducted for further confirmation and as a purity test.
- 3. Figure 3: 1H NMR spectrum of benzocaine product An easily identifiable peaks is at 7.77ppm is a doublet peak (only one hydrogen on neighbouring environment) for the hydrogen environment at 3 (Figure 4) neighbouring the carbonyl group as this will experience the greatest amount of de-shielding. Figure 4: Hydrogen environments on benzocaine Another easily identifiable peak is the triplet peak at 1.29ppm, for environment 1. Only environment 1 can have a triplet peak, as well as the fact that it is the most shielded environment. The quartet peaks at 4.25ppm will be environment 2 since its neighbours to a CH3 group. The doublet peak at 6.57ppm will represent environment 4, since it has environment 3 as its neighbour, giving it the doublet peak. Also, it experiences de-shielding from the π-bonds benzene ring giving it it’s higher chemical shift value. The final identified peak is at 3.99ppm for the amine group at 5, which doesn’t experience as much de-shielding from the π-bonds. With regards to DEPT-135, the peaks underneath signify the CH2 environments, while the peaks above represent CH and CH3 environments.
- 4. Figure 5: DEPT-135 spectrum of benzocaine product The main peaks in the DEPT-135 are the peaks at 131.6ppm (environment 3), 113.8ppm (environment 4), 60.3ppm (environment 2) and 14.4ppm (environment 1). The position of those peaks is once again related to de-shielding from the neighbouring carbonyl for environment 3 in comparison to the weaker de-shielding effect from the π-bonds in the benzene ring for environment 4. The negative peak will naturally represent the CH2 group as tat’s the only possibility, leaving environment 1 to be the peak at 14.4ppm. The IR spectrum (Figure 6) allows identification and confirmation of the key markers for benzocaine. The peak at 3339.92cm-1 correspond to the primary amine group and the strong peaks at 1633.07cm-1 will signify the carbonyl group in the ester. The ester is further confirmed by a strong peak at around 1273.51cm-1 for the C-O bond. This data along with NMR and DEPT confirm the identity of the final product to be benzocaine.
- 5. Figure 6: IR spectrum of synthesised benzocaine Molecule purity The purity of the product isn’t the highest quality possible. This is shown in Figure 5, where there are several other negative peaks which aren’t possible if it was benzocaine alone. HPLC and its calibration curve graph (Figure 7) can be used to identify the purity of the benzocaine product.
- 6. Figure 7: HPLC calibration curve graph of benzocaine product Using HPLC data of several repeats of the synthesised benzocaine (an example of which is shown in Figure 8) and the calibration curve, a purity calculation can be calculated. The benzocaine peak is at 4.34m which was identified from standard HPLC data for benzocaine. Average concentration of benzocaine = 54.44mg/L Volume of solution for HPLC = 10ml Concentration of benzocaine in 10ml HPLC solution = (54.44/1000) *10 = 0.544mg Purity of benzocaine per 1mg of product = (0.544/1) *100 = 54.4% purity The identity of those impurities is likely to be the intermediates from the previous steps that have not fully converted into benzocaine, or some reagents and reactants that were not completely filtered out of the synthesis. During step 2, the yield of the intermediate was close to 200%, which would give reasoning to the end purity of benzocaine.
- 7. Figure 8: HPLC chromatograph of synthesised benzocaine Using TLC, the purity can also be shown as their Rf values are very similar in value (Figure 9) when comparing the synthesised benzocaine (SB) and known pure benzocaine (K). The TLC can also be used as a method of identification as their similar Rf values show that the synthesised molecule and pure product are indeed the same.
- 8. Figure 9: TLC plate of synthesised benzocaine and pure benzocaine SB- Rf = 3.5/6.8 = 0.51 K- Rf= 3.7/6.8 = 0.54 Expected yield Mass of ethyl 4-nitrobenzoate (INT2) used in reaction = 4.84g Molecular weight of INT2 = 195.17 gmol-1 Moles of INT2 = 4.84/195.17 = 0.0248moles 1:1 ratio so moles of Benzocaine = 0.0248moles Molecular weight of Benzocaine = 165.19 gmol-1 Expected mass (yield) of benzocaine = 4.10g Actual yield of benzocaine = 0.46g Percentage yield = (0.46/4.10) *100 = 11.21%
- 9. Moving forwards The main stumbling point in the synthesis was during step 2, where the yield jumped by over 200%, which is where most impurities are likely to have entered the system. This step was conducted by only one person and not the full group so there’s chances of miscalculation or an error in the step, so to move forward, the best idea would be to be present to ensure conformation of the method and step completion. Experimental To a mixture of ethyl 4-nitrobenzoate (4.84g), 10% Pd/C (0.75g) and 60mL of methanol, ammonium formate (5.11g, 81.0mmol. 5. equiv) was added. The mixture was then reacted under reflux for 1 hour. The reaction mixture was then cooled and filtered through Celite and left to evaporate to give 0.46g of (11.21%) benzocaine. Rf = 0.51 (50% ethyl acetate/hexanes). 1H NMR (400Hz, d-CDCl3, 298K) δ 7.77 (d, 1H, J=8Hz), 6.57 (d, 1H, J=4Hz), 4.25 (q, 2H, J=7.16Hz), 3.99 (s, 2H) 1.29 (t, 3H, J= 7.12Hz). DEPTQ NMR (400Hz, d-CDCl3, 298 K) δ 166.8, 150.8, 131.6, 120.1, 113.8, 77.1, 60.3, 51.6, 14.4. FT-IR λmax/cm-1 3419.64, 3339.92, 3220.07, 3037.38, 2984.68, 2899.69, 1679.58, 1633.07, 1594.50, 1573.57, 1513.29, 1473.91, 1439.85, 1365.96, 1309.56, 1273.51, 1170.03, 1123.09, 1108.94, 1024.96, 979.33, 881.99, 845.03, 770.09, 699.27, 659.91, 639.05, 595.26, 544.72, 514.01, 502.22. References 1. D.E. Becker, K.L. Reed, Anesth. Prog., 2006, 53, 98-109