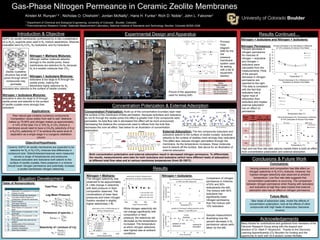
1. Nitrogen + Isobutane and Nitrogen + Isobutene:
Nitrogen Permeance:
Table of Nomenclature:
Gas-Phase Nitrogen Permeance in Ceramic Zeolite Membranes
Kirsten M. Runyan1,2 , Nicholas O. Chisholm1, Jordan McNally1, Hans H. Funke1, Rich D. Noble1, John L. Falconer1
1 Department of Chemical and Biological Engineering, University of Colorado , Boulder, Colorado
2 Thermodynamics Research Center, Materials Measurement Laboratory, National Institute of Standards and Technology, Boulder, Colorado 80305-3328
Equation Development
Experimental Design and Apparatus Results Continued…
Conclusions & Future Work
Conclusions:
Future Work:
Results
SAPO-34 zeolite membranes synthesized by in-situ crystallization
on α-Al2O3 supports were used in N2 mixture separations. Mixtures
evaluated were N2+CH4, N2+isobutane, and N2+isobutene.
isobutane also adsorbs to the surface of zeolite crystals.
Nitrogen + Isobutene Mixtures:
isobutene is also too large to fit through
zeolite pores and adsorbs to the surface
of zeolite crystals more strongly than
isobutane.
Applications:
Objective/Hypothesis:
Introduction & Objective
Symbol Equipment
V Valves
P Pressure Gauges
F Flow meter
BF Bubble Flow meter
GC Gas Chromatograph
M Zeolite Membrane
Acknowledgements
Many thanks for contributions and guidance from members of the
Falconer Research Group along with the support and
direction of Dr. Mark P. Stoykovich. Thanks to the Discovery
Learning Apprenticeship (CU Boulder) for funding and the
opportunity to work with DLA student Jordan McNally.
0
5
10
15
20
25
30
35
40
0 50 100 150
PercentDecrease(%)
Temperature (deg °C)
Percent Decrease in N2 in Mixtures of 10%
Isobutene at Various Flow Rates
600 sccm
300 sccm
75 sccm
0.5
1.0
1.5
2.0
0.0
0.0
0.0
0.0
0.0
0 5 10 15 20 25
N2Permeancex10-7
(mol/m2/s/Pa)
Time (minutes)
Sample N2 Permeance Measurements at 50
degrees °C and 300 sccm
V-2
V-6
V-1
V-7
V-4
V-5
P-7
GC
BF-1 BF-2
M
F
F-1
F
F-2
V-8
F
F-5
P-1
P-2
P-3
V-10 V-9
F
F-3V-3
F
F-4
Temp.
(°C)
Flow
rate
(sccm)
Iso-
Butane
Iso-
Butene
20
75 20.4 25.4
300 15.4 28.4
600 18.6 36.7
50
75 12.8 23.3
300 11.5 21.3
600 13.9 23.9
100
75 13.3 25.6
300 10.9 17.2
600 11.3 15.6
150
75 14.2 24.9
300 12.1 16.7
600 11.8 12.4
0
5
10
15
20
25
30
35
40
0 100 200
PercentDecrease(%)
Temperature (°C)
75 sccm
iso-Butene
iso-Butane
0
5
10
15
20
25
30
35
40
0 100 200
600 sccm
Zeolite crystalline
structure has small
pores through which
compounds may
permeate
Nitrogen + Methane Mixtures:
Although neither molecule adsorbs
strongly to the zeolite pores, these
membranes are selective for N2 because
N2 is a smaller molecule than CH4.
Nitrogen + Isobutane Mixtures:
isobutane is too large to fit through the
zeolite pores, making the
Membrane highly selective for N2.
Process
Flow
diagram
(left) for the
low
pressure
membrane
system used
for testing
with a list of
equipment
(below).
Picture of the apparatus
used for testing (left).
Raw natural gas contains numerous components.
Composition varies widely from well to well. Methane
makes up 75-90% and nitrogen makes up approximately
4-14% of the total. For a 10% N2 in CH4 mixture a
membrane would need to have a CH4/N2 selectivity of 6 or
a N2/CH4 selectivity of 17 to achieve the same level of
separation as a single stage in a cryogenic distillation
column
Ceramic SAPO-34 zeolite membranes are expected to be
selective for N2 in N2+CH4 mixtures due differences in
compound size. Selectivites/permeances were measured
across a range of temperatures and pressures.
Because isobutane and isobutene both adsorb to the
surface of zeolite crystals, there presence in a mixture
should lower nitrogen permeance and potentially increase
a zeolite membranes nitrogen selectivity.
Concentration Polarization & External Adsorption
Wall Concentration
Cw
Bulk Concentration
Cb Permeate
Concentration Cp
x = 0 x = δ
BOUNDARY LAYERFEED
PERMEATE
Solution Bulk
Flow
Membrane
Symbol Description
αij
Selectivity of component i in a binary
mixture of i and j
J Total flux through the membrane
PLM,i
Log Mean Partial Pressure of
component I across the membrane
PF Feed Pressure
PP Permeate Pressure
PR Retentate Pressure
xF,i
Mole fraction of component i in the
feed
xP,i
Mole fraction of component i in the
permeate
xR,i
Mole fraction of component i in the
retentate
Q Total volumetric flow rate into the
system
Am Surface area of the membrane
PA Ambient Pressure
TA Ambient Temperature
R Ideal Gas Constant
Total Flux: J =
Q P
Am T R
Log Mean Pressure:
PLM,i =
PF xF,i − xR,i
ln
PF xF,i − PP xP,i
PF xR,i − PP xP,i
Permeance of species, i:
Perm, i =
J xP,i
PLM,i
Selectivity of i (mixture of i+j):
αij =
Perm, i
Perm, j
FEED
Boundary
Layer
PERMEATE
PERMEATE
Nitrogen + Isobutane:
0
5
10
15
20
25
30
35
40
0 50 100 150 200
PercentDecrease(%)
Temperature °C
Percent Decrease in N2 Permeance in Mixtures
of 10% isobutane at Various Flow Rates
300 sccm
75 sccm
600 sccm
Concentration Polarization: Build-up of the concentration boundary layer near
the surface of the membrane inhibits permeation. Because isobutane and isobutene
do not fit through the zeolite pores this effect is greater than if the compounds were
permeable. As total flow rate is decreased this effect will be more pronounced.
Decreasing the distance the compounds need to diffuse from the bulk flow
decreases the over-all effect. See below for an illustration of concentration
polarization. External Adsorption: The two compounds isobutane and
isobutene adsorb to the surface of zeolite crystals. isobutene
adsorbs to the surface of zeolites more strongly than isobutane.
This effect also reduces nitrogen permeation through the
membrane. As the temperature increases, these molecules
tend to desorb off the surface. See above for an illustration of
external adsorption.
Both concentration polarization and external adsorption result in decreased nitrogen permeance. To differentiate
the results, measurements were take for both isobutane and isobutene (which have different heats of adsorption)
at different total flow rates and at various membrane temperatures (from 20-150°C)
Nitrogen + Methane:
The nitrogen selectivity was
observed to be approximately
6. Little change in selectivity
with feed pressure or feed
composition observed. The
combinations of lower feed
pressures and lower nitrogen
fraction resulted in slightly
higher selectivities (~8).
While nitrogen selectivity did
not change significantly with
composition or feed
pressure, the selectivity did
decrease as the temperature
increased. The temperature
at which nitrogen selectivity
was highest was at ambient
conditions.
addition of 10%
isobutane
removal of
isobutane0.5
1.0
1.5
2.0
12.8%
decrease
Sample measurement
illustrating how the
percent decrease in N2
permeance values were
taken (to the left).
Comparison of nitrogen
permeance in mixtures
of10% and 50%
isobutane(to the left).
The mixture with 50%
isobutane has
significantly lower
nitrogen permeance
than the mixture with
10% isobutane.
0
1
2
3
4
5
6
7
275 375 475
Selectivity
Feed Pressure (kPa)
Selectivity of N2 in 50/50 Mixture at
Various Temperatures
150 degree C
100 degree C
50 degree C
20 degree C
1 degree C
0
2
4
6
8
10
250 350 450 550
Selectivity
Feed Pressure (kPa)
Selectivity of Room Temperature
Membrane at Various Compositions
10% N2 90% CH4
30% N2 70% CH4
70% N2 30% CH4
0.0
0.0
0.0
0.0
0.0
0 50 100 150
Temperature °C
N2 Permeance as a Function of Temperature
at 10% and 50% isobutane
10%
50%
N2Permeancex10-7
(mol/m2/s/Pa)
Percent decrease in
nitrogen permeance
for mixtures of
nitrogen + isobutane
and nitrogen +
isobutene were
calculated from the
measurements. Plots
of the percent
decrease in nitrogen
permeance are
reported to the right.
This data is consistent
with the fact that
isobutene has a
higher heat of
adsorption than
isobutane and implies
external adsorption
has an effect on
permeance.
Varying pressure and composition has little effect on
nitrogen selectivity in N2+CH4 mixtures. However, the
highest nitrogen selectivity was observed at ambient
temperature. Low flow rate data suggests that
concentration polarization is occurring. The comparison
between nitrogen permeance when flowing with isobutane
and isobutene at high flow rates implies that external
adsorption also has an effect on nitrogen permeance.
Take heats of adsorption data, model the effects of
concentration polarization, look at the effects of other
compounds with high heats of adsorption (benzene,
toluene)
Percent Decrease in N2 Permeance in Mixtures
of 10% isobutane at Various Flow Rates
High and low flow rate data (above) implies there is both an effect
from concentration polarization and external adsorption.