Chapter 2.ppt of macroeconomics by mankiw 9th edition
Weekly Market Report
1. Page 1 of 5
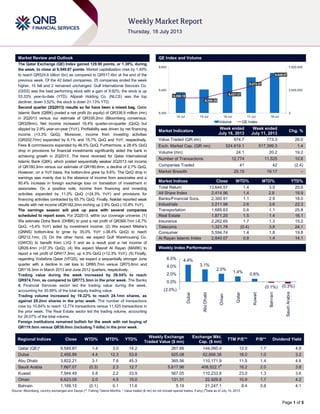
Market Review and Outlook QE Index and Volume
The Qatar Exchange (QE) Index gained 129.90 points, or 1.38%, during
the week, to close at 9,549.87 points. Market capitalization rose by 1.40%
to reach QR524.6 billion (bn) as compared to QR517.4bn at the end of the
previous week. Of the 42 listed companies, 25 companies ended the week
higher, 15 fell and 2 remained unchanged. Gulf International Services Co.
(GISS) was the best performing stock with a gain of 9.92%; the stock is up
53.33% year-to-date (YTD). Alijarah Holding Co. (NLCS) was the top
decliner, down 3.52%; the stock is down 21.13% YTD.
Second quarter (2Q2013) results so far have been a mixed bag. Qatar
Islamic Bank (QIBK) posted a net profit (to equity) of QR338.9 million (mn)
in 2Q2013 versus our estimate of QR335.2mn (Bloomberg consensus:
QR328mn). Net income increased 16.4% quarter-on-quarter (QoQ) but
slipped by 2.9% year-on-year (YoY). Profitability was driven by net financing
income (+3.3% QoQ). Moreover, income from investing activities
(QR202.7mn) expanded by 6.1% and 15.7% QoQ and YoY, respectively.
Fees & commissions expanded by 46.5% QoQ. Furthermore, a 28.4% QoQ
drop in provisions for financial investments significantly aided the bank in
achieving growth in 2Q2013. The trend reversed for Qatar International
Islamic Bank (QIIK), which posted sequentially weaker 2Q2013 net income
of QR180.3mn versus our estimate of QR180.8mn, a decline of 2.7% QoQ.
However, on a YoY basis, the bottom-line grew by 9.6%. The QoQ drop in
earnings was mainly due to the absence of income from associates and a
90.4% increase in foreign exchange loss on translation of investment in
associates. On a positive note, income from financing and investing
activities expanded by 11.0% QoQ (+24.3% YoY) and provisions for
financing activities contracted by 65.7% QoQ. Finally, Nakilat reported weak
results with net income ofQR182.2mn inching up 2.9% QoQ (-10.8% YoY).
The earnings season will pick up pace with several companies
scheduled to report soon. For 2Q2013, within our coverage universe: (1)
We estimate Doha Bank (DHBK) to post a net profit of QR368.7mn (-6.7%
QoQ, +5.4% YoY) aided by investment income; (2) We expect Milaha‟s
(QNNS) bottom-line to grow by 35.0% YoY (-38.4% QoQ) to reach
QR212.1mn; (3) On the other hand, we expect Gulf Warehousing Co.
(GWCS) to benefit from LVQ 3 and as a result post a net income of
QR28.4mn (+37.3% QoQ); (4) We expect Masraf Al Rayan (MARK) to
report a net profit of QR417.3mn, up 4.3% QoQ (+12.3% YoY); (5) Finally,
regarding Vodafone Qatar (VFQS), we expect a sequentially stronger June
quarter with a decline in net loss to QR65.7mn versus QR73.6mn and
QR118.3mn in March 2013 and June 2012 quarters, respectively.
Trading value during the week increased by 26.04% to reach
QR974.7mn, as compared to QR773.3mn in the prior week. The Banks
& Financial Services sector led the trading value during the week,
accounting for 30.89% of the total equity trading value.
Trading volume increased by 19.22% to reach 24.1mn shares, as
against 20.2mn shares in the prior week. The number of transactions
rose by 10.84% to reach 12,774 transactions versus 11,525 transactions in
the prior week. The Real Estate sector led the trading volume, accounting
for 26.07% of the total volume.
Foreign institutions remained bullish for the week with net buying of
QR119.5mn versus QR38.0mn (including T-bills) in the prior week.
Market Indicators
Week ended
July 18, 2013
Week ended
July 11, 2013
Chg. %
Value Traded (QR mn) 974.7 773.3 26.0
Exch. Market Cap. (QR mn) 524,619.1 517,399.3 1.4
Volume (mn) 24.1 20.2 19.2
Number of Transactions 12,774 11,525 10.8
Companies Traded 41 42 (2.4)
Market Breadth 25:15 19:17 –
Market Indices Close WTD% MTD% YTD%
Total Return 13,644.57 1.4 3.0 20.6
All Share Index 2,414.96 1.4 2.8 19.9
Banks/Financial Svcs. 2,300.91 1.1 2.9 18.0
Industrials 3,211.98 2.6 3.6 22.3
Transportation 1,685.63 0.6 1.1 25.8
Real Estate 1,871.25 1.5 1.4 16.1
Insurance 2,262.65 1.7 1.3 15.2
Telecoms 1,321.78 (0.4) 3.8 24.1
Consumer 5,594.74 1.4 1.8 19.8
Al Rayan Islamic Index 2,840.07 0.8 1.4 14.1
Market Indices
Weekly Index Performance
Regional Indices Close WTD% MTD% YTD%
Weekly Exchange
Traded Value ($ mn)
Exchange Mkt.
Cap. ($ mn)
TTM P/E** P/B** Dividend Yield
Qatar (QE)* 9,549.87 1.4 3.0 14.2 267.66 144,060.4 12.0 1.7 4.8
Dubai 2,495.89 4.4 12.3 53.8 925.08 62,666.36 16.0 1.0 3.2
Abu Dhabi 3,822.21 3.1 7.6 45.3 365.56 110,171.9 11.5 1.4 4.6
Saudi Arabia 7,667.07 (0.3) 2.3 12.7 5,617.96 408,522.1#
16.2 2.0 3.8
Kuwait 7,944.49 0.8 2.2 33.9 567.05 110,233.8 23.0 1.3 3.6
Oman 6,623.05 2.0 4.5 15.0 131.31 22,929.8 10.9 1.7 4.2
Bahrain 1,189.15 (0.1) 0.1 11.6 5.19 21,247.1 8.4 0.8 4.1
Source: Bloomberg, country exchanges and Zawya (** Trailing Twelve Months; * Value traded ($ mn) do not include special trades, if any) (
#
Data as of July 10, 2013
9,398.19
9,399.30
9,437.27
9,473.57
9,549.87
0
3,500,000
7,000,000
9,300
9,450
9,600
14-Jul 15-Jul 16-Jul 17-Jul 18-Jul
Volume QE Index
4.4%
3.1%
2.0%
1.4%
0.8%
(0.1%) (0.3%)
(2.0%)
0.0%
2.0%
4.0%
6.0%
Dubai
AbuDhabi
Oman
Qatar
Kuwait
Bahrain
SaudiArabia
2. Page 2 of 5
News
Economic News
S&P: Qatar in net external creditor position of around
$50bn – According to a report by the ratings agency S&P,
Qatar is in a “net external creditor” position of about $50bn
despite the country‟s total external debt rising steadily in recent
years. S&P said Qatar‟s total external debt was estimated at
$166bn in 2012. However, this debt is more than offset by the
external assets accumulated by the Qatar Investment Authority.
S&P has associated Qatar‟s current account balance and
external debt position with limited vulnerability as the country
has posted extremely strong current account surpluses fuelled
by hydrocarbon exports. S&P also expects the trade surplus to
remain strong in 2013 due to high oil & gas prices, which will
more than compensate the expected higher debt service from
rising gross external debt. Moreover, S&P said it considers
Qatar‟s economy to be in an expansionary phase with a real
GDP growth of 6% in 2012. Credit growth in the banking sector
has been exceptionally strong over the past five years, growing
at 30% in 2011 and 21% in 2012. This growth was mainly
driven by borrowing by government and quasi-government
institutions, which rose by 45% and 47% in 2011 and 2012
respectively. (Gulf-Times.com)
S&P: Exposure of real estate, aggressive expansion plans
“weaknesses” of Qatar’s banking sector – According to a
report by S&P, severe exposure to real estate market and
aggressive expansion plans are the key weaknesses for
Qatar‟s banking sector, despite its high stability and strong
profitability. S&P expects the country‟s real estate market to
recover from its sharp decline since 2009, but the commercial
segment remains more vulnerable than the housing segment.
S&P said this is one of the main risks faced by Qatari banking
sector given its high concentration on lending to cyclical sectors
such as real estate & construction. S&P also said that lending
concentration in the real estate & construction sectors is high at
20% of total loans at year-end 2012. In addition, foreign
currency lending has recently increased dramatically and
accounted for 51% of total loans at the end of 2012. However,
the ratings agency said economic risks for the Qatari banking
sector remain average in a global comparison. (Peninsula
Qatar)
Market & Corporate News
Nakilat’s 2Q2013 results come in below our estimate;
maintain Market Perform rating with QR18.10 price target.
Nakilat reported lower-than-expected 2Q2013 results with: (1)
Revenue from wholly-owned vessels falling 4% short of our
estimate at QR742mn (almost -1% QoQ, flattish YoY) with the
sequential decline driven by lower recoupment of operating
costs (sequentially, overall operating costs declined by
~QR12mn vs. ~QR4mn decline in revenue). (2) EBITDA of
QR581mn also fell below our estimate of QR600mn. (3)
Adjusted EBITDA of QR668mn (flat QoQ, -4% YoY) was 5%
below our estimate of QR704mn driven primarily by lower-than-
expected EBITDA and interest, vessel sub-chartering and other
income. (4) Net income of QR182mn (+3% QoQ, -11% YoY)
was also impacted by QR3mn in losses from derivative
instruments in JVs, which we do not model. Excluding this, net
income was 13% softer than our estimate of QR212mn. Given
the company‟s 1H2013 financial performance, we are likely to
revise our 2013 full year estimates downward. (QE, QNBFS
Research)
QIBK’s 2Q2013 net profit broadly in line with our
expectations. Qatar Islamic Bank (QIBK) posted a net profit (to
equity) of QR338.9mn in 2Q2013 vs. our estimate of
QR335.2mn (Bloomberg consensus: QR328mn). Net income
increased 16.4% QoQ but slipped by 2.9% YoY. Profitability
was driven by net financing income (+3.3% QoQ). Moreover,
income from investing activities (QR202.7mn) expanded by
6.1% and 15.7% QoQ and YoY, respectively. Fees &
commissions expanded by 46.5% QoQ. Furthermore, a 28.4%
QoQ drop in provisions for financial investments significantly
aided the bank in achieving growth in 2Q2013. The loan book
and deposit book expanded QoQ. QIBK‟s loan book expanded
by 9.3% QoQ (-4.1% YTD). Equity of unrestricted investment
account holders followed suit and gained by 7.5% QoQ (-3.2%
YTD). We maintain our estimates for 2013 and our target price
remains at QR74.96. We expect the bank to post EPS of
QR6.32 and QR6.71 for 2013 and 2014, respectively. On the
DPS front, we expect the bank to pay a cash DPS of QR4.50
and 4.75 for 2013 and 2014, respectively. (QE, QNBFS
Research)
QIIK 2Q2013 results right in line with our estimates. QIIK
(Qatar International Islamic Bank) posted a net profit
QR180.3mn vs. our estimate of QR180.8mn in 2Q2013, a
decline of 2.7% QoQ. However, on a YoY basis, the bottom-line
grew by 9.6%. The QoQ drop in earnings was mainly due to the
absence of income from associates and a 90% increase in
foreign exchange loss on translation of investment in
associates. On a positive note, income from financing and
investing activities expanded by 11% QoQ (+24.3% YoY) and
provisions for financing activities contracted by 65.7% QoQ.
QIIK‟s loan book grew by 6.6% QoQ (+13.7% YTD), while total
deposits inched up by 3.5% QoQ (+7.5% YTD). (QE, QNBFS
Research)
ABQK reports QR135.7mn net profit in 2Q2013 – Al Ahli
Bank (ABQK) has reported a net profit of QR135.7mn in
2Q2013, reflecting an increase of 10.7% YoY (+0.5% QoQ).
The bank‟s net profit rose by 12.4% YoY in 1H2013 to
QR270.7mn. ABQK‟s net interest income increased by 30.7%
YoY (+6.5% QoQ) to QR166.5mn in 2Q2013, while in 1H2013,
it rose by 27.1% YoY to QR322.8mn. EPS stood at QR2.13 in
1H2013 as compared to QR2.02 in 1H2012. Total assets at the
end of June 2013 stood at QR24.7bn over QR20.6bn in
December 2012. Loans & advances rose by 13.1% YTD to
QR15.9bn, while customer deposits were up by 25.5% YTD to
QR17.5bn. (QE)
BRES’ subsidiary wins QR61mn ruling against two
Bahraini firms – Barwa Real Estate Company‟s (BRES)
subsidiary, Barwa International has won a ruling worth QR61mn
in the Bahrain Chamber of Dispute Resolution (BCDR) against
the Bahraini companies: Inovest and Al Khaleeji Development
Company. BRES has now obtained the attachment order from
the Bahraini courts and will present it to the Central Bank of
Bahrain (CBB) to instruct all banks in the country to freeze
accounts of the defendants to the amount of the judgment
awarded to BRES. In June 2012, BRES had filed a case in the
BCDR against an investment product promoted by Inovest in
2008, prior to Inovest obtaining an appropriate license from the
CBB. (Gulf-Times.com)
CBQK to disclose its 1H2013 financials on July 23 – The
Commercial Bank of Qatar (CBQK) will disclose its reviewed
financial results for the period ending June 30, 2013 on July 23,
2013. (QE)
3. Page 3 of 5
Qatar Exchange
Top 5 Gainers Top 5 Decliners
Source: Qatar Exchange (QE) Source: Qatar Exchange (QE)
Most Active Shares by Value (QR Million) Most Active Shares by Volume (Million)
Source: Qatar Exchange (QE) Source: Qatar Exchange (QE)
Investor Trading Percentage to Total Value Traded Net Traded Value by Nationality (QR Million)
Source: Qatar Exchange (QE) Source: Qatar Exchange (QE)
9.9%
8.6%
5.1%
4.1% 3.9%
0.0%
2.5%
5.0%
7.5%
10.0%
Gulf
International
Services
Medicare
Group
Qatar
Electricity and
Water
United
Development
Qatar General
Insurance &
Reinsurance
-3.5%
-2.5%
-1.8%
-1.4% -1.3%
-4.5%
-3.0%
-1.5%
0.0%
National
Leasing
Islamic
Holding Group
Al Khaleej
Takaful
Insurance
Qatar
Industrial
Manufacturing
Qatar Islamic
Bank
140.1
106.9 106.9
68.0
61.8
0.0
60.0
120.0
180.0
Industries
Qatar
QNB Group United
Development
Medicare
Group
Qatar Gas
Transport
(Nakilat)
4.7
3.4
1.5
1.3 1.2
0.0
2.0
4.0
6.0
United
Development
Qatar Gas
Transport
(Nakilat)
Medicare
Group
Gulf
International
Services
National
Leasing
0%
20%
40%
60%
80%
100%
Buy Sell
40.27% 46.00%
17.61%
22.47%
11.34%
13.01%
30.78%
18.52%
Qatari Individuals Qatari Institutions
Non-Qatari Individuals Non-Qatari Institutions
564
411
667
307
(103)
103
(200) (100) - 100 200 300 400 500 600 700 800
Qatari
Non-Qatari
Net Investment Total Sold Total Bought
4. Page 4 of 5
TECHNICAL ANALYSIS OF THE QE INDEX
Source: Bloomberg
The QE Index ended the week on a bullish note, tagging a new 52-week high of 9,549.87, and surpassed its previous high of 9,537.75. The current trend is
upward with the index comfortably trading above its 21-day and 55-day moving averages. The index breached its resistance at the 9,500.0 psychological
level and also penetrated above its 52-week high to close on a strong note on Thursday, which is a positive development. The index now faces its next
resistance at the 9,565.0 level. A breakout above this level could take the index toward the 9,600.0 psychological level and firmly confirm its bullish trend.
The next target, if the index clears this level, may open the possibility of a new higher wave toward the 9,700.0 level. Moreover, the MACD is diverging away
from the signal line and is moving in an upward direction indicating a sustained higher move. However, the RSI is in the overbought zone. Thus, we may
see some profit-booking before a fresh upmove. Traders should take confidence from the fact that the upmove has been on account of relatively higher
volumes. On the downside, a fall below 9,500.0 may pull the index to test 9,400.0.
DEFINITIONS OF KEY TERMS USED IN TECHNICAL ANALYSIS
RSI (Relative Strength Index) indicator – RSI is a momentum oscillator that measures the speed and change of price movements. The RSI oscillates
between 0 to 100. The index is deemed to be overbought once the RSI approaches the 70 level, indicating that a correction is likely. On the other hand, if
the RSI approaches 30, it is an indication that the index may be getting oversold and therefore likely to bounce back.
MACD (Moving Average Convergence Divergence) indicator – The indicator consists of the MACD line and a signal line. The divergence or the
convergence of the MACD line with the signal line indicates the strength in the momentum during the uptrend or downtrend, as the case may be. When the
MACD crosses the signal line from below and trades above it, it gives a positive indication. The reverse is the situation for a bearish trend.
Candlestick chart – A candlestick chart is a price chart that displays the high, low, open, and close for a security. The „body‟ of the chart is portion between
the open and close price, while the high and low intraday movements form the „shadow‟. The candlestick may represent any time frame. We use a one-day
candlestick chart (every candlestick represents one trading day) in our analysis.
Doji candlestick pattern – A Doji candlestick is formed when a security's open and close are practically equal. The pattern indicates indecisiveness, and
based on preceding price actions and future confirmation, may indicate a bullish or bearish trend reversal.
Shooting Star/Inverted Hammer candlestick patterns – These candlestick patterns have a small real body (open price and close price are near to each
other), and a long upper shadow (large intraday movement on the upside). The Shooting Star is a bearish reversal pattern that forms after a rally. The
Inverted Hammer looks exactly like a Shooting Star, but forms after a downtrend. Inverted Hammers represent a potential bullish trend reversal.
5. Contacts
Ahmed M. Shehada Keith Whitney Saugata Sarkar Sahbi Kasraoui
Head of Trading Head of Sales Head of Research Manager - HNWI
Tel: (+974) 4476 6535 Tel: (+974) 4476 6533 Tel: (+974) 4476 6534 Tel: (+974) 4476 6544
ahmed.shehada@qnbfs.com.qa keith.whitney@qnbfs.com.qa saugata.sarkar@qnbfs.com.qa sahbi.alkasraoui@qnbfs.com.qa
QNB Financial Services SPC
Contact Center: (+974) 4476 6666
PO Box 24025, Doha, Qatar
DISCLAIMER: This publication has been prepared by QNB Financial Services SPC (“QNBFS”) a wholly-owned subsidiary of Qatar National Bank (“QNB”). QNBFS is regulated by the Qatar
Financial Markets Authority and the Qatar Exchange; QNB is regulated by the Qatar Central Bank. This publication expresses the views and opinions of QNBFS at a given time only. It is not an
offer, promotion or recommendation to buy or sell securities or other investments, nor is it intended to constitute legal, tax, accounting, or financial advice. We therefore strongly advise potential
investors to seek independent professional advice before making any investment decision. Although the information in this report has been obtained from sources that QNBFS believes to be
reliable, we have not independently verified such information and it may not be accurate or complete. While this publication has been prepared with the utmost degree of care by our analysts,
QNBFS does not make any representations warranties as to the accuracy and completeness of the information it may contain, and declines any liability in that respect. QNBFS reserves the right
to amend the views and opinions expressed in this publication at any time. It may also express viewpoints or make investment decisions that differ significantly from, or even contradict, the views
and opinions included in this report.
COPYRIGHT: No part of this document may be reproduced without the explicit written permission of QNBFS.
Page 5 of 5
Source: Bloomberg
Company Name
Price
(July 18)
% Change 5-
Day
% Change
Monthly
Market Cap.
QR Million TTM P/E P/B Div. Yield
Qatar National Bank 166.00 2.79 5.46 116,155 13.0 2.4 3.6
Qatar Islamic Bank 68.00 (1.31) (0.15) 16,068 14.3 1.4 5.5
Commercial Bank of Qatar 72.10 0.98 3.44 17,841 8.7 1.3 8.3
Doha Bank 47.60 (0.94) 1.49 12,299 8.1 1.2 8.7
Al Ahli Bank 55.50 0.91 (2.63) 7,053 13.6 2.2 5.4
Qatar International Islamic Bank 54.00 0.56 0.19 8,174 11.6 1.7 6.5
Masraf Al Rayan 27.80 0.18 0.72 20,850 13.4 2.3 3.6
Al Khaliji Bank 16.80 0.18 (0.59) 6,048 11.6 1.1 6.0
National Leasing 35.65 (3.52) (3.91) 1,764 8.6 1.4 5.6
Dlala Holding 27.20 0.18 1.68 604 23.5 2.6 N/A
Qatar & Oman Investment 13.50 1.35 (1.39) 425 21.6 1.4 3.7
Islamic Holding Group 42.30 (2.53) (1.86) 169 27.0 4.1 2.7
Banking and Financial Services 207,449
Zad Holding 61.00 1.67 2.35 798 7.5 0.6 6.6
Qatar German Co. for Medical Devices 16.11 0.69 0.25 186 N/M 1.0 N/A
Salam International Investment 12.85 (1.31) (1.15) 1,469 21.6 0.9 5.4
Medicare Group 46.35 8.55 9.57 1,304 28.3 1.6 3.9
Qatar Cinema & Film Distribution 55.00 0.00 0.00 314 27.5 2.4 3.6
Qatar Fuel 258.80 1.57 2.29 16,814 14.6 3.2 3.9
Qatar Meat and Livestock 63.00 (0.47) (0.63) 1,134 15.0 3.9 6.3
Al Meera Consumer Goods 134.40 (0.44) (1.61) 2,688 17.4 2.2 6.0
Consumer Goods and Services 24,707
Qatar Industrial Manufacturing 51.30 (1.35) (5.00) 2,031 10.3 1.7 5.8
Qatar National Cement 100.00 (0.50) (3.85) 4,910 11.5 2.2 6.0
Industries Qatar 164.80 2.11 4.57 99,704 11.0 3.5 4.7
Qatari Investors Group 28.50 2.52 6.15 3,543 20.7 1.8 2.6
Qatar Electricity and Water 163.90 5.06 3.15 16,390 12.2 3.4 4.5
Mannai Corp. 86.80 0.93 (1.36) 3,960 8.4 1.9 5.5
Aamal 14.38 0.21 (0.21) 8,628 14.1 1.3 N/A
Gulf International Services 46.00 9.92 11.92 6,839 13.5 2.7 3.3
Industrials 146,006
Qatar Insurance 61.70 1.48 1.15 7,924 10.0 1.4 3.3
Doha Insurance 26.55 2.12 3.91 683 11.3 1.4 3.4
Qatar General Insurance & Reinsurance 48.40 3.86 3.86 2,790 15.3 1.1 1.8
Al Khaleej Takaful Insurance 43.10 (1.82) (3.15) 736 9.9 1.3 1.9
Qatar Islamic Insurance 60.40 (0.82) (2.89) 906 15.3 3.8 5.8
Insurance 13,040
United Development 22.90 4.09 (0.43) 7,722 9.6 0.7 4.4
Barwa Real Estate 27.30 (0.18) 2.82 10,623 12.9 0.8 5.5
Ezdan Real Estate 17.02 (0.41) (2.69) 45,145 77.0 1.6 0.8
Mazaya Qatar Real Estate Development 11.42 0.09 0.88 1,142 20.9 1.1 5.3
Real Estate 64,633
Qatar Telecom 126.00 (0.55) 4.30 40,360 12.8 1.6 4.0
Vodafone Qatar 9.16 0.22 0.66 7,744 N/M 1.3 N/A
Telecoms 48,104
Qatar Navigation (Milaha) 73.50 2.65 2.08 8,418 9.4 0.8 5.1
Gulf Warehousing 42.00 0.00 2.07 1,998 22.9 2.7 N/A
Qatar Gas Transport (Nakilat) 18.33 (0.81) 0.16 10,265 13.6 3.2 5.5
Transportation 20,680
Qatar Exchange 524,619