Download as PDF, PPTX


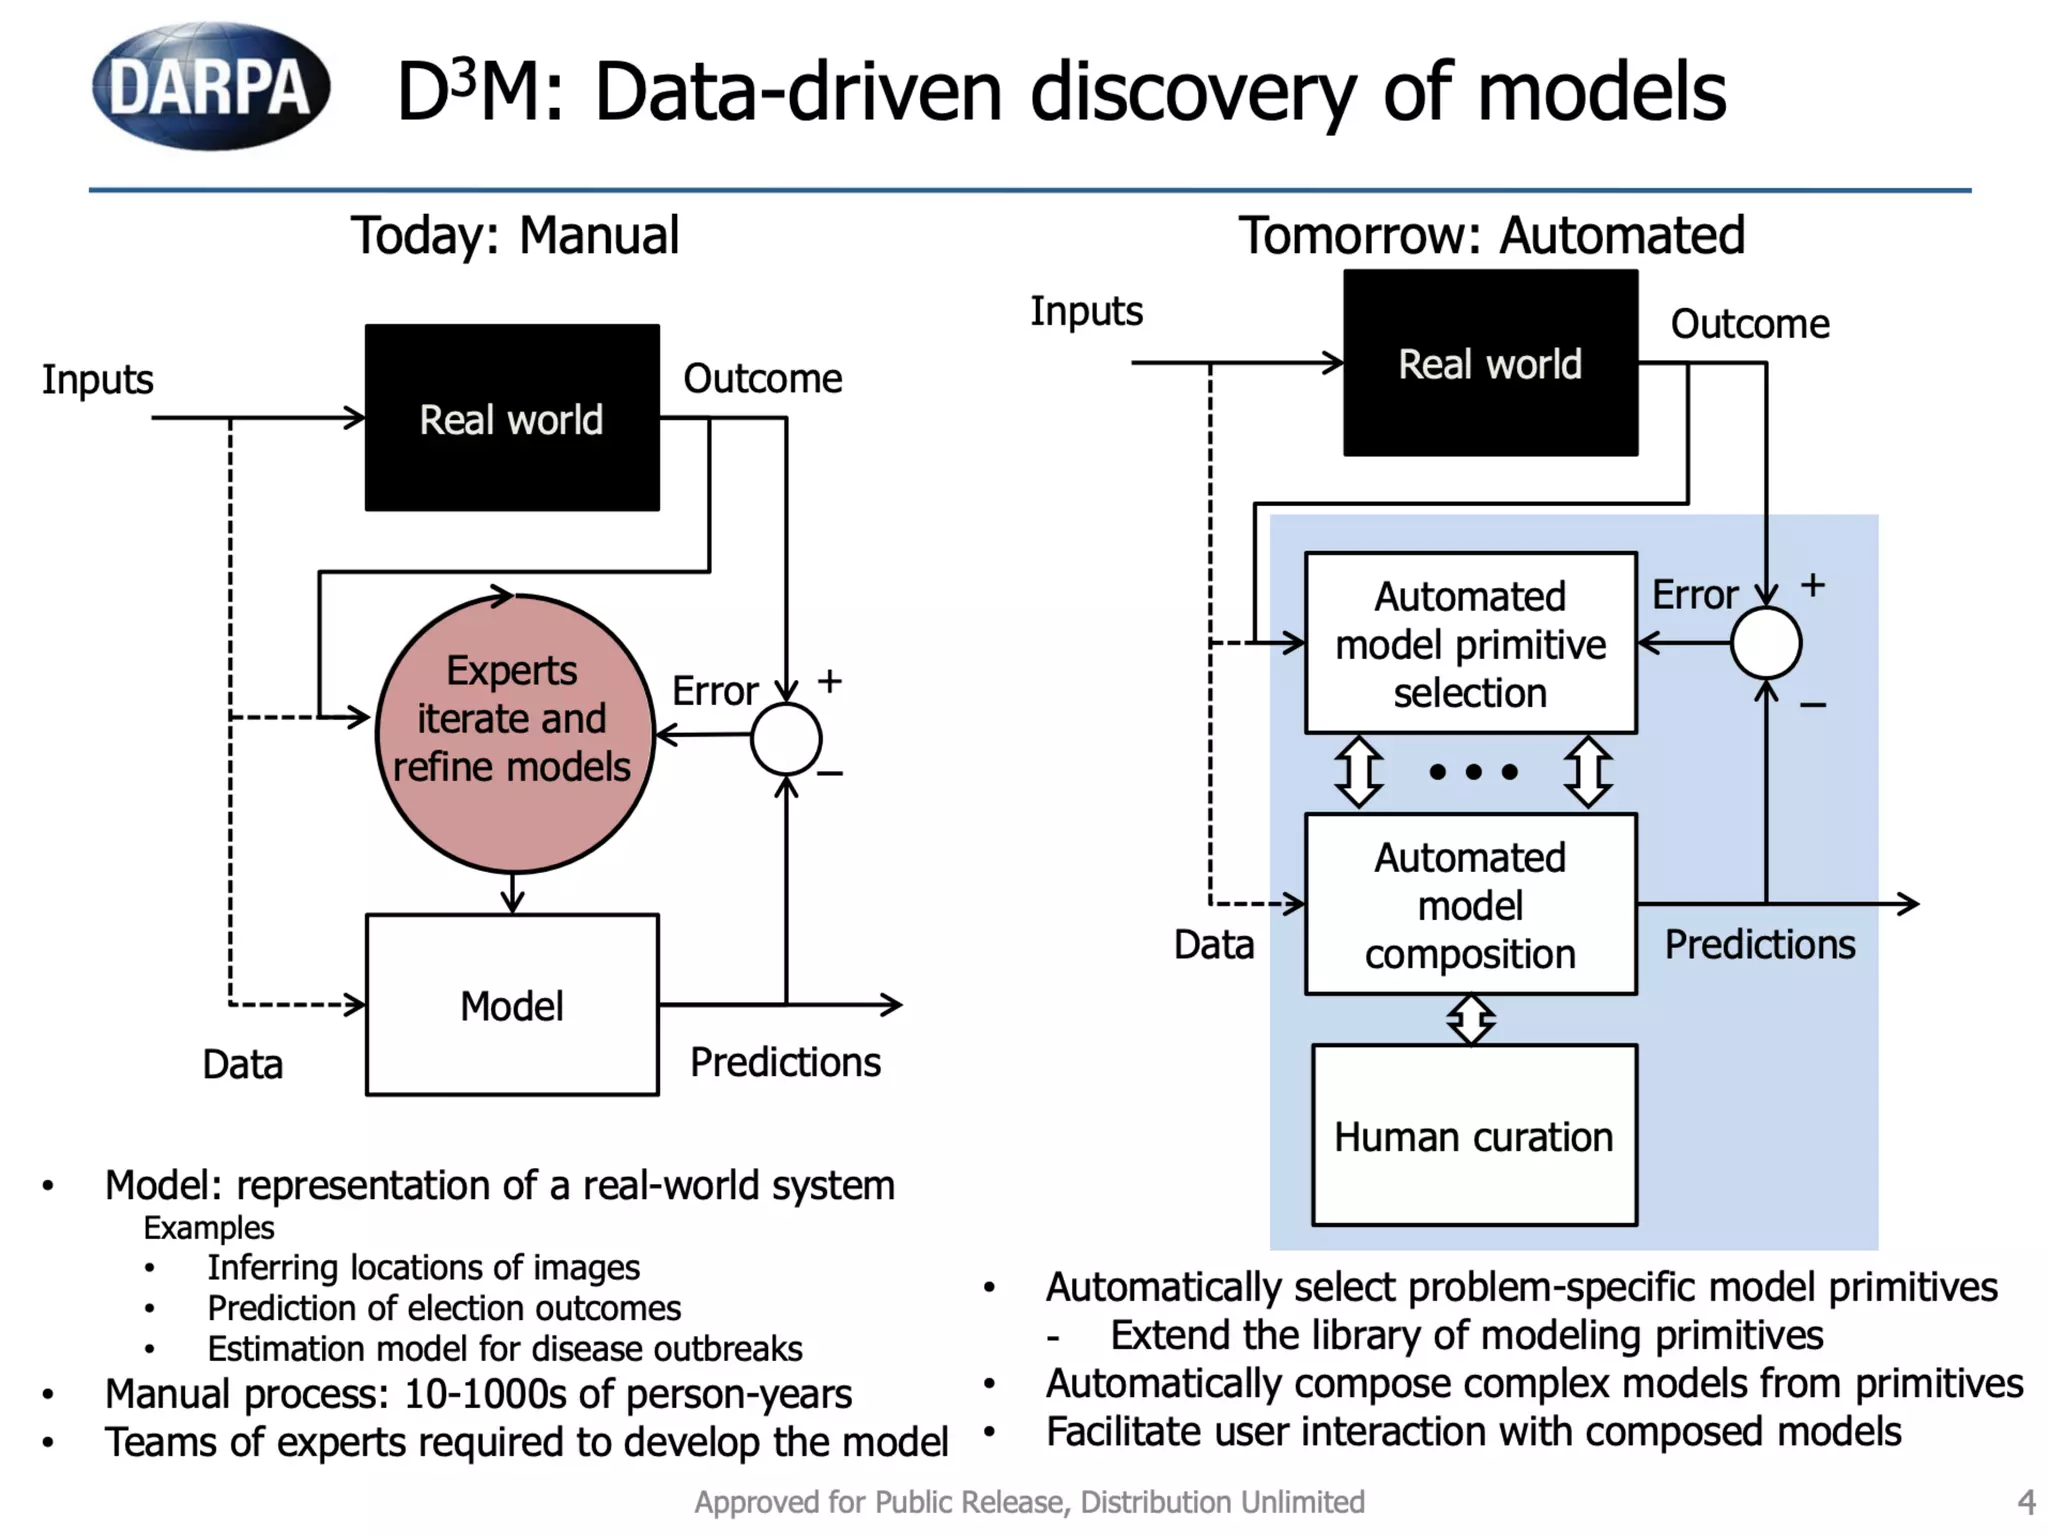


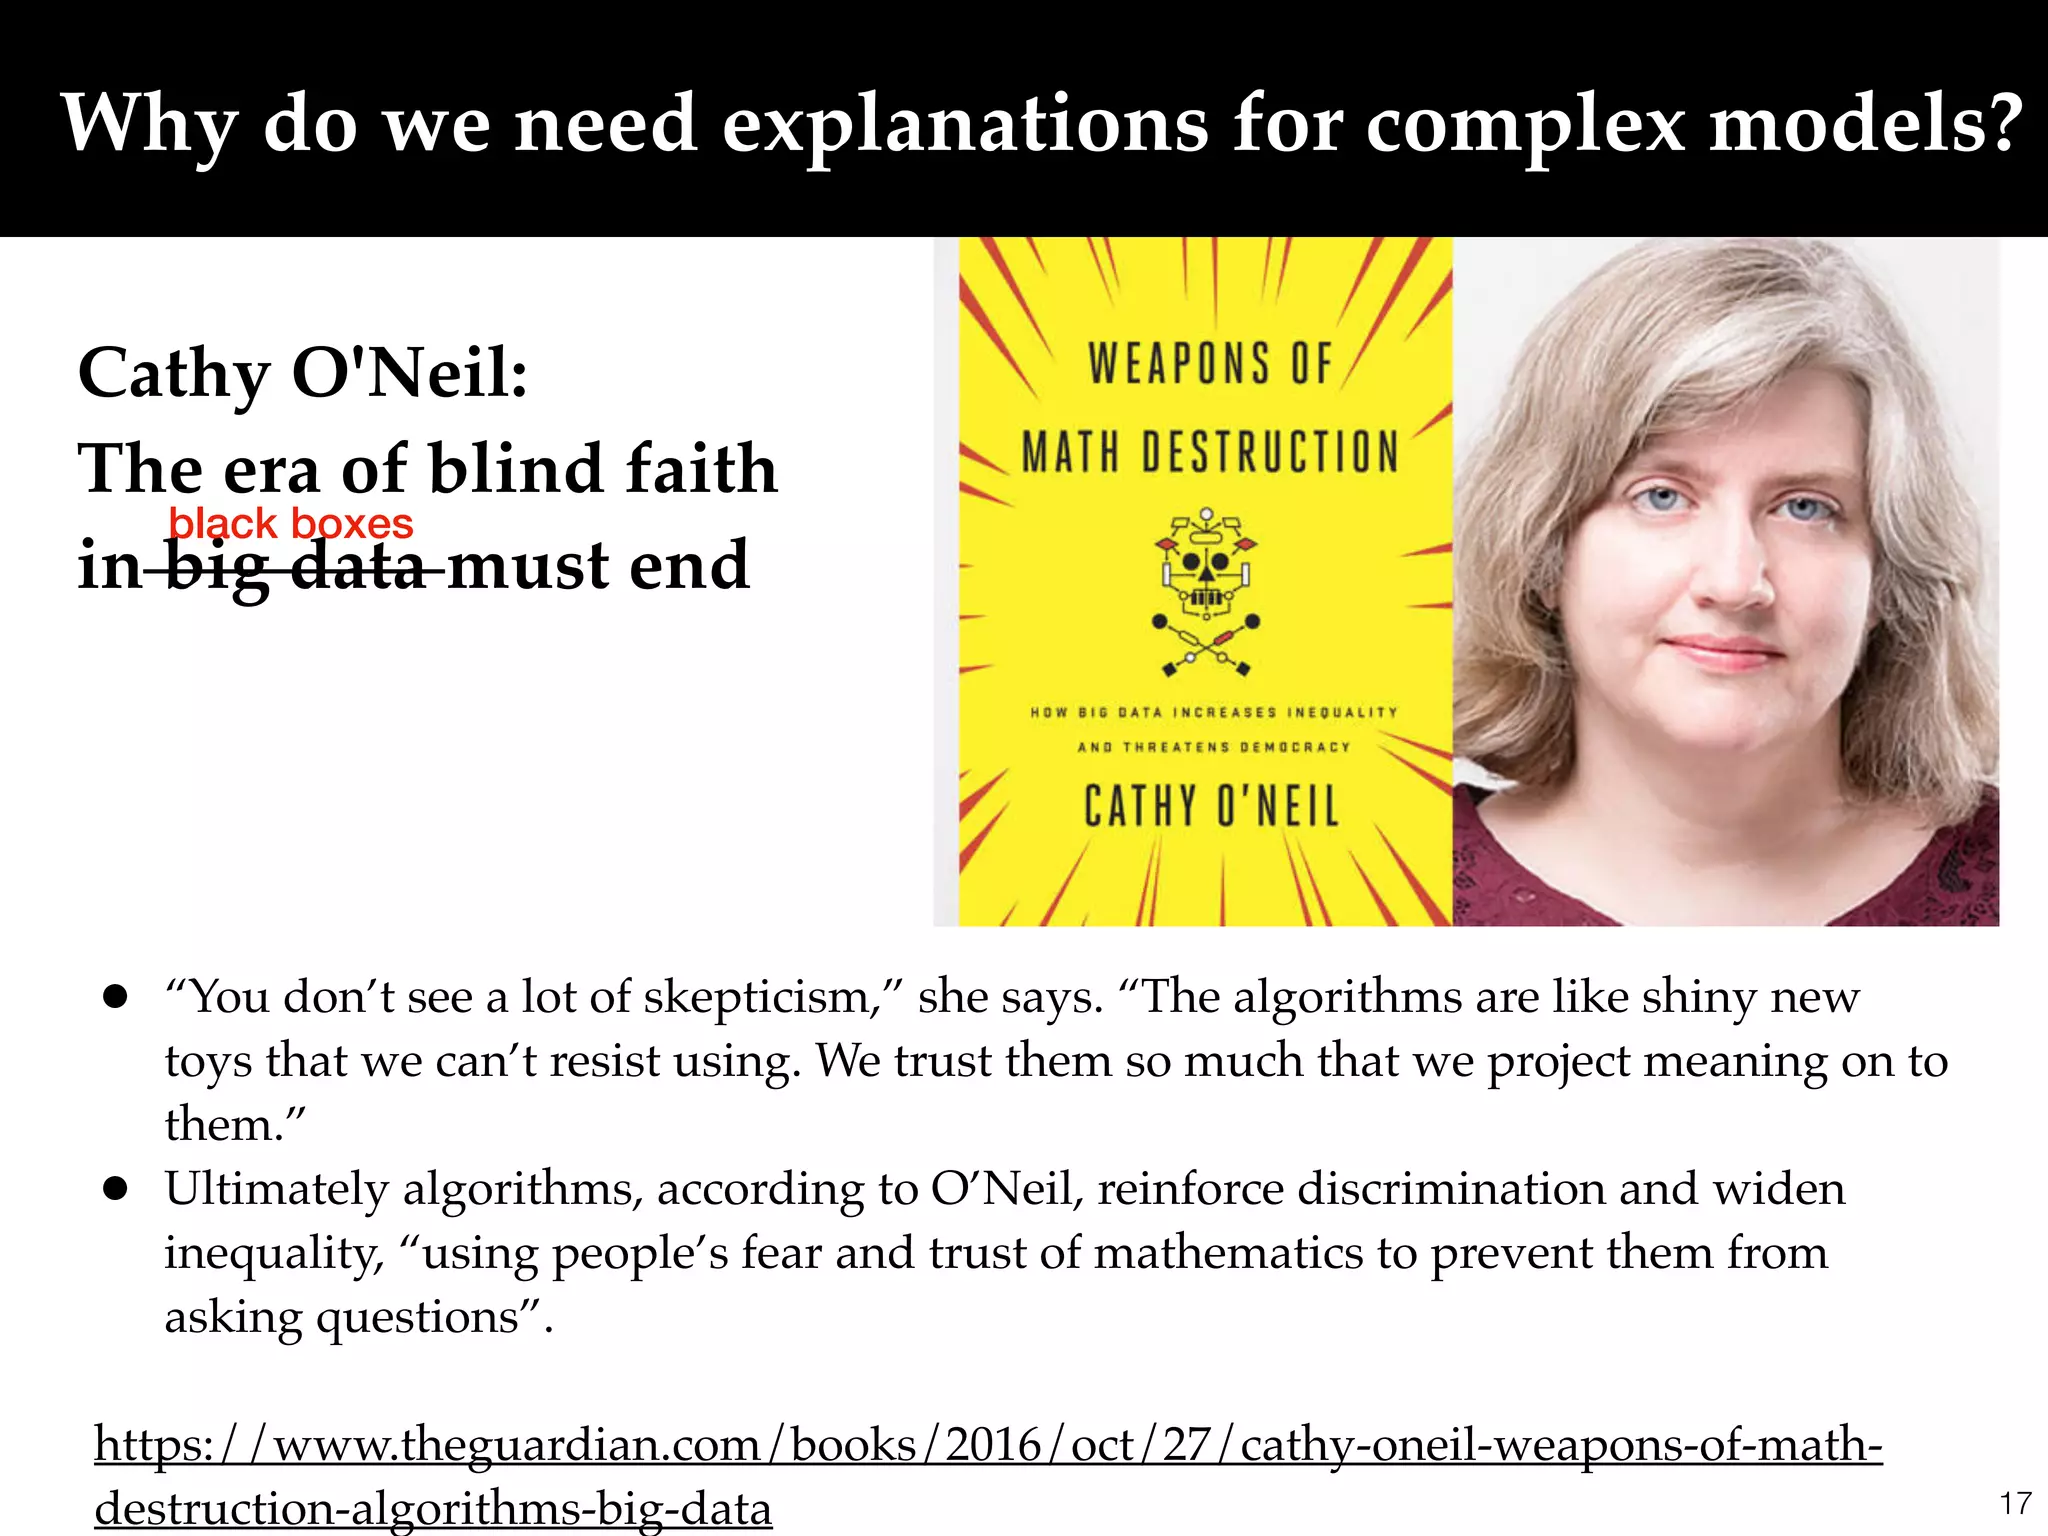

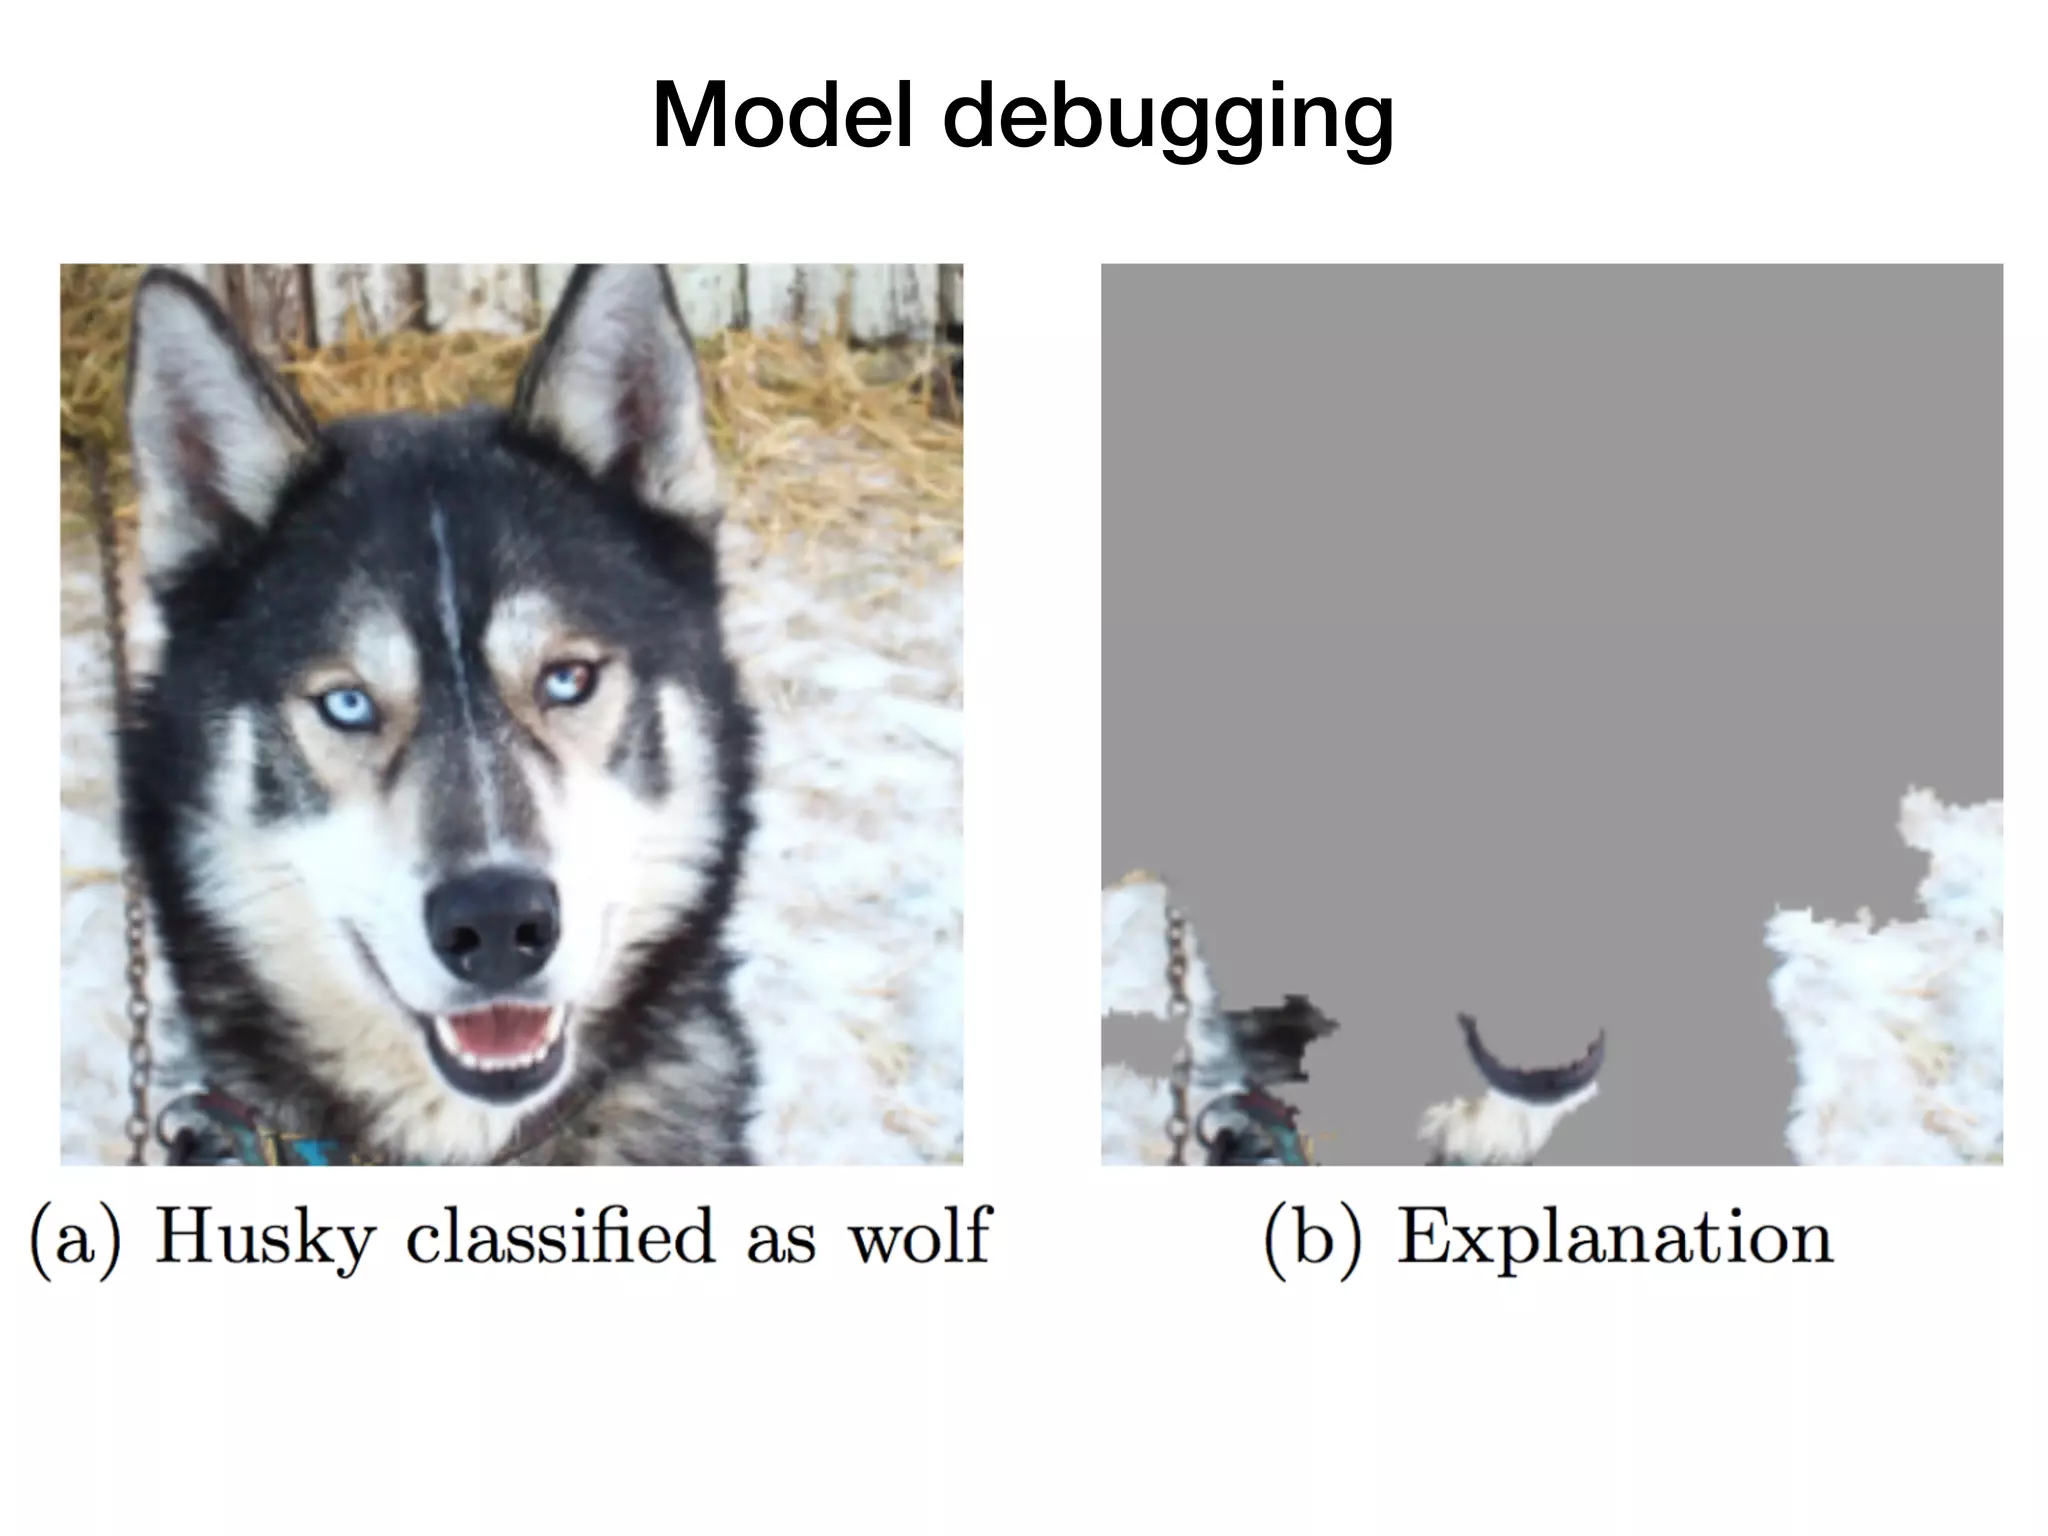
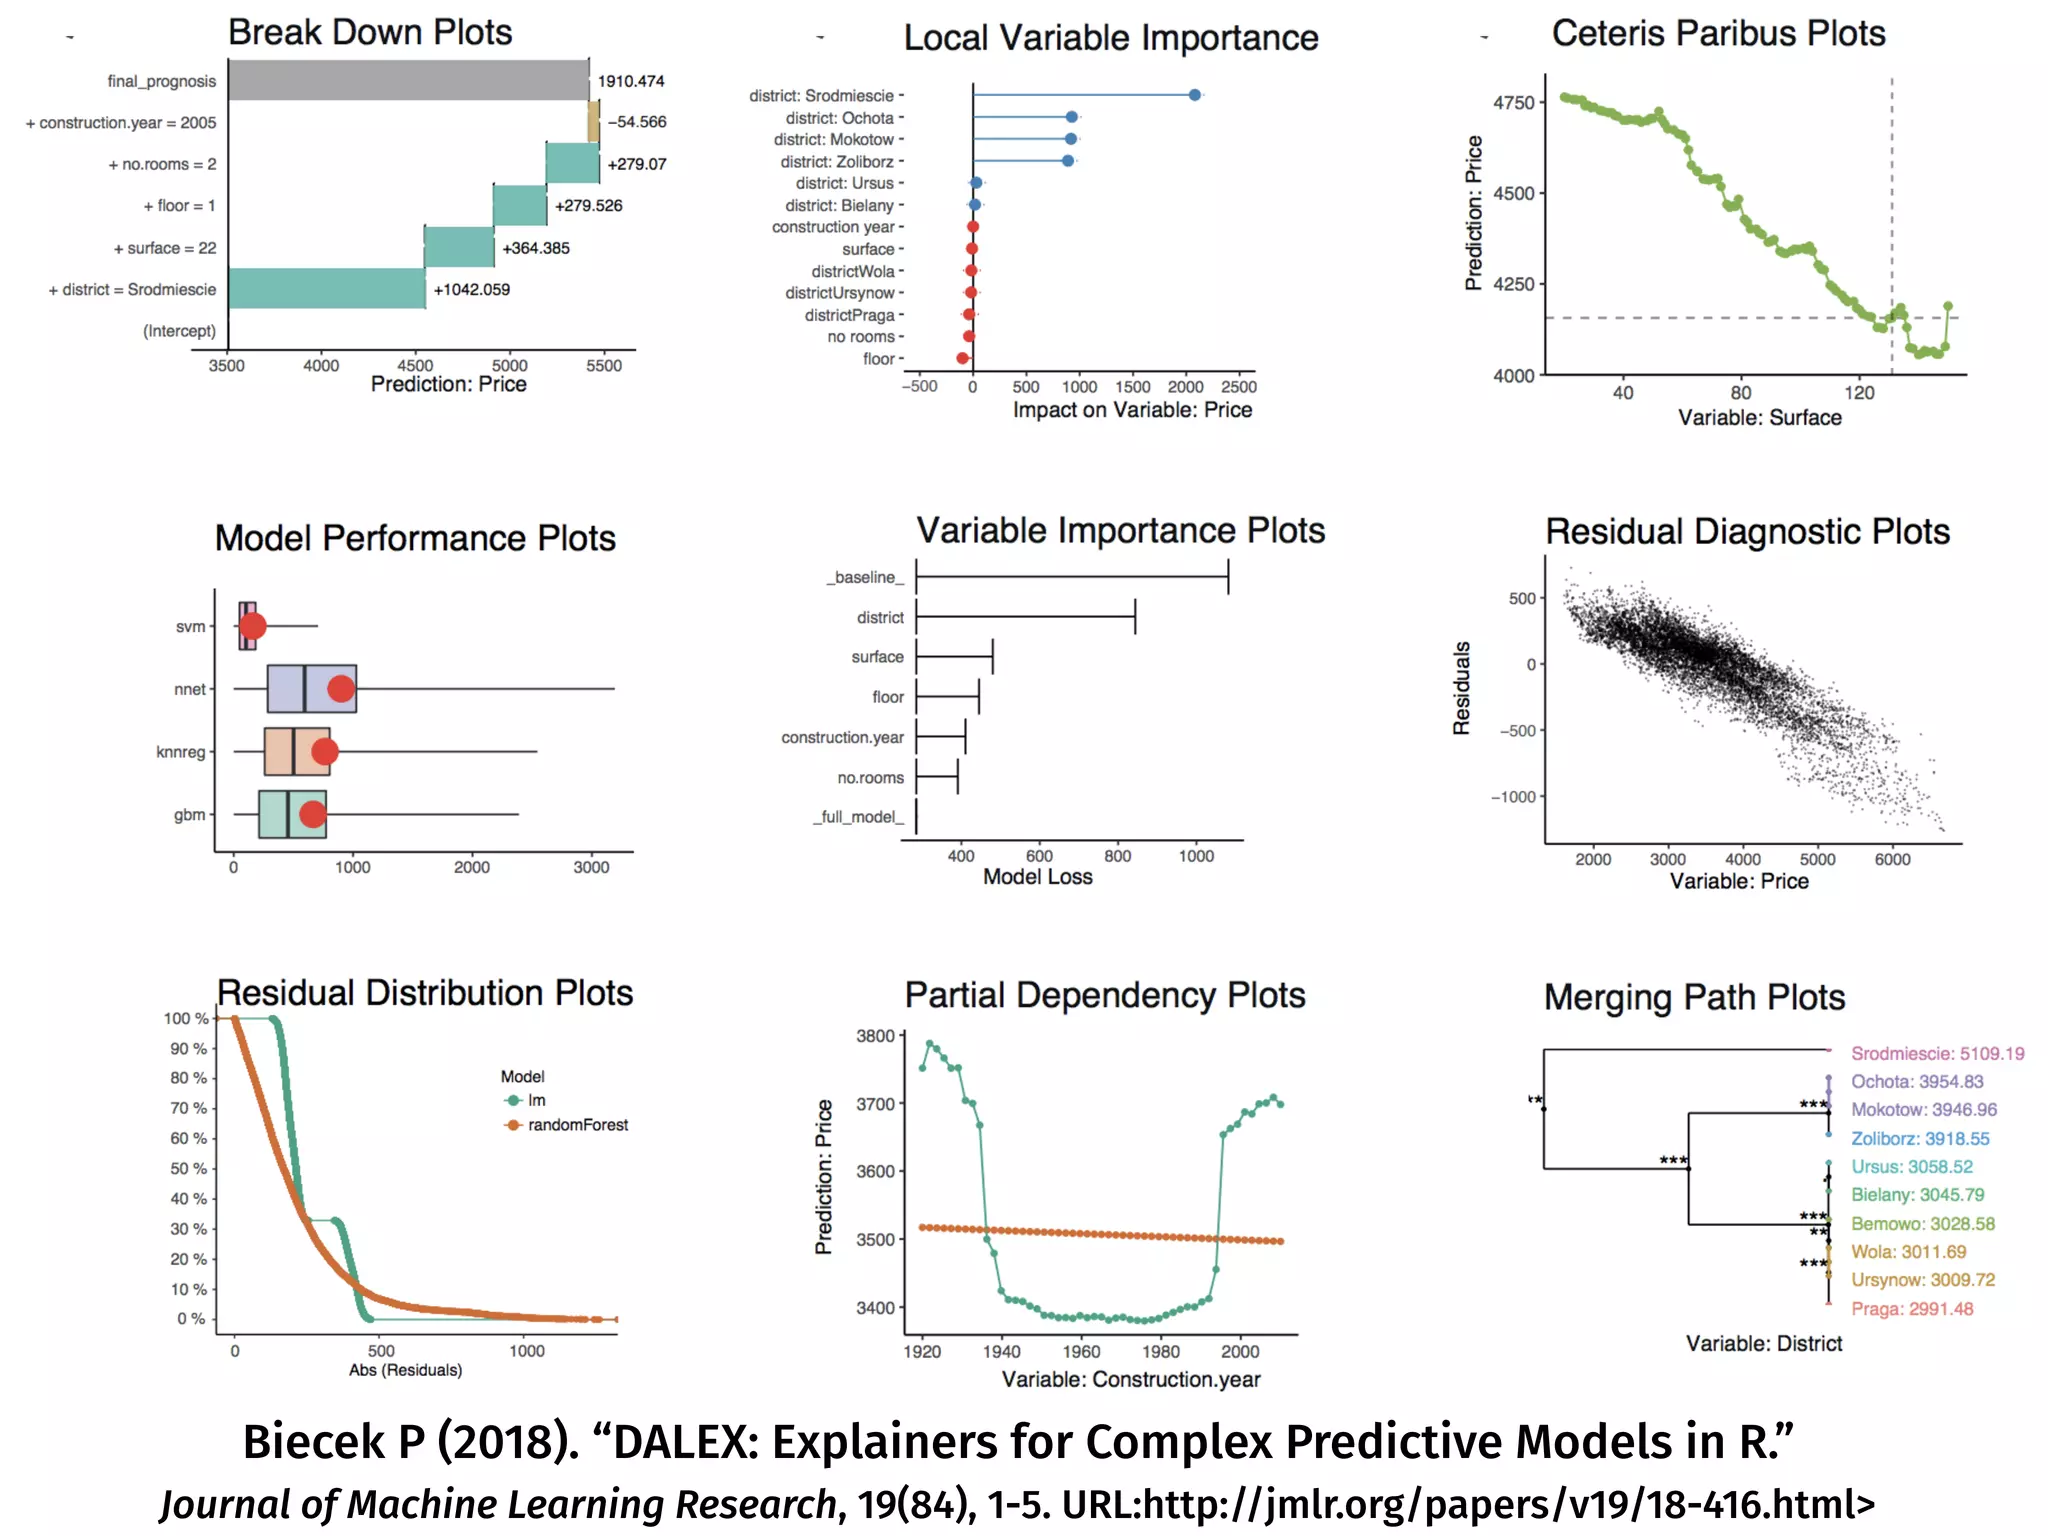

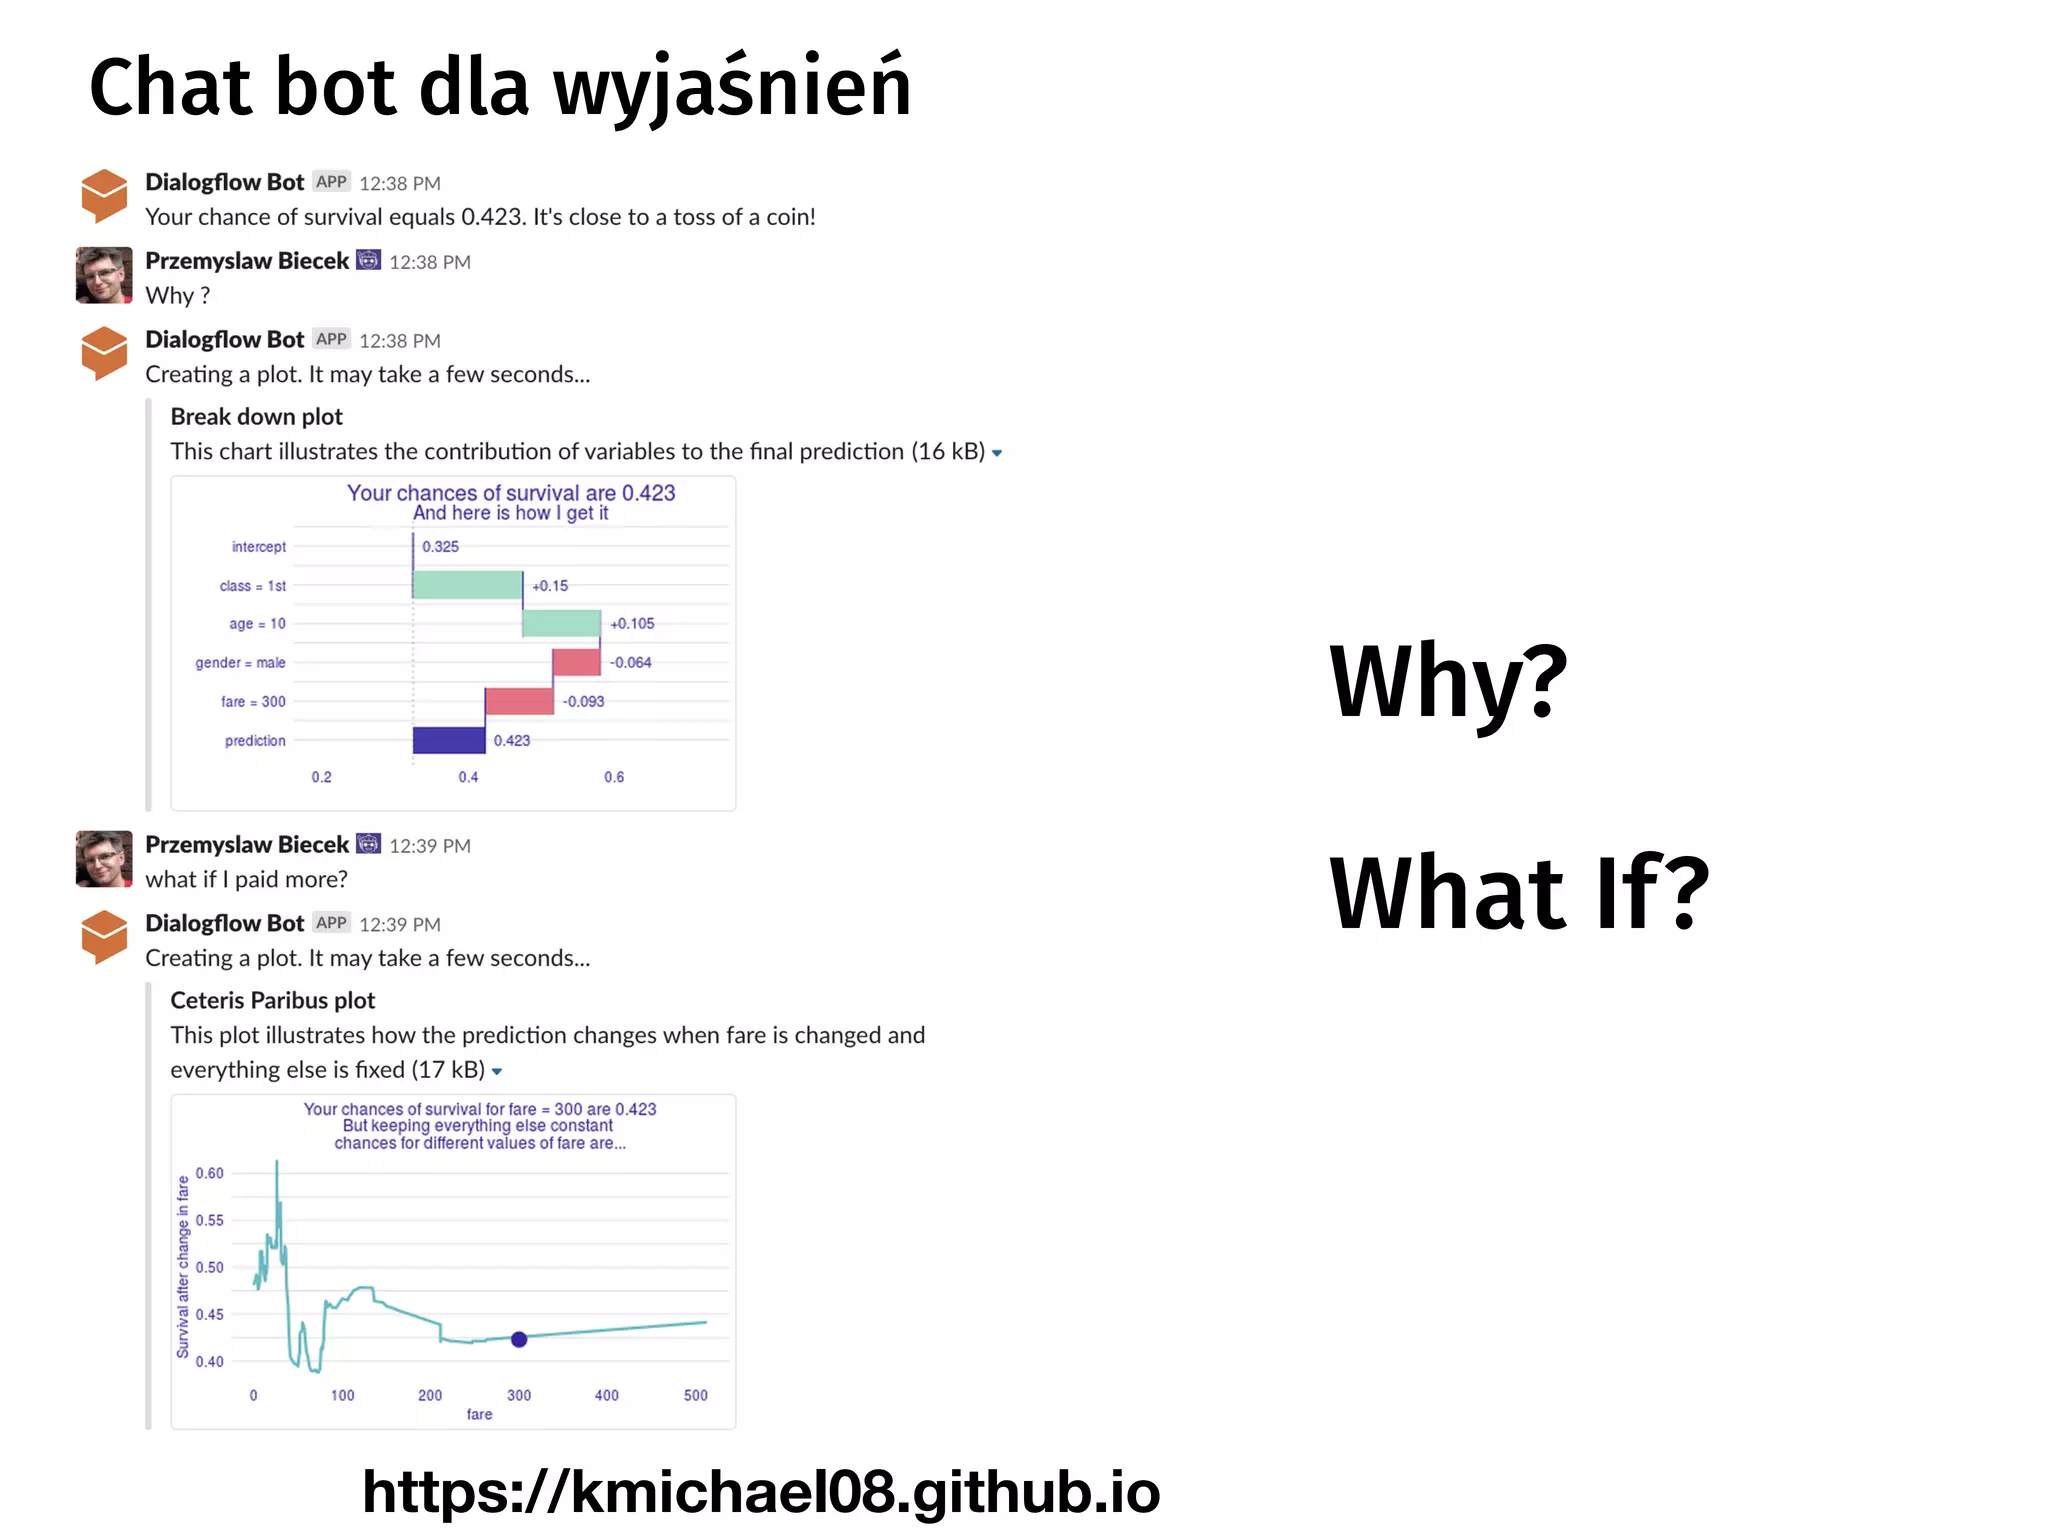


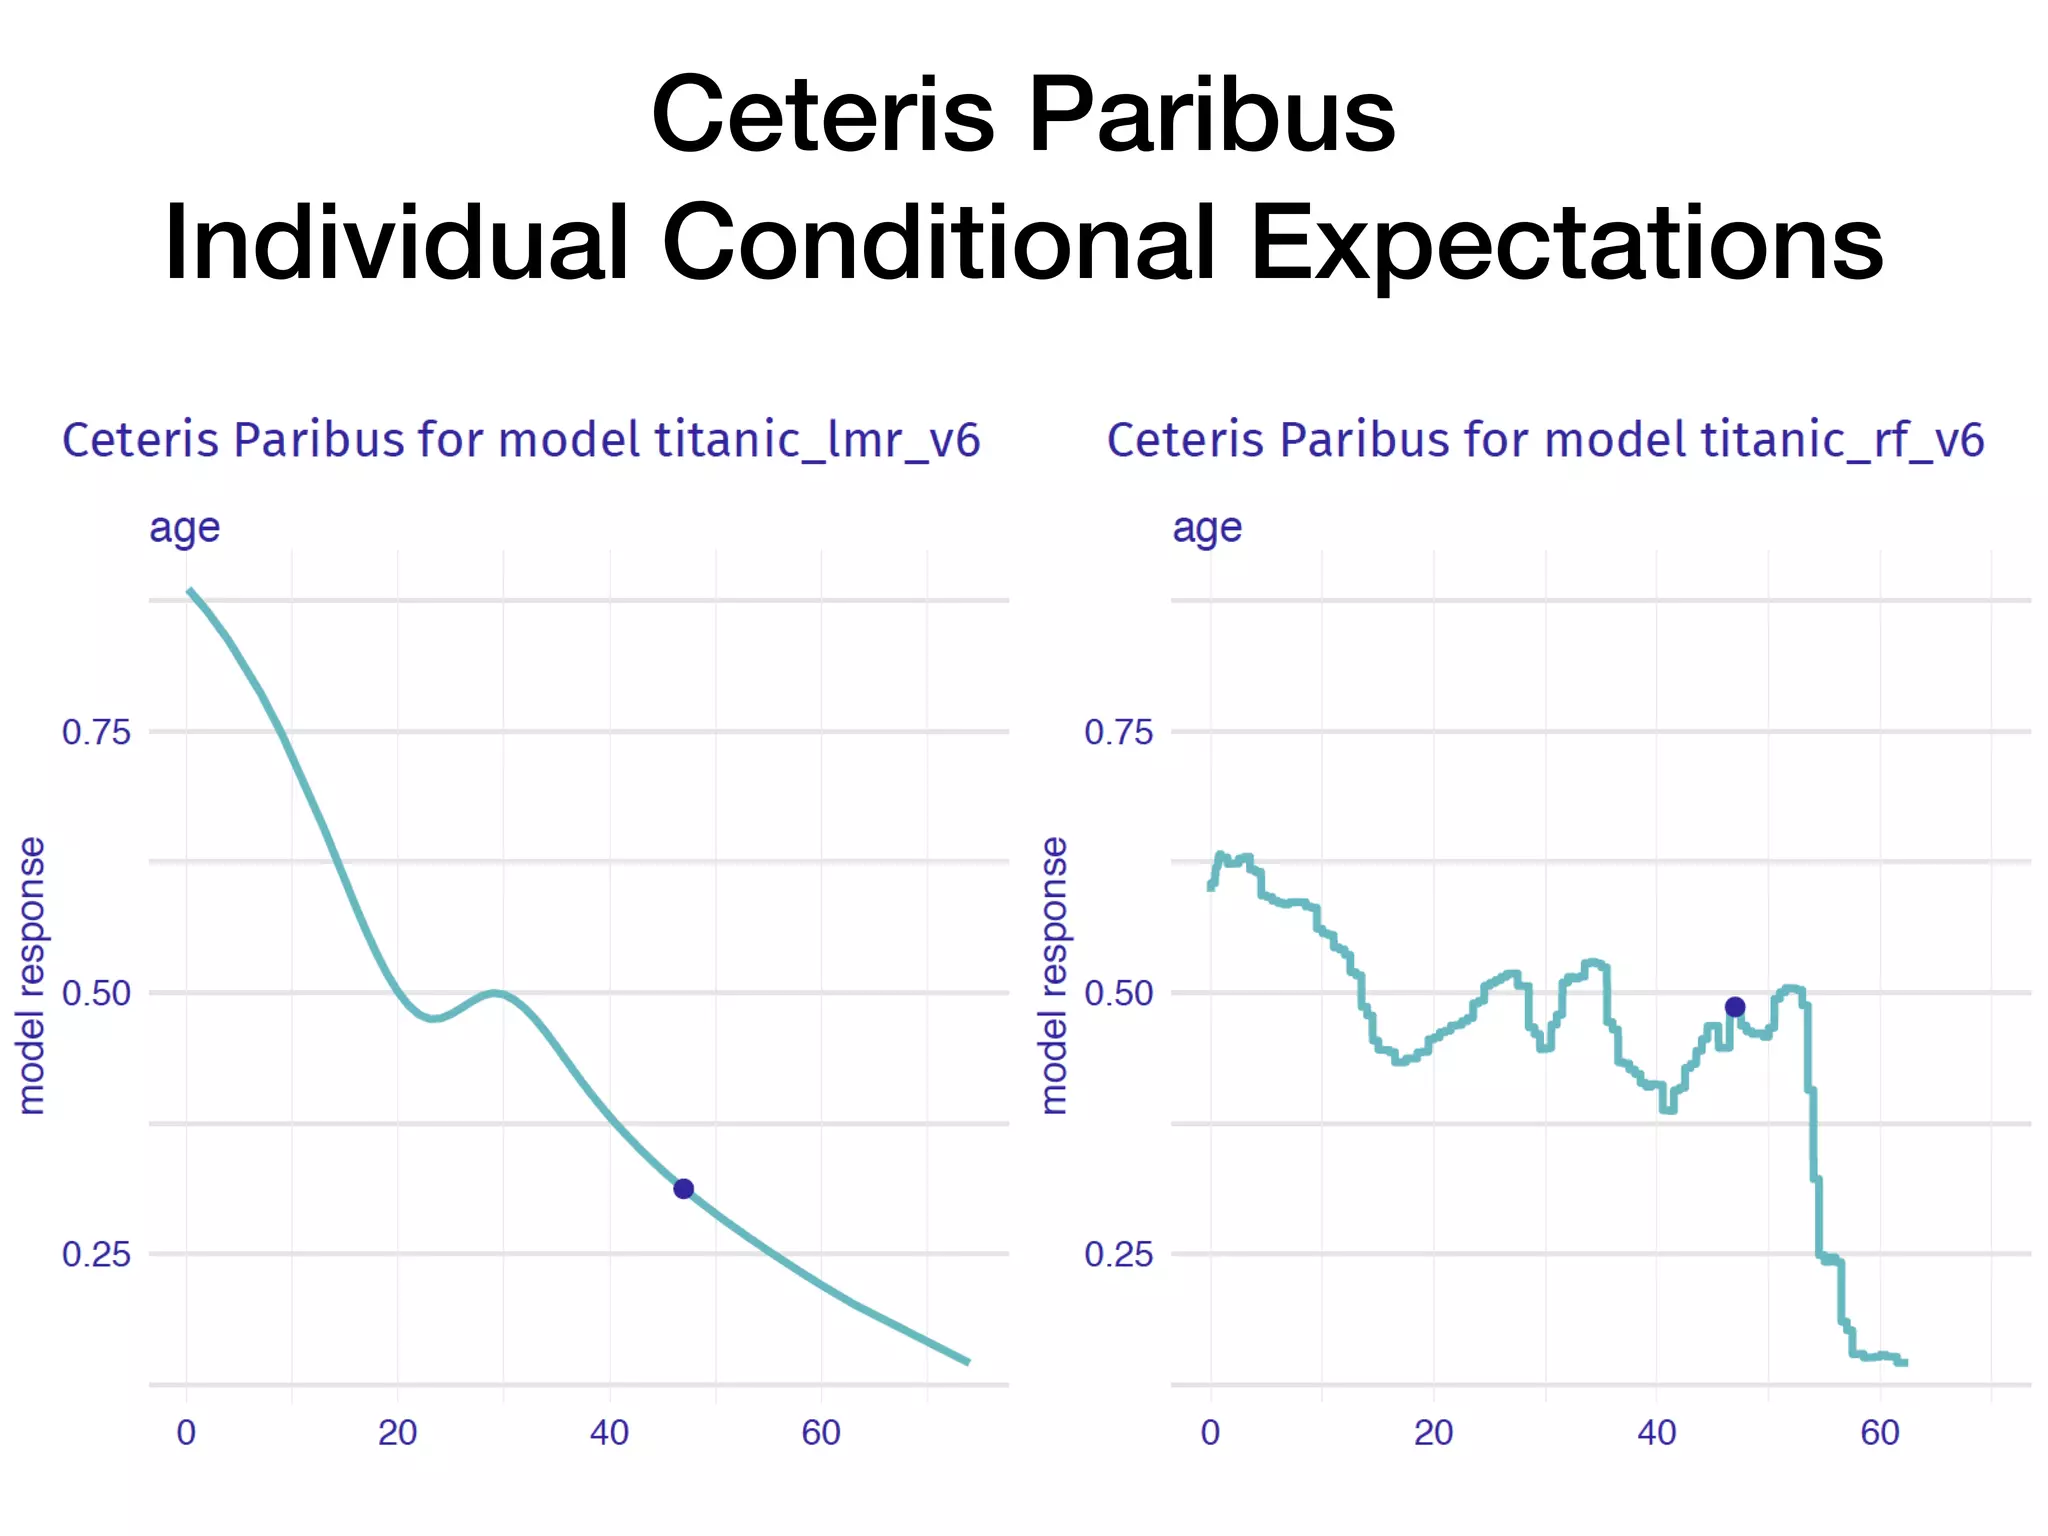

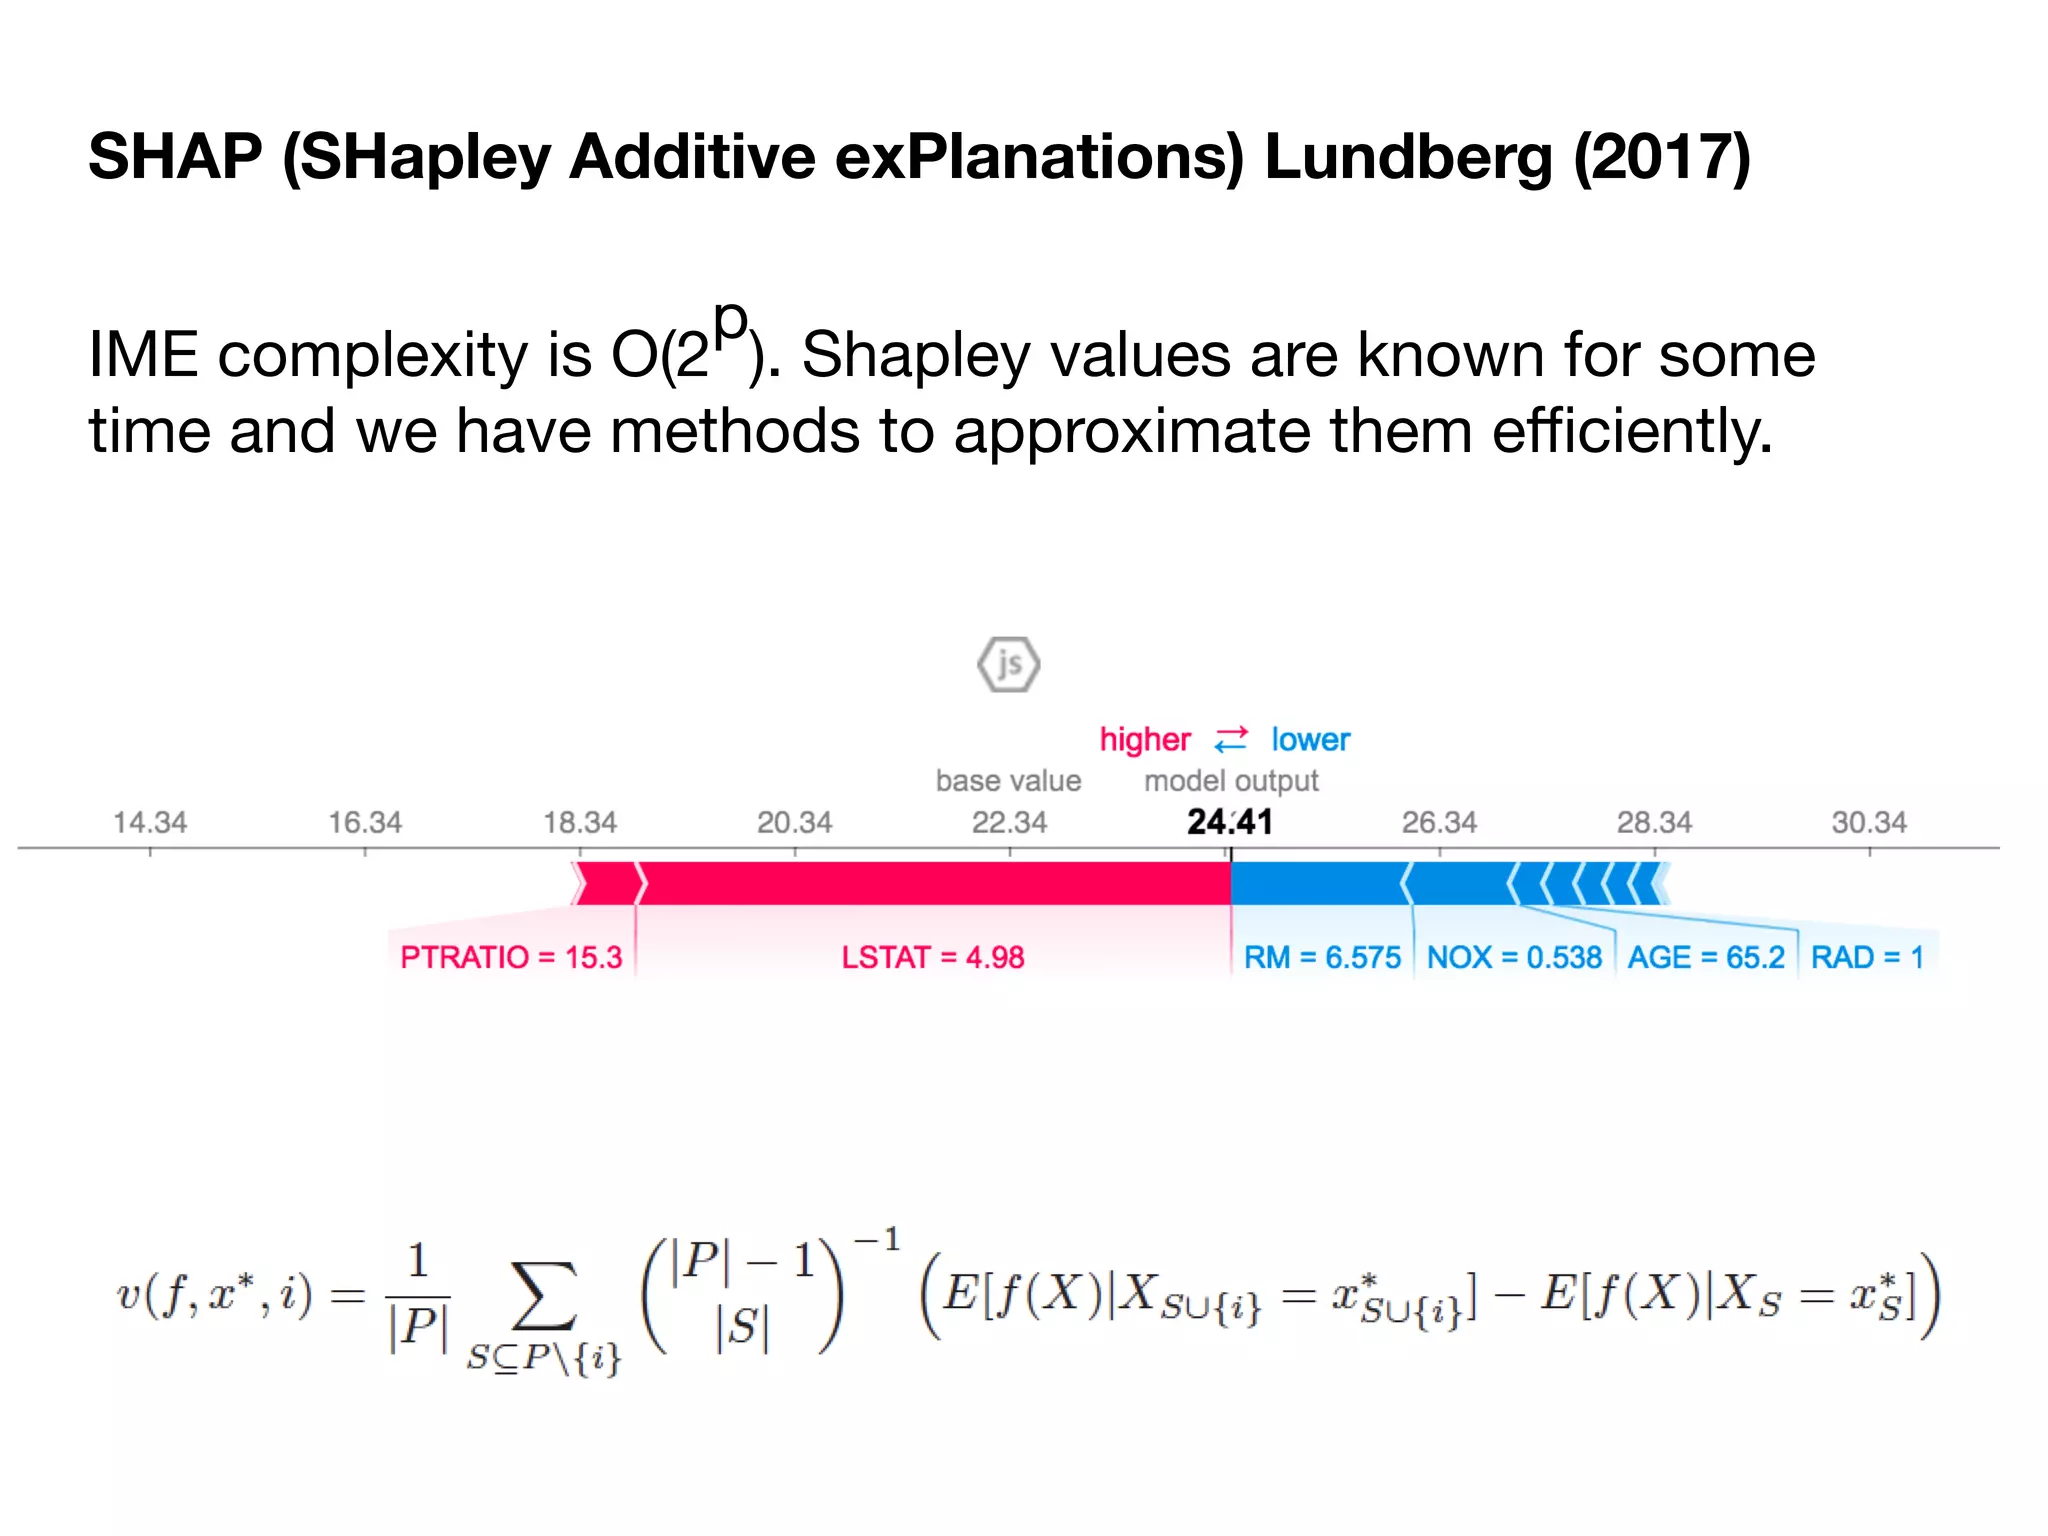


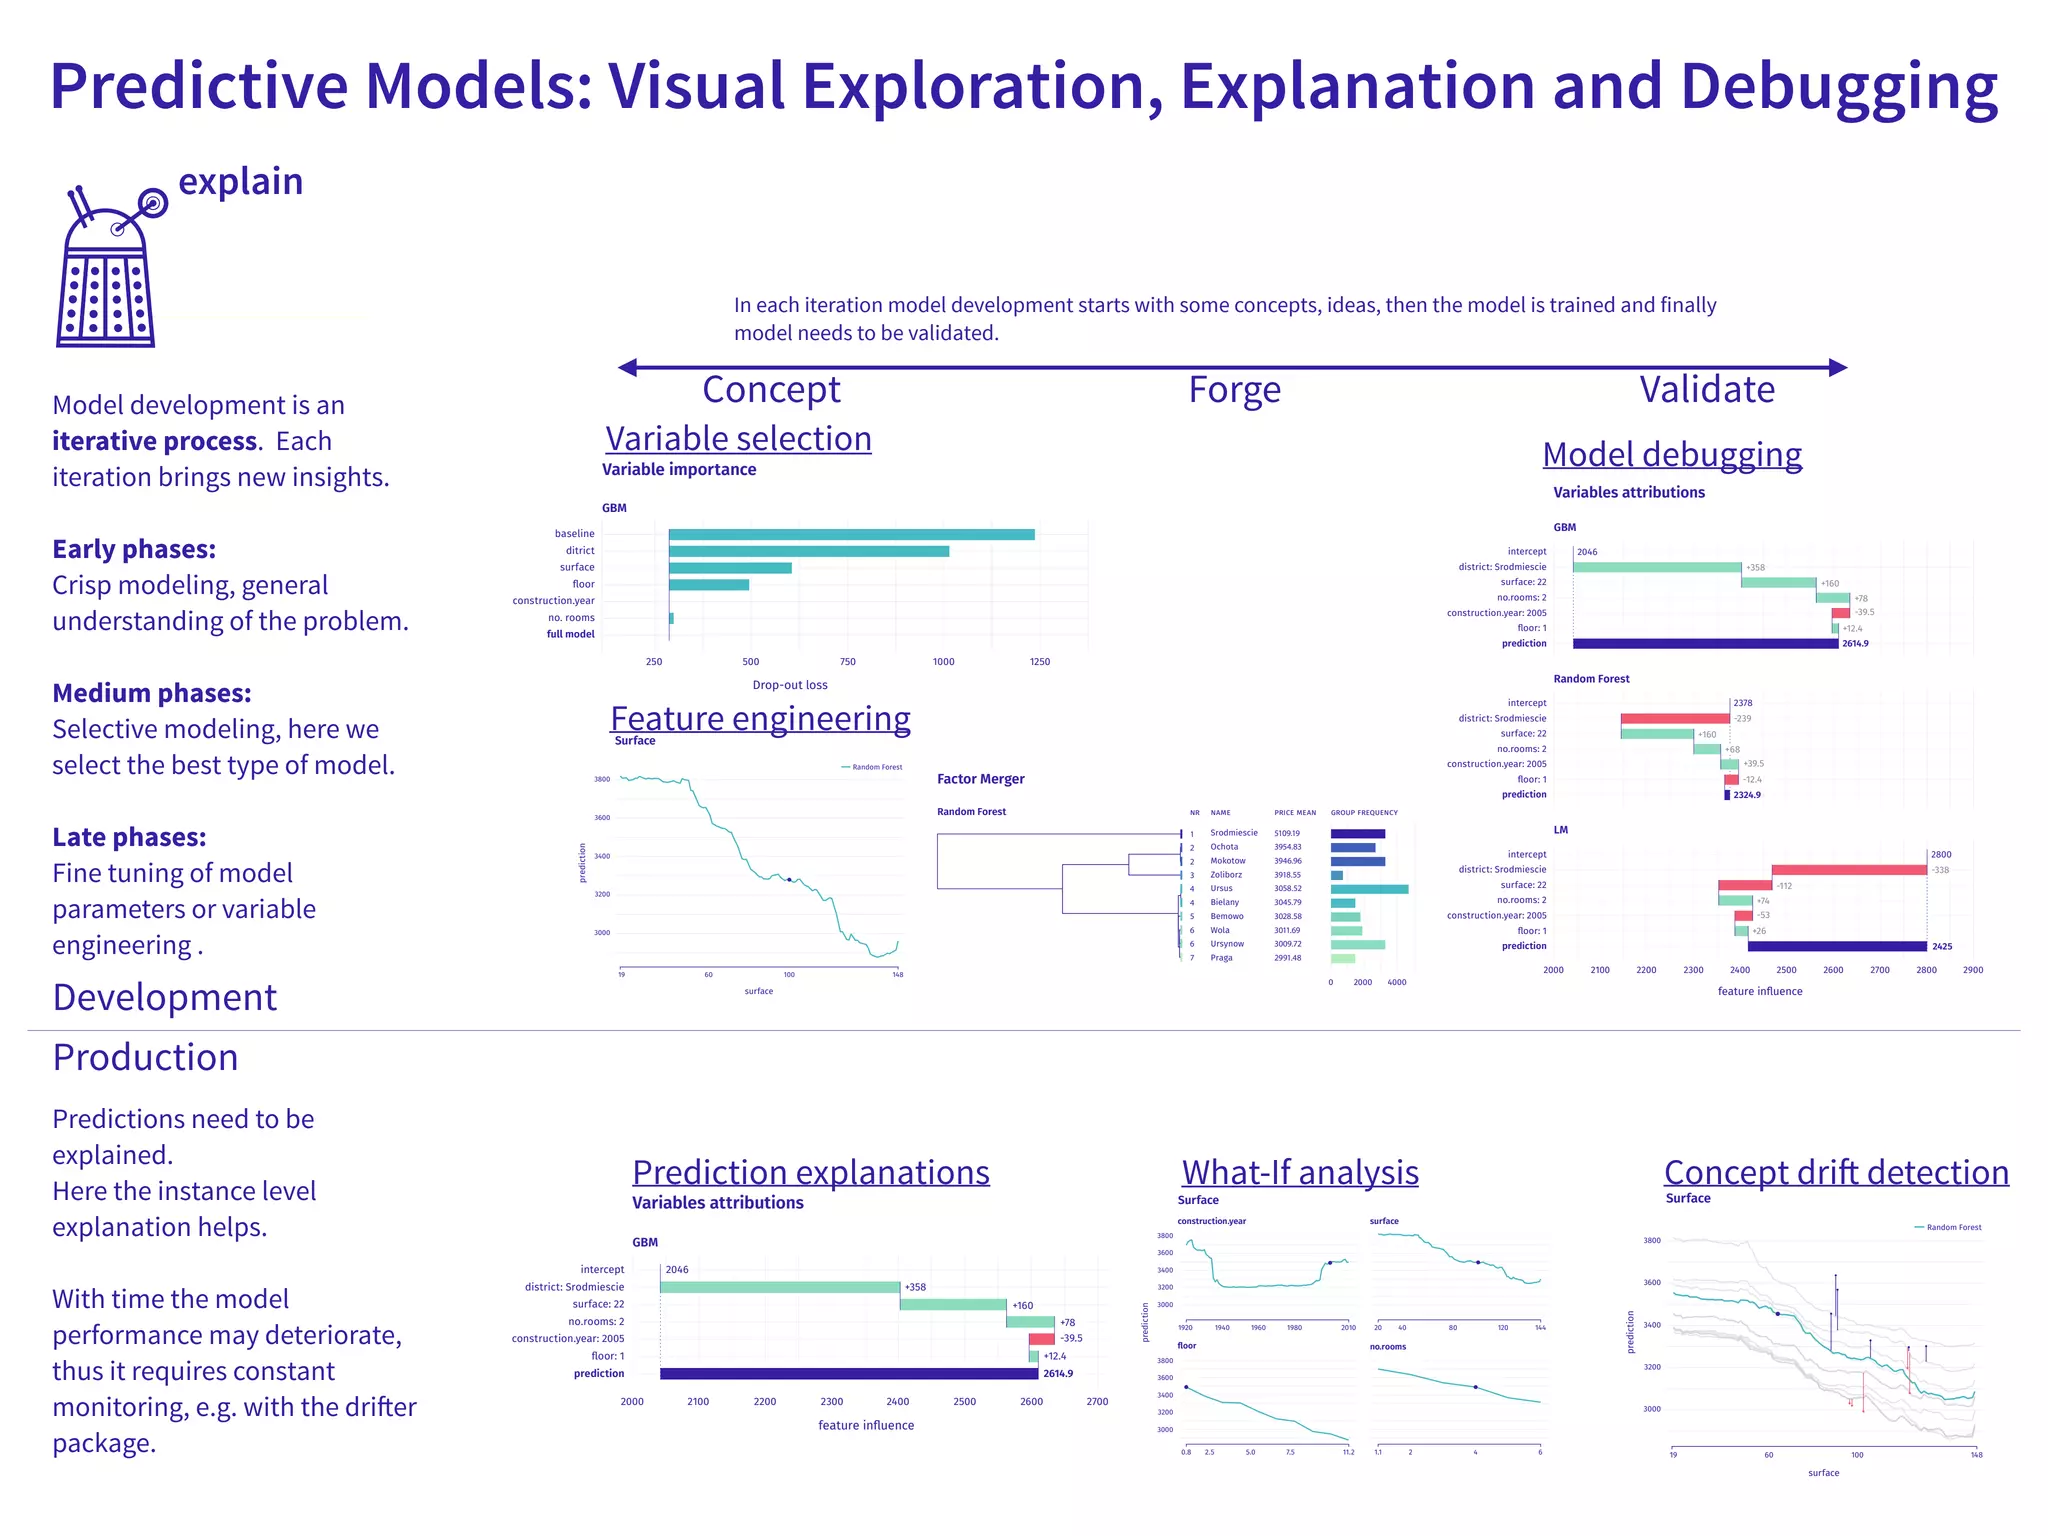

The document discusses the applications and challenges of explainable AI (XAI) and automated machine learning (AutoML) in the context of predictive modeling and algorithmic transparency. It highlights the need for model explanations, the importance of understanding complex machine learning algorithms, and various tools like LIME and SHAP for model interpretability. Additionally, it touches on the societal implications of algorithmic decision-making and the necessity of addressing biases in these systems.