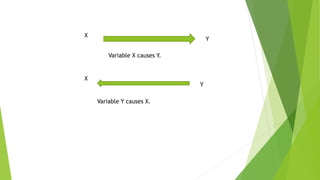
Correlation
Connections between two events or variables
Desmond Ayim-Aboagye, PHD
Events and associations
 Dark skies
 Eclipse of the sun
 Hons of the ambulance
 Rains
 Darkness during day time
 Someone is sick/dead
Events and variables
 Predictability
 Consistent correlations
 Association between two events
 Pattern
In the real world we try to
predict and also detect
correlations.
Event
A
Event B
Varia
ble A
Variable
B
Association/Correlation
?
Association/Correlation?
Correlation: definition
 Correlation refers to whether the nature of association between two (or
more ) variables is positive, negative or zero.
 The values of correlation range between -1.00 and + 1.00
(+, -, 0)
Correlation values/Magnitude
There can be “very strong” correlation ±80 to 1.00
There can be “strong” correlation ±60 to .79
There can be “moderate” correlation ± 40 to .59
There can be “weak” correlation ± 20 to .39
“Very weak” correlation” ± .00 to .19
History
David Hume
-Champion association between
variables
- In psychology and philosophy
- The link between cause and effect
was the most important principle
governing association of ideas
Sir Francis Galton
- The creator of the first correlation
coefficient
- Curious about hereditary
- Chose the letter r to represent his
“index of correlation”
- “two variable organs are said to be
co-related when the variation of
one is accompanied on the average
by more or less variation of the
other, and in the same direction.”
Karl O. Pearson
- Enlarged the mathematical
background and precision of the
index of correlation.
- Pearson product-moment
correlation coefficient or Pearson r
(the Greek letter rho)
- Moment = mean
Correlation and causation
 Correlation does not imply causation
 “Unless we actively intervene into a situation by manipulating variables and
measuring their effect on one another, we cannot assume that we know the
causal order involved.” (Dana, p. 207)
X
Y
Variable X causes Y.
Variable Y causes X.
Y
X
YX
Z
The Third Variable Problem
The association between X and Y is caused
by a third (unknown) variable) variable Z
The Pearson correlation coefficient
Pearson r enables investigators to assess the nature of the association between two
variables, X and Y.
Correlations, then, are based on pairs of variables, and each pair is based on the
responses of one person.
In a conventional correlational relationship, X is the independent variable (predictor)
and Y is dependent variable (criterion)/ measure.
X and Y can represent any number of psychological tests and measures, behaviors, or
rating scales, but variables must be based on an interval or a ratio scale.
The Pearson r
The Pearson r, a correlation coefficient, is a
statistic that quantifies the extent to which two
variables X and Y are associated, and whether the
direction of their association is positive, negative,
or zero.
Participants Extraversion Score (x) Interaction behavior
(Y)
1
2
3
4
5
6
7
8
9
10
20
5
18
6
19
3
4
3
17
18
8
2
10
3
8
4
3
2
7
9
Table 6.1 Extraversion Scores and Interaction Behavior in a Hypothetical Validation Study
Extraversion Higher score indicate higher level of extraversion (range: 1 to 20 )
Interaction Higher number indicates more social contacts made in the 30-minute get-acquainted session (range: 0
to 12)
Extraverts
/Introvert
s
Direction of relationship
Positive correlation
A positive correlation is one where as
the value of x increases, the
corresponding value of Y also
increases.
Similarly, a positive correlation exists
when the value of x decreases, the
value of Y also decreases.
Negative correlation
A negative correlation identifies an
inverse relationship between variables
X and Y – as the value of one
increases, the other necessarily
decreases.
Inverse relationship between two
variables.
Zero correlation
A zero correlation indicates that there
is no pattern or predictive relationship
between the behavior of variables X
and Y.
No discernible pattern of covariation –
how things vary together – between
two variables
Scatter plot
A scatter plot is a particular graph used to present correlational data. Each
point in a scatter plot represents the intersection of an X value with its
corresponding Y value. See your textbook, pp 214 ff. Dana Dunn.
The Pearson r’s relation to Z scores
r=
∑𝑍𝑥𝑍𝑦
𝑁
Where each Z scores from X is multiplied by each Z score for Y, their
products are summed and then divided by the number of XY pairs.
Sum of the Squares :
r =
∑ 𝑋−𝑋‾ (𝑌−𝑌‾)
∑ 𝑋−𝑥‾ 2 ∑(𝑦−𝑦‾)2
SS = ∑x 2-
(∑𝑥)2
Ν
Ssχ = ∑x 2-
(∑𝑥)2
Ν
ssY = ∑x 2-
(∑𝑥)2
Ν
THE CALCULATING FORMULA COVARIANCE OF X AND Y IS :
COVxy = ∑XY -
(∑X)(∑Y)
Ν
COMPUTATIONAL FORMULA
r = =
∑XY−(∑X)(∑Y)
Ν
[∑X2−
(∑𝑥)2
Ν
][∑ Y2−
∑𝑌 2
Ν
]
Using COMPUTATIONAL FORMULA
r = =
∑XY−(∑X)(∑Y)
Ν
[∑X2−
(∑𝑥)2
Ν
][∑ Y2−
∑𝑌 2
Ν
]
r = =
831−(113)(56)
10
[1793−
(113)2
10
][∑ 400−
56 2
10
]
r = =
831−(6,328)
10
[1793−
12,769
10
][400 ∑ −
3,136
10
]
r = =
831− 632.8
[1793−1,276.9] 400−313.6
r = =
198.20
[516.10][86.4]
r =
198.20
44,591.04
r =
198.20
211.1659
r = +.9386 ≅ +.94
The convention is to round the
correlation coefficient to two decimal
places behind the decimal, thus r =
+.94
Table 6.3 Step-by-step calculations for the Pearson r (Raw Score Method) using
Data from Table 6.2
participan
ts
x X2 Y Y2 XY
1
2
3
4
5
6
7
8
9
10
20
5
18
6
19
3
4
3
17
18
400
25
324
36
361
9
16
9
289
324
8
2
10
3
8
4
3
2
7
9
64
4
100
9
64
16
9
4
49
81
160
10
180
18
152
12
12
6
119
162
∑x = 113
∑x2 = 1.793
x‾ = 11.3
Sx = 7.57
N = 10
∑y = 56
∑y2 = 400
x‾y = 5.6
Sy = 3.10
∑XY = 831
Table 6.2 Data prepared for calculation of the Pearson r (Raw Score Method)
Note: Hypothetical data were drawn from Table 6.1; X‾ = Y‾.
r =
∑ 𝑋−𝑋‾ (𝑌−𝑌‾).
𝑆𝑆x.𝑆𝑆y
Computational formula for the mean deviation method
This approach relies on the sum of squares and the covariance of X and X
Important information
In correlational analyses, N refers to the
number of X, Y pairs, not the total
number of observations present.
Determining predictive accuracy
1. Interested in the percentage of variance in one variable within a correlation
that can be described by the second member of the pair.
2. This variability can be known by squaring the r value in r
2
. It is a statistic
known as the coefficient of determination.
Coefficient of determination
 In Personality-SOCIAL BEHAVIOR
EXAMPLE: r value of +94 gives the
value of +88
 r
2
= (r)
2
= (.94)
2
= +.88
 Interpretation
 88% of the variance or the change in
social behavior (Y) can be predicted
by the participants ‘ introverted or
extraverted personalities (i.e., X and
Y relationship)
The coefficient of determination (r
2
)
indicates the proportion of variance or
change in one variable that can be accounted
for by another variable.
Coefficient of non-
determination
 K = 1 - r
2
= 1 - .88 = +.12.
 Interpretation
 12% of the social interaction that took
place in the lab can be explained by
factors other than the extraverted or
introverted personalities of the
study’s participants.
 Always
 r
2
and k together (.+88) + (+.12) =
1.00
Symbolize “k”
The coefficient of non-determination (k, 1-
r
2
) indicates the proportion of variance or
change in one variable that cannot be
accounted for by another variable.

Correlation

  • 1.
    Correlation Connections between twoevents or variables Desmond Ayim-Aboagye, PHD
  • 2.
    Events and associations Dark skies  Eclipse of the sun  Hons of the ambulance  Rains  Darkness during day time  Someone is sick/dead
  • 3.
    Events and variables Predictability  Consistent correlations  Association between two events  Pattern In the real world we try to predict and also detect correlations.
  • 4.
  • 5.
    Correlation: definition  Correlationrefers to whether the nature of association between two (or more ) variables is positive, negative or zero.  The values of correlation range between -1.00 and + 1.00 (+, -, 0)
  • 6.
    Correlation values/Magnitude There canbe “very strong” correlation ±80 to 1.00 There can be “strong” correlation ±60 to .79 There can be “moderate” correlation ± 40 to .59 There can be “weak” correlation ± 20 to .39 “Very weak” correlation” ± .00 to .19
  • 7.
    History David Hume -Champion associationbetween variables - In psychology and philosophy - The link between cause and effect was the most important principle governing association of ideas Sir Francis Galton - The creator of the first correlation coefficient - Curious about hereditary - Chose the letter r to represent his “index of correlation” - “two variable organs are said to be co-related when the variation of one is accompanied on the average by more or less variation of the other, and in the same direction.” Karl O. Pearson - Enlarged the mathematical background and precision of the index of correlation. - Pearson product-moment correlation coefficient or Pearson r (the Greek letter rho) - Moment = mean
  • 8.
    Correlation and causation Correlation does not imply causation  “Unless we actively intervene into a situation by manipulating variables and measuring their effect on one another, we cannot assume that we know the causal order involved.” (Dana, p. 207)
  • 9.
    X Y Variable X causesY. Variable Y causes X. Y X
  • 10.
    YX Z The Third VariableProblem The association between X and Y is caused by a third (unknown) variable) variable Z
  • 11.
    The Pearson correlationcoefficient Pearson r enables investigators to assess the nature of the association between two variables, X and Y. Correlations, then, are based on pairs of variables, and each pair is based on the responses of one person. In a conventional correlational relationship, X is the independent variable (predictor) and Y is dependent variable (criterion)/ measure. X and Y can represent any number of psychological tests and measures, behaviors, or rating scales, but variables must be based on an interval or a ratio scale.
  • 12.
    The Pearson r ThePearson r, a correlation coefficient, is a statistic that quantifies the extent to which two variables X and Y are associated, and whether the direction of their association is positive, negative, or zero.
  • 13.
    Participants Extraversion Score(x) Interaction behavior (Y) 1 2 3 4 5 6 7 8 9 10 20 5 18 6 19 3 4 3 17 18 8 2 10 3 8 4 3 2 7 9 Table 6.1 Extraversion Scores and Interaction Behavior in a Hypothetical Validation Study Extraversion Higher score indicate higher level of extraversion (range: 1 to 20 ) Interaction Higher number indicates more social contacts made in the 30-minute get-acquainted session (range: 0 to 12) Extraverts /Introvert s
  • 14.
    Direction of relationship Positivecorrelation A positive correlation is one where as the value of x increases, the corresponding value of Y also increases. Similarly, a positive correlation exists when the value of x decreases, the value of Y also decreases. Negative correlation A negative correlation identifies an inverse relationship between variables X and Y – as the value of one increases, the other necessarily decreases. Inverse relationship between two variables. Zero correlation A zero correlation indicates that there is no pattern or predictive relationship between the behavior of variables X and Y. No discernible pattern of covariation – how things vary together – between two variables
  • 15.
    Scatter plot A scatterplot is a particular graph used to present correlational data. Each point in a scatter plot represents the intersection of an X value with its corresponding Y value. See your textbook, pp 214 ff. Dana Dunn.
  • 16.
    The Pearson r’srelation to Z scores r= ∑𝑍𝑥𝑍𝑦 𝑁 Where each Z scores from X is multiplied by each Z score for Y, their products are summed and then divided by the number of XY pairs.
  • 17.
    Sum of theSquares : r = ∑ 𝑋−𝑋‾ (𝑌−𝑌‾) ∑ 𝑋−𝑥‾ 2 ∑(𝑦−𝑦‾)2 SS = ∑x 2- (∑𝑥)2 Ν Ssχ = ∑x 2- (∑𝑥)2 Ν ssY = ∑x 2- (∑𝑥)2 Ν THE CALCULATING FORMULA COVARIANCE OF X AND Y IS : COVxy = ∑XY - (∑X)(∑Y) Ν
  • 18.
    COMPUTATIONAL FORMULA r == ∑XY−(∑X)(∑Y) Ν [∑X2− (∑𝑥)2 Ν ][∑ Y2− ∑𝑌 2 Ν ]
  • 19.
    Using COMPUTATIONAL FORMULA r= = ∑XY−(∑X)(∑Y) Ν [∑X2− (∑𝑥)2 Ν ][∑ Y2− ∑𝑌 2 Ν ] r = = 831−(113)(56) 10 [1793− (113)2 10 ][∑ 400− 56 2 10 ] r = = 831−(6,328) 10 [1793− 12,769 10 ][400 ∑ − 3,136 10 ] r = = 831− 632.8 [1793−1,276.9] 400−313.6 r = = 198.20 [516.10][86.4] r = 198.20 44,591.04 r = 198.20 211.1659 r = +.9386 ≅ +.94 The convention is to round the correlation coefficient to two decimal places behind the decimal, thus r = +.94 Table 6.3 Step-by-step calculations for the Pearson r (Raw Score Method) using Data from Table 6.2
  • 20.
    participan ts x X2 YY2 XY 1 2 3 4 5 6 7 8 9 10 20 5 18 6 19 3 4 3 17 18 400 25 324 36 361 9 16 9 289 324 8 2 10 3 8 4 3 2 7 9 64 4 100 9 64 16 9 4 49 81 160 10 180 18 152 12 12 6 119 162 ∑x = 113 ∑x2 = 1.793 x‾ = 11.3 Sx = 7.57 N = 10 ∑y = 56 ∑y2 = 400 x‾y = 5.6 Sy = 3.10 ∑XY = 831 Table 6.2 Data prepared for calculation of the Pearson r (Raw Score Method) Note: Hypothetical data were drawn from Table 6.1; X‾ = Y‾.
  • 21.
    r = ∑ 𝑋−𝑋‾(𝑌−𝑌‾). 𝑆𝑆x.𝑆𝑆y Computational formula for the mean deviation method This approach relies on the sum of squares and the covariance of X and X
  • 22.
    Important information In correlationalanalyses, N refers to the number of X, Y pairs, not the total number of observations present.
  • 23.
    Determining predictive accuracy 1.Interested in the percentage of variance in one variable within a correlation that can be described by the second member of the pair. 2. This variability can be known by squaring the r value in r 2 . It is a statistic known as the coefficient of determination.
  • 24.
    Coefficient of determination In Personality-SOCIAL BEHAVIOR EXAMPLE: r value of +94 gives the value of +88  r 2 = (r) 2 = (.94) 2 = +.88  Interpretation  88% of the variance or the change in social behavior (Y) can be predicted by the participants ‘ introverted or extraverted personalities (i.e., X and Y relationship) The coefficient of determination (r 2 ) indicates the proportion of variance or change in one variable that can be accounted for by another variable.
  • 25.
    Coefficient of non- determination K = 1 - r 2 = 1 - .88 = +.12.  Interpretation  12% of the social interaction that took place in the lab can be explained by factors other than the extraverted or introverted personalities of the study’s participants.  Always  r 2 and k together (.+88) + (+.12) = 1.00 Symbolize “k” The coefficient of non-determination (k, 1- r 2 ) indicates the proportion of variance or change in one variable that cannot be accounted for by another variable.