Conservation Area Designation in the Andes

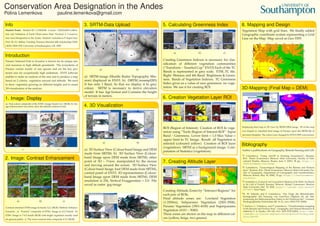
Current poster presents a student assignment on Course: 'GEOG6038 Calibration and Validation of Earth Observation Data'. Study aim is image classification using ENVI GIS and remote sensing data aimed at national park area classification. Study area is Páramo National Park in Ecuador is known for its unique natural resources in high altitude grasslands. The ecosystems of Páramo consist mostly of rare species and are the key protected area for exceptionally high endemism. ENVI software enablesd to make an analysis of the area in 9 (nine) working steps and to produce a map based on 2 criteria: vegetation amount and altitude. Methodology includes following steps: 1) True-colour composite of the ETM+ image, bands 3,2,1; 2) Image contrast enhancement (Enhance-Gaussian); 3) SRTM-Data Upload to derive elevation model; 4) 3D surface visualization; 5) Calculating Greenness Index; 6) Creation Vegetation Layer ROI; 7) Creating Altitude Layer Zones by “Intersect Regions” for each pair of ROIs. Final altitude zones are: Lowland Vegetation (1-2500m), Subparamo Vegetation (2501-3500), Paramo Vegetation (3501-4100) and Superparamo Vegetation (4101 – 5000). These zones are shown on the map in different colors (yellow, beige, two greens) ; 8) Mapping and Design; 9) 3D-Mapping and DEM. The research was done as part of MSc studies at the University of Southampton, UK, autumn 2009.
Recommended

Recommended
More Related Content
What's hot
What's hot (19)
Similar to Conservation Area Designation in the Andes
Similar to Conservation Area Designation in the Andes (20)
More from Universität Salzburg
More from Universität Salzburg (20)
Recently uploaded
Recently uploaded (20)
Conservation Area Designation in the Andes
- 1. Conservation Area Designation in the Andes Polina Lemenkova pauline.lemenkova@gmail.com Info Student Poster. Student ID: 3 23369248. Course: ’GEOG6038 Calibra- tion and Validation of Earth Observation Data’ Practical 3: Conserva- tion Area Designation in the Andes. Student: Lemenkova P. Supervisor: Prof. Dr. E.J. Milton. Funding: Erasmus Mundus MSc Scholarship GEM- L0022/2009/EW, University of Southampton, UK. 2009 Introduction Páramo National Park in Ecuador is known for its unique nat- ural resources in high altitude grasslands. The ecosystems of Páramo consist mostly of rare species and are the key pro- tected area for exceptionally high endemism. ENVI software enables to make an analysis of the area and to produce a map based on 2 criteria: vegetation amount and altitude. We need to show vegetation growing on different heights and to create 3D-visualization of the analysis. 1. Image: Display a): True-colour composite of the ETM+ image, bands 3,2,1 (RGB). b): Im- age enhancement was done, since the default contrast is bad. a) b) 2. Image: Contrast Enhancement a) b) c) Contrast stretched ETM+image In bands 3,2,1 (RGB). Method: Enhance- Gaussian. a): ’Forestry’ composite of ETM+ Image in 4,5,3 bands. b): ETM+ Image in 7-4-2 bands (RGB) with bright vegetation usually used for general public. c): The most common false composite 4-3-2 (RGB). 3. SRTM-Data Upload a) b) a): SRTM-image (Shuttle Radar Topography Mis- sion) displayed in ENVI. b): (SRTM_resampl285) It has only 1 Band, So that we display it In grey colour. SRTM is necessary to derive elevation model. It has .hgt format and Contains the height of terrain in meters. 4. 3D Visualization a) b) a): 3D Surface View (Colour-band Image and DEM made from SRTM). b): 3D Surface View (Colour- band Image upon DEM made from SRTM), other point of 3D – 7view, manipulated by the mouse and moving around the screen. 3D Surface View (Colour-band Image And DEM made from SRTM), control panel of ENVI. 3D representation (Colour- band Image upon DEM made from SRTM). DEM resolution is 256, Vertical Exaggeration = 2.0. File saved as raster .jpg-image 5. Calculating Greenness Index a) b) c) Creating Greenness Indexes is necessary for clas- sification of different vegetation communities (“Transform – Tasseled Cap” ENVI) Each of the TC Bands is represented in grey scale. ETM_TC file. Right: Wetness and 4th Band. Brightness & Green- ness. Bands of Vegetation Indexes. TC Greenness Index gives us a value of zero greenness: no vege- tation. We use it for creating ROI. 6. Creation Vegetation Layer ROI ROI (Region of Interest). Creation of ROI In vege- tation using “Tools–Region of Interest-ROI”. Input Band – Greenness. Lower limit = 1.0 Max Value = upper limit In TC Image. Result: all Vegetation is selected (coloured yellow). Creation of ROI layer (vegetation). SRTM as a background image. Com- putation of Statistics (vegetation). 7. Creating Altitude Layer Creating Altitude Zones by “Intersect Regions” for each pair of ROIs. Final altitude zones are: Lowland Vegetation (1-2500m), Subparamo Vegetation (2501-3500), Paramo Vegetation (3501-4100) and Superparamo Vegetation (4101 – 5000). These zones are shown on the map in different col- ors (yellow, beige, two greens) 8. Mapping and Design Vegetation Map with grid lines. We finally added Geographic coordinate system representing a Grid Line on the Map. Map saved as Geo-TIFF. 3D-Mapping (Final Map + DEM) Displaying final map in 3D view by SRTM DEM image. 3D of the map was draped as classified final image of Paramo upon the SRTM file of elevation (heights). The colors were changed by ENVI (TIFF-conversion) Bibliography Author’s publications on Geography, Remote Sensing and GIS: 1 P. Lemenkova, “Using ArcGIS in Teaching Geosciences”, Russian, B.Sc. Thesis (Lomonosov Moscow State University, Faculty of Edu- cational Studies, Moscow, Russia, June 5, 2007), 58 pp., https : / / thesiscommons.org/nmjgz. 2 P. Lemenkova, “Geoecological Mapping of the Barents and Pechora Seas”, Russian, B.Sc. Thesis (Lomonosov Moscow State University, Fac- ulty of Geography, Department of Cartography and Geoinformatics, Moscow, Russia, May 18, 2004), 78 pp., https://thesiscommons. org/bvwcr. 3 P. Lemenkova, Ecological and Geographical Mapping of the Baltic Sea Region in the Gulf of Finland, Russian, Moscow, Russia: Lomonosov Moscow State University, Mar. 30, 2002, https : / / zenodo . org / record / 2574447, Term Paper. 4 H. W. Schenke and P. Lemenkova, “Zur Frage der Meeresboden- Kartographie: Die Nutzung von AutoTrace Digitizer für die Vek- torisierung der Bathymetrischen Daten in der Petschora-See”, German, Hydrographische Nachrichten 25, 16–21, ISSN: 0934-7747 (2008). 5 I. Suetova, L. Ushakova, and P. Lemenkova, “Geoinformation mapping of the Barents and Pechora Seas”, Geography and Natural Resources 4, edited by V. A. Snytko, 138–142, ISSN: 1875-3728 (2005), http://www. izdatgeo.ru/journal.php?action=output&id=3&lang_num= 2&id_dop=68.