1. Biological Forum – An International Journal 6(2): 19-23(2014)
ISSN No. (Print): 0975-1130
ISSN No. (Online): 2249-3239
Forest Lands Cover Monitoring using the Data Satellite
Seyed Armin Hashemi
Department of Forestry, Collage of Natural Resources, Lahijan Branch
Islamic Azad University, Lahijan, Iran
(Corresponding author : Seyed Armin Hashemi)
(Received 31May, 2014, Accepted 02 July, 2014)
ABSTRACT: Thus, satellite images with capability of massive vision and being repetitive are used at present
as an efficient tool to identify and to control the vegetation. In this study, using supervised classification, land
samples are taken by GPS and classified by ENVI 4.6 software. Manual classification despite being greatly
precise is time intensive and is very expensive. Thus maximum likelihood was used as an adequate technique.
Results of numerical classification of images using this technique with participating various band sets
indicated that in best situation, total accuracy of classification of the image related to 2004 is 0.7598,
respectively and their kappa coefficient is 0.7473, respectively. As well, results indicated that among the
influencing factors on the trend of land use change in the forests of study area, the most important reason of
these changes are residential centers, construction of new outdoor recreational structures, road construction
and other tourism uses. These factors must be considered in the future plans of the area.
Key words: Forest cover, Gisoom forest park, supervised classification, ETM+.
INTRODUCTION
Providing the initial thematic information is the
prerequisite for any planning in the forest sustainable
management. For this purpose, forest cover mapping is
highly considered as the basic information to provide
forestry plane. Since these maps are produced using
various techniques from field operations up to using
aerial images, great time and huget and rigid work
conditions are among the drawbacks to prepare such
maps. Thus it is necessary to use more easy and up to
date techniques for this purpose. Remote sensing
science may be a suitable solution to remove this
problem. Among the tools efficient for environmental
studies and land sciences is utilizing the information
systems technologies most important of which are
remote sensing. Geographic information system (GIS)
and Global position system (GPS) which provided a
huge evolution in the management of land sources
information. According to the importance of natural
resources and forests, it is required to recognize the
sources inside the country and to collect the
comprehensive information related to these resources,
so that planning in Marco level is performed according
to the available potential and resources in the area.
Since the prerequisite for systematic planning and
natural resources sustainable management is
availability of precise, up to date data.
A study titled: “Study on the possibility to map the
beech species using EMT+ sensor's data”, performed
the classification of satellite images with original and
artificial bands derived by scaling, conversion of major
components and combination by performing suitable
processing and reconstruction maximum similarity
classification was performed. Analyzing the major
components was performed based on the bands with
high correlation and on the basis of correlation
calculation in the desired range. Finally, the map
derived from this classification was achieved with 51%
total accuracy. Yuan (2005) analyzed the changes and
classification of land cover in Minnesota region
utilizing the multispectral images of landsat, and
studied the trend of land use changes around the urban
areas. In this study which approximately 7700 km2
area, landsat images relating to 1986, 1991, 1998, and
2002 were used. Maximum likelihood algorithm in the
satellite images classification was including 7 major
bands and 3 bands resulting from teseldcap. Satellite
images were classified to 7 classes including: forest,
agriculture, pasture, urban areas, water, marsh and
stony places and then they were studied.
A result of this study indicates a 70000 hectares
increase of urban areas during 16 years which was
including 75% forest and 13.6% lands converted from
other uses.
2. Hashemi 20
Bonyad (2005) in a study on the classification of
multiband satellite images for inventory and mapping the
land cover to decrease the lack of correlation between
satellite images utilized the major components analysis
technique. Total accuracy in this classification was
evaluated as 80.63%. This conclusion is considered
suitable to classify the land cover in the study area using
major elements analysis.
II. MATERIALS AND METHODS
Study area: Forest park of Gisoom covers an area of
1058h1. Length of this area is about 4300m2 and its with
is up to 2500m2. This is located as a forest strip remained
from Talesh forest area in the North western Guilan
provine 42 Km2 far from major road of Anzaly port to
Astara.
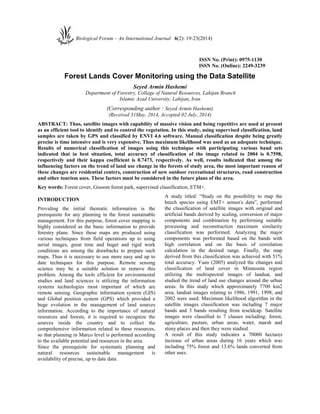
Fig. 1. View of study area.
Eastern part with about 887 h areas is assigned to the
forest park (Fig. 1). Western part of Gisoom forest with
approximately 171h area has been devotes for forest
reserve. Image used in present study is the ETM+ images
of satellites 2007. ETM+ sensor was launched by landsat
7 and was placed in the desired orbit. It has 8 bands.
location resolution ability of all bands expect for 6 and 8
is 30×30 m and resolution ability of band 6 (thermal
band) was 60 × 60 and for band 8 which is a
panchromatic band is 15 × 15 m. in the operation of
geometric correction of images utilized was obtained
along the X and Y axis as 0.96 and 0.83, respectively.
Also RMSE error for images of 2007 was achieved
along the axis x and y as 0.58 and 0.72, respectively.
This was acceptable. In both stages, polynominal
transformation and nearest neighbor techniques were
used for repeated sampling. This technique is the most
common technique for repeated sampling. Among the
most important merits of this technique is its rapid
performance, and transmission of major numeric figures
and lack of production of new numeric figures
(Mehrabany, 2000). As well to perform atmospheric
corrections, since the values recorded as pixel values in
the remote sensed images differ from real values of
reflection and it is required to deduct these values from
real values of spectral reflection, thus water coverage
value (taking the fact that water coverage value must be
zero) is deduced from a. The image bands as
atmospheric effect. In remote sensing data, initial
calculation of some statistic indices is necessary and
useful.
Processing: Image classification: In other words
variance matrix and mean vector which in turn define the
variance and correlation of spectral values are used. In
general, in the technique of using maximum likelihood,
elliptical surfaces will identical likelihood lines or curves
are projected which are displayed in the picture.
3. Hashemi 21
Studied elliptical surfaces define the dependency status of
a pixel to a specific spectral group, that is, variance and
correlation statistic factors are used. For example, pixel a
in the figure are belonged to the group class (0) according
to the higher likelihood and correlation intensity.
Selection of classes: In this step, classification classes
were selected using the available maps of study area and
consulting the related experts.
Accuracy of classification maps was evaluated in 2007
using mixed variance- covariance matrix (Stehman 2004),
after classification and derivation of forest land use layers
from ETM+ images. In this study, total accuracy and
kappa coefficient was used to evaluate the provided
layers. In fact, half of land terrain data derived from
various area in their field operation or from visual
interpretation using high resolution images and available
maps were used in the classification training phase.
The other half of these data was used in supervision and
classification precision evaluation phase. The reason to
use this technique of land terrain utilization was to
prevent optimistic results of evaluation.
Diameter of this matrix consisting the number of pixels
correctly classified and the elements outside of the matrix
in the rows displays the pixels not being correctly
classified which during the classification incorrectly
removed from the major class and were allocated to other
classes. These errors are also called errors of omission or
exclusion. Accuracy of classification of each class is
achieved through dividing the number of correctly
classified pixels (in diameter) on the number of control
pixels (sum of the row) of each class which also is called
producer's accuracy. Elements outside the matrix diameter
in the rows display the land terrain pixels. This reliability
is called user's accuracy (Table 1).
Table 1: Total precision in the land use in 2007.
Producer's Accuracy (%) User Accuracy (%) Classes
0.71 0.68
0.74 0.75 Road
0.87 0.63 Forest Mix
0.74 0.89 Building
0.72 0.70
0.80 0.75
0.70 0.81 AlnusForest
RESULTS AND DISCUSSION
Results of numerical classification of images by using
maximum likelihood classifier and by participating
various band sets indicated that in best conditions, total
accuracy of image classification for 2007 is achieved as
0.7247, respectively and kappa coefficient is 0.7473
respectively (Table 2, Table 3). By refereeing and
comparing to the references such as, Dellepiane and
smith (1999), Lefsky and Cohen (2003), Stehman (2004)
and Sedighy (2001) where total accuracy and kappa
coefficients larger than 0.7 is mentioned as very good
and smaller than 0.4 is considered as poor, results
obtained through land use classification using satellite
images had a good accuracy related to the produced
information in respect of every landuse, total accuracy
and kappa statistics.
Comparing the current and past land use of forests in the
study area indicates that the forests dimension in the area
Pinus
Forest
Carpinus
forest
Parrotia
forest
had a decreasing trend during 2007, which will be
illustrated separately in various species. Slope rate didn't
influence on the forest cover use change since in the
study area, slope is maximally 10% and is not effective
in occurrence of earthquake and decrease in the forest
area.
Several forest cottages in the park area based on various
factors such as population growth rate and also
colonization and tourism rate have disturbed the forest
ecosystem and landaus change. For example, expansion
of recreational camps, parking lots, race tracks and
development of connective roads which were
accompanied to utilization of heavy machines caused
that the trend of forest cover change expanded during the
study period. This had a great influence on destruction of
other ecosystems relating to the forest and increase of
soil erosion which is consistent to the results of Razaey
(2005).
Table 2: Kappa coefficient and total precision of ETM+ picture in 2007.
Kappa coefficient (%) Total precision
0.747 0.759
4. Hashemi 22
Fig. 2. Final classification map, 2007.
Table 3. Distribution of landuse levels for years 2007.
Images of 2007 Land class
Area (hectares )
31.2 Pinus Forest
Carpinus
Forest
110.5
450.2 Alnus Forest
Parrotia
Forest
202.8
162.5 Road Forest
80.2 Mix Forest
Building
Forest
20.4
1058 Total
As dimensions of the road and constructions (parking
lot, cottage, race track, etc) classes have increased.
Increased dimension of these land uses was accompanied
to decreased dimension of other land uses. Destruction
and land use change may occur due to the factors such as
draught, fire, flooding, volcanism and anthropologic
activities such as animal pasturing, expansion of urban
areas, agricultural lands and how to manage the natural
resources. Finally, after comparing the prepared map and
the land use map of the area, it can be concluded that
outputs of years 2007 have a higher accuracy.
5. Hashemi 23
ACKNOWLEDGEMENT
I would like to express my gratitude toward of Islamic
Azad University –Lahijan Branch for their kind co-operation
and encouragement and finance support which
help me in completion of this project.
REFERENCES
Aminy, Mohamad Rashid. (2000). Study on the trend of
changes in the forest spam and its relationship
with physiographic and anthropologic factors
using satellite images and GIS, thesis of Master
of Science, Agriculture and Natural resources,
University Goran, p.77.
Darvish Sefat, A. (2000). Introduce of remote sensing,
Isfahan Industrial University, Natural resources
faculty. Isfehan publisher. pp281.
Dellepiane, S.G. and Smith, P.C. (1999). Quality
assessment of image classification algorithms
for, land cover mapping: A review and a
proposal for a cost based approach.
International J. Remote Sensing, 20: 1461-
1486.
Lefsky, M.A. and Cohen, W.B. (2003). Selection of
remotely sensed data, In M.A. ulder and S.E.
Franklin (Eds), Remote Sensing of Forest
Environments: Concepts and case studies,
pp.25-34. (Boston: Kluwer Academic
Publishers).
Mehrabany, Z. (2000). Study on the changes of forest
stacks in the western kordestan province using
the satellite data, thesis of master of sciences,
Guilan university p126.
Salmanmahiny, A., Kamyab, H. (2009). Applied remote
sensing and GIS with Idrisi. Mehr Mahdis
Publication. Tehran. P 582.
Rezaey, B. Rosta Zadeh, H. (2008). Study and
evaluation of the trend of change in forest span
using remote sensing and GIS (case study of
Arasbaran forests, 1987-2005). Geographic
research, 6: 143-159.
Sedighy, M.R. (2001). Classification of water erosion
risk using ICONA model based on RS & GIS
technologies (case study: Shiraz Tang Sorkh
catchment area), thesis of master of sciences,
Tehran science and Research university. pp.98.
Stehman, S.V. (2004). A critical evaluation of the
normalized error matrix in map accuracy
assessment. Photogrammetric Engineering and
Remote Sensing, 70: 743-751.