1. Use of G-LiHT imagery for land cover mapping
Kristen Brewster1, Ran Meng2, Shawn Serbin2
1Department of Environmental Science and Biology, State University of New York College at Brockport, Brockport, New York 14420
2Environmental and Climate Sciences Department, Brookhaven National Laboratory, Upton, New York 11973
This project was supported in part by the U.S. Department of Energy, Office of Science, Office of
Workforce Development for Teachers and Scientists (WDTS) under the Science Undergraduate
Laboratory Internships Program (SULI). Thank you also to Bruce Cook and his team at NASA
Goddard Space Flight Center (GSFC), for providing us with the G-LiHT data.
Background
Materials & Methods
Results
Conclusions and the Future
Acknowledgements
Hyperspectral Imaging (HSI) measures the solar
radiation reflected off of surfaces in narrow, continuous
spectral bands. Using this data, we can accurately and
repeatedly separate vegetation from other materials
(such as soil or pavement) as well as quantify the
species composition of a landscape and the foliar
physiological traits such as leaf mass per area (LMA) or
nitrogen which comprise these species (Figure 1).
Imagery
A subset of NASA Goddard’s LiDAR, Hyperspectral
and Thermal (G-LiHT) airborne imager data that was
acquired from a Cessna 206 aircraft flown over
Brookhaven National Laboratory (BNL) on June
15th,2015. The data has both high spatial (~1 m) and
spectral (between 1.5 to 5.0 nm, by 114 bands)
resolution.
Image classification
We used spectral signatures (Figure 2) of six cover
types to define the resulting map classes at BNL.
Within the ENVI software environment we used two
supervised classifications approaches, Spectral Angle
Mapper (SAM) and Maximum Likelihood (ML), to
generate the final classification maps.
Field measurements
To characterize in-situ conditions we recorded
species, crown height, tree condition, position, and
diameter at breast height (DBH) of each
individual/plant, as well as the plot center location
(Figure 3).
Map Validation
We overlaid our field data onto our classified maps
(Figures 4 & 5) and calculated within-class and overall
classification accuracy for the vegetation types (Tables
1 & 2).
With high resolution data, such as G-LiHT, it appears spectral angle mapper produces a more
coherent and accurate classification map. Maximum Likelihood may be a better option for data at
lower spatial and spectral resolutions, such as Landsat. However, using more pixels per Region of
Interest (ROI) and separating some classes into sub-classes may increase the accuracy of a
Maximum Likelihood classification, and reduce confusion from “mixed pixels”.
Future studies should consider combining hyperspectral data with LiDAR observations, which
provide 3D structural information. Using both the spectral information together with the detailed
structural information should enable additional separation of vegetation types with similar spectral
signatures but different structural characteristics. This combination of data could also facilitate the
mapping of successional state, forest status or disturbance.
Figure 2. G-LiHT image spectra for the six cover classes used in the supervised classifications.
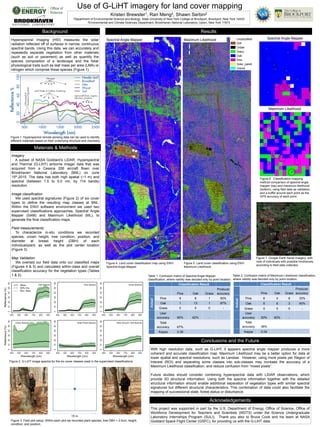
Figure 4. Land cover classification map using ENVI
Spectral Angle Mapper.
Figure 5. Land cover classification using ENVI
Maximum Likelihood.
Figure 6. Classification mapping
method comparison of spectral angle
mapper (top) and maximum likelihood
(bottom), using field data as validation,
and a buffer around each point as the
GPS accuracy of each point.
Figure 7. Google Earth Aerial Imagery, with
note of individuals with possible hindrances,
according to field data collected.
15 m
Classification Result
Pine Oak Grass
Producer
accuracy
Actual
Pine 9 8 1 50%
Oak 1 13 1 87%
Grass 0 0 0 -
User
accuracy 90% 62% -
Total
accuracy 67%
Kappa 0.39
Classification Result
Pine Oak Grass
Producer
accuracy
Actual
Pine 6 4 8 33%
Oak 6 6 3 40%
Grass 0 0 0 -
User
accuracy 50% 60% -
Total
accuracy 36%
Kappa 0.04
Table 1. Confusion matrix of Spectral Angle Mapper
classification, where validity was decided only by point location.
Table 2. Confusion matrix of Maximum Likelihood classification,
where validity was decided only by point location.
Spectral Angle Mapper Maximum Likelihood Spectral Angle Mapper
Maximum Likelihood
Figure 1. Hyperspectral remote sensing data can be used to identify
different materials based on their underlying structure and chemistry.
Figure 3. Field plot setup. Within each plot we recorded plant species, tree DBH > 2.5cm, height,
condition, and position.