
Recommended
More Related Content
What's hot
What's hot (20)
Similar to Project managemen PERT VS CPM
Similar to Project managemen PERT VS CPM (20)
More from PadamNepal1
Recently uploaded
Recently uploaded (20)
Project managemen PERT VS CPM
- 1. ‘TRIBHUVAN UNIVERSITY’ DEPARTMENT OF PUBLIC ADMINISTRATION CAMPUS PRESENTATION SUBMITED BY: PADAM NEPAL 029/074 6TH SEM SUBMITTEDTO: SALINA LAMICHHANE LECTURER PROJECT MANAGEMENT PUBLIC ADMINISTRATION CAMPUS
- 2. TABLE OF CONTENT Background Network diagram PERT INTRODUCTION FEATURES COMPONENTS OF PERT NETWORK STEPS IN PERT FIGURES TABLES IMPORTANT NOMENCLATURE ADVANTAGES AND DISADVANTAGES CPM HISTORY INTRODUCTION COMPONENTS STEPS ADVANTAGES DISADVANTAGES CONCLUSION
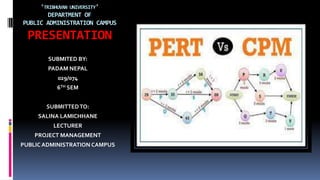
- 4. NETWORK DIAGRAM CONCEPT NETWORK DIAGRAM Project management tools use for project planning Refers as ‘’Arrow Diagram’’ Uses arrows to: connect activities Represents precedence Interdependencies betn activities
- 5. PERT INTRODUCTION The Project Evaluation and ReviewTechnique, commonly abbreviated PERT, is a statistical tool, used in project management. It was developed for the U.S. Navy Special Projects Office in 1957 to support the U.S. Navy's Polaris nuclear submarine project.An early example was, it was used for the 1968Winter Olympics in Grenoble, France.
- 6. FEATURES OF PERT(key points) It is network analysis technique Estimates project duration when there is high degree of uncertainty PERT uses probabilistic time estimates PERT utilize three time estimates (optimistic, expected (Most Likely), and pessimistic) and no costs for each activity. It is used more in projects where time is the major factor rather than cost. It is applied to very large-scale, one-time, complex, non- routine infrastructure and Research and Development projects.
- 7. COMPONENT OF PERT NETWORK PERT NETWORK COMPONENTS EVENT ACTIVITIES CRITICAL PATH Circle arrows most time
- 8. Steps in PERT Following are the steps in PERT IDENTIFYTHE SPECIFIC ACTIVITY AND EVENTS DETERMINE THE PROPER SEQUENCE OFTHE ACTIVITIES CONSTRUCT A NETWORK DIAGRAM ESTIMATETHETIME REQUIRE FOR EACH ACTIVITY DETERMINE THE CRITICAL PATH UPDATE PERT CHART ASTHE PROJECT PROGRESS
- 9. Figures Fig: probabilistic time estimate in PERT
- 10. FIGURES
- 11. TABLE Activity Predecessor Time estimates Expected time Opt (o) Expected (m) Pess (p) te = (o + 4m + p) ÷ 6 A — 2 4 6 4.00 B — 3 5 9 5.33 C A 4 5 7 5.17 D A 4 6 10 6.33 E B, C 4 5 7 5.17 F D 3 4 8 4.50 G E 3 5 8 5.17
- 12. IMPORTANT NOMENCLATURE ‘Slack’ and ‘Float’ In project management, the terms ‘slack’ and ‘float’ describe the length of time that an activity can be delayed without delaying the finish date of a subsequent activity, or the finish date of the entire project. Float or slack is a measure of the excess time and resources available to complete a task. Slack is referring to the amount of time that an activity can start later than originally planned and float is about the time when an activity takes longer than originally planned. Free float is the amount of time that an activity can be delayed without delaying the successor activity. Total float is the amount of time that an activity can be delayed without delaying the completion of the project.
- 13. CONT. Critical path: The longest possible continuous pathway taken from the initial event to the terminal event. Any time delays along the critical path will delay the reaching of the terminal event.
- 14. CONT. Fast tracking: A schedule compression technique in which activities normally done in sequence are performed in parallel for at least a portion of their duration.To do more things in the same time in order to finish a job earlier than normal or planned. To use fast-tracking in project management, you must first go over the critical path and identify which tasks can be performed parallel to one another. For example, when planning a party, you cannot hang up decorations if a venue has not first been chosen.These are two tasks that cannot run parallel to one another. However, in this same example, hanging up decorations and setting out the party snacks are two activities that can be done simultaneously to quicken the time to the end result.
- 15. CONT. Crashing: A technique used to shorten the schedule duration by adding resources. Shortening the durations of critical path activities by adding resources. Additional resources include: Additional manpower Overtime work Paying extra Adding more resources
- 16. CONT. LeadTime When the first activity is still running and second activity starts, this is called Lead. LeadTime is the overlap between the first and second activity. For example, let us say that the time duration for the first activity is 20 days, and for the second activity it is 15 days. As the first activity completes its first 15 days, you start working on the second activity. (Thus, we have 5 days lead time).
- 17. CONT. LagTime When the first activity completes, if there is then a delay or wait period before the second activity starts, this is called lag and the delay is known as the LagTime. For example, the time duration for the first activity is 3 days, and for the second activity it is 2 days.After completing the first activity you wait for 1 day, and then you start the second activity. In this case, we say that LagTime is one day, or Finish to Start activity with one day delay or lag.
- 18. IMPORTANCE OF PERT Reduction in cost Saving of time Determination of activities Elimination of risk in complex activities Flexibility Evaluation of alternatives Useful in effective control Useful in decision making Useful in research work Visibility of critical path It allows project managers to do 'what if' analysis on project activities.
- 19. Disadvantages of PERT It has been its emphasis on time only but not on costs. Prediction Inaccuracy Expensive –Too expensive in terms of time consumed, research, prediction, and resources utilized. Subjective Analysis
- 20. Critical Path Method(CPM) History The critical path method (CPM) is a project modelling technique developed in the late 1950s by DuPont, and was first used in missile- defense construction projects of US Navy. Critical Path Analysis is commonly used with all forms of projects, including construction, aerospace and defense, software development, research projects, product development, engineering, and plant maintenance, among others.Any project with interdependent activities can apply this method. The first time CPM was used for major skyscraper development was in 1966 while constructing the formerWorldTrade CenterTwinTowers in NewYork City.
- 21. INTRODUCTION Critical Path method, or CPM, is an important project planning tool to monitor the progress of the project to ensure that the project is on schedule. The Critical Path for a project is the longest sequence of activities on the network diagram and is characterized by zero Slack for all activities on the sequence.This means that a smallest delay in any of the activities on the critical path will cause a delay in the overall timeline of the project. The critical path method (CPM) is used in project management to create project schedules and helps project managers create a timeline for the project
- 22. Components The essential technique for using CPM: is to construct a model of the project that includes the following: A list of all activities required to complete the project (typically categorized within a work breakdown structure), The time (duration) that each activity will take to complete, The dependencies between the activities and, Logical end points such as milestones or deliverable items.
- 23. STEPS IN CPM Step 1: Activity specification Step 2: Activity sequence establishment Step 3: Network diagram Step 4: Estimates for each activity Step 5: Identification of the critical path For this, you need to determine four parameters of each activity of the network. Earliest start time (ES) -The earliest time an activity can start once the previous dependent activities are over. Earliest finish time (EF) - ES + activity duration. Latest finish time (LF) -The latest time an activity can finish without delaying the project. Latest start time (LS) - LF - activity duration. Step 6: Critical path diagram to show project progresses
- 24. ADVANTAGES It shows the graphical view of the project. It discovers and makes dependencies visible. It helps in contingency planning. It shows the critical path, and identifies critical activities requiring special attention. It helps assign the float to activities. It shows where you to take action to bring project back on track
- 25. Disadvantages of Critical Path Method (CPM): The scheduling of personnel is not handled by the CPM. In CPM, it is difficult to estimate the completion time of an activity. The critical path is not always clear in CPM. For bigger projects, CPM networks can be complicated too. It also does not handle the scheduling of the resource allocation. In CPM, critical path needs to be calculated precisely.
- 26. CONCLUSION PERT and CPM : DIFFERENCE PERT CPM V S Manages uncertain Manages certain Event oriented Activity oriented Probabilistic model Deterministic model Focuses on time Time cost-trde-off No crashing Chance of crashing Three time estimates One time estimates Suitable for research and development For construction NETWORK DIAGRAM PLANNING AND CONTROLLING TOOLS CREATES ACTIVITY LIST CREATES PRECEDENT DIAGRAM IDENTIFY CRITICAL PATH AND CALCULATES FLOAT SIMILARITIES