SlideShare a Scribd company logo
1 of 14
Download to read offline
© 2019, IJSRMS All Rights Reserved 33
International Journal of Scientific Research in _______________________________ Research Paper .
Multidisciplinary Studies E-ISSN: 2454-9312
Vol.5, Issue.9, pp.33-46, September (2019) P-ISSN: 2454-6143
Geomorphological Analysis and Prioritization of Subwatershed of Raichur
City Karnataka Using Weighted Sum Approach
Mohammed Badiuddin Parvez1
*, M Inayathulla2
1,2
Department of Civil Engineering, UVCE, Bangalore University, Bangalore, Karnataka, India
*Corresponding Author: parvezuvce@gmail.com Tel.: +919060506390
Available online at: www.isroset.org
Received: 26/Aug/2019, Accepted: 20/Sept/2019, Online: 30/Sept/2019
Abstract- Prioritization of watershed has picked up significance in watershed management. Morphometic analysis is been
commonly applied to prioritize the watershed. In the present study two mini watersheds in Raichur city have been considered
Mini-watershed 1 with an area of 519.32 km2
with highest order stream of 6 Mini -Watershed 2 with an area of 360.97 km2
with highest order stream of 5. There are Seven Subwatersheds in both the Mini-watersheds. Various morphometric
parameters namely Bifurcation ratio(Rb), Drainage density(Dd), Stream frequency(Ns), Texture ratio(T), Form factor(Rf),
Circularity ratio(Rc), Elongation Ratio(Re), length of overland flow, shape factor(Bs), compactness ratio (Cc) has been
determined for each subwatershed and allotted position on premise of relationship as to arrive at a Compound value for final
ranking of subwatershed. The morphometric parameters ranges between Rb (2.95-5.50), Dd (1.218-1.373), Ns (0.890-1.182), T
(0.731-1.590), Rf (0.230-0.850), Rc (0.246-0.500), Re (0.55-1.04), Cc (1.40-1.83), Lof (0.364-0.411), and Bs (1.17-4.20). It is
found that in Mini-watershed 1 50.87% of area falls under Very high Priority category 32.94% under high, 8.96% under
medium and 7.23% under very low priority category and in Mini-watershed 2 20.34% of area falls under very high, 19.82%
under high and 59.84% under medium priority category.
Keywords: GIS, DEM, Morphometric analysis, Subwatershed, Priority, Compound Factor.
I. INTRODUCTION
Morphometric analysis provides quantitative description of
the basin geometry to understand initial slope or inequalities
in the rock hardness, structural controls, recent diastrophism,
geological and geomorphic history of drainage basin
(Strahler, 1964). Morphometric analysis requires
measurement of linear features, gradient of channel network
and contributing ground slopes of the drainage basin.
Morphometry is the measurement and mathematical analysis
of the configuration of the earth's surface, shape and
dimension of its landforms. A major emphasis in
geomorphology over the past several decades has been on
the development of quantitative physiographic methods to
describe the evolution and behavior of surface drainage
networks (Horton, 1945). Drainage basin examination based
on morphometric parameters is very fundamental for
watershed planning since it gives an thought regarding the
basin characteristics in terms of slope, topography, soil
condition, runoff characteristics, surface water potential etc.
Geographic Information System techniques strategies
described by an exceptionally high exactness of mapping
and measurement prove to be a tool in morphometric
analysis. One of the advantages of quantitative analysis is
that many of the basin parameters derived are in the form of
ratios, and dimensionless numbers, thus providing an
effective comparison irrespective of the scale
(Krishnamurthy et al. 1996).
II. MATERIALS AND METHODS
2.1 Study Area
In this Study two Mini-watersheds have been considered
Mini-watershed 1 is located between Latitude 16º9′52′′ N to
16º22′24′′ N Latitude and 77º2′59′′ E to77º28′50′′ E
Longitude and Covers an area of 519.32 km2
, having
maximum length of 38.42 km. The maximum and minimum
elevation of the basin is 492 m and 335 m above MSL,
respectively. It is divided into seven subwatersheds as ( S1A,
S1B, S1C, S1D,S1E, S1F and S1G ) and Mini-watershed 2
is located between Latitude 15º57′58′′ N to 16º11′25.6′′ N
Latitude and 77º18′1′′ E to77º32′5.3′′ E Longitude and
covers area of 360.97 km2, having maximum length of
26.17 km. The maximum and minimum elevation of the
basin is 533 m and 323 m above MSL respectively. It is
divided into seven subwatersheds as (S2A, S2B, S12C, S2D,
S2E, S2F and S2G ) . Location of the study area is shown in
figure 1. The average mean daily temperature varies from
22 to 410
C respectively. The impact of climate change is
likely to have serious influence on agriculture and water
sector.
Int. J. Sci. Res. in Multidisciplinary Studies Vol. 5(9), Sept 2019
© 2019, IJSRMS All Rights Reserved 34
2.2 Methodology
By using SRTM DEM data, basin was delineated and the
drainage network was extracted. Initially the sink or
depression area in DEM is been filled to get rid of small
uneveness in the data. Then on basis of relative slopes
between pixels flow direction is determined. Flow
accumulation grid has been prepared using this data. Stream
order was generated using above data on the basis of
drainage flow direction watershed was divided into seven
subwatersheds designated as ( S1A, S1B, S1C, S1D,S1E,
S1F and S1G ) and ( S2A, S2B, S12C, S2D, S2E, S2F and
S2G ) for Mini waterhed 1 and 2 respectively as show in
figure 2 and 3. Morphometric aspects such as Bifurcation
ratio(Rb), Drainage density(Dd), Stream frequency(Ns),
Texture ratio(T), Form factor(Rf), Circularity ratio(Rc),
Elongation Ratio(Re), length of overland flow, shape
factor(Bs), drainage texture, compactness ratio(Cc) is
calculated using formulas shown in table.
Figure 1 location map of study area
Figure 2 Stream order map
The total Area (A), Perimeter (P) of Seven subwatersheds of
both is calculated using Arc GIS and values are tabulated in
table 2.
III. RESULTS AND DISCUSSIONS
3.1 Morphometric analysis
Designation of Stream order is the basic step in
morphometric analysis of a drainage basin, based on the
hierarchic making of streams proposed by Strahler (1964).
The highest order stream in the study area is 6th
order. The
morphometric parameters were calculated its shows that
Bifurcation ratio (Rb) ranges from 2.95 to 5.50 S1G have
low Rb whereas S2A have high Rb. Drainage density (Dd)
is low in S1C and high in S2D its value ranges from 1.218
to 1.373. Stream frequency (Ns) varies from 0.890 to 1.182
with S2F having low and S1B has high value. Texture ratio
(T) ranges from 0.731 to 1.590 with low in S2G and high in
S1A. Form factor (Rf) is low in S2G and high in S2B it
ranges from 0.230 to 0.850. Length of overland flow varies
from 0.364 to 0.411 with low in S2D and high in S1C. Basin
shape(Bs) is low in S2B and high in S2G it ranges from
1.17 to 4.20. Compactness coefficient(Cc) show wide
variation across the subwatershed it is more in S2B and less
in S1E it varies from 1.40 to 1.83. Elongation ratio(Re)
varies from 0.55 to 1.04 with S2G has low and S2B has high
value. Circularity ratio(Rc) of subwatersheds ranges from
0.246 to 0.500 with low in S2G and high in S2B. The
Tabulated results are shown in Table 4. Linear
morphometric characteristics is shown in table 3.
Figure 3 Subwatershed map
Int. J. Sci. Res. in Multidisciplinary Studies Vol. 5(9), Sept 2019
© 2019, IJSRMS All Rights Reserved 35
Table 1: Formula adopted for computation of morphometric parameters for the study area
Table 2 : Subwatersheds of Cauvery Catchment
Subwatersheds Area(km2
) Perimeter(km) Length(km) Width(km)
S1A 131.66 71.41 21.49 7.35
S1B 60.05 44.97 12.31 6.42
S1C 46.57 42.58 12.37 5.04
S1D 87.63 51.88 13.10 7.88
S1E 83.4 59.2 13.25 6.85
S1F 72.47 54.75 12.42 6.63
S1G 37.55 36.71 8.05 6.97
S2A 34.83 33.72 8.90 4.50
S2B 72.6 42.73 9.24 10.25
S2C 38.18 38.48 11.3 3.98
S2D 52.96 42.38 12.7 4.95
S2E 55.53 51.5 11.2 8.28
S2F 71.51 59.54 15.08 6.21
S2G 35.22 42.39 12.17 3.24
Sl no Morphometric parameters Formula Refrence
1 Stream order Hierarchial rank Strahler (1964)
2 Stream length (Lu) Length of the stream Horton (1945
3 Mean stream length (Lsm)
Lsm = ? Lu / Nu
Strahler (1964)
Where, Lsm = Mean stream length
Lu = Total stream length of order 'u'
Nu = Total no. of stream segments of order 'u'
4 Stream length ratio (RL
RL = Lu / Lu – 1
Horton (1945)
Where, RL = Stream length ratio
Lu = The total stream length of the order 'u'
Lu – 1 = The total stream length of its next lower order
5 Bifurcation ratio (Rb)
Rb = Nu / Nu + 1
Schumn (1956)
Where, Rb = Bifurcation ratio
Nu = Total no. of stream segments of order 'u'
Nu + 1 = Number of segments of the next higher order
6 Relief ratio (Rh)
Rh = H / Lb Where, Rh = Relief ratio
Schumn (1956)H = Total relief (Relative relief) of the basin (km)
Lb = Basin length
7 Drainage density (D)
D = Lu / A
Horton (1932)
Where, D = Drainage density
Lu = Total stream len gth of all orders
A = Area of the basin (Sq km)
8 Stream frequency (Fs)
Fs = Nu / A
Horton (1932)
Where, Fs = Stream frequency
Ns = Total no. of streams segments
A = Area of the basin (Sq km)
9 Form factor (Rf)
Rf = A / Lb
Horton (1932)
Where, Rf = Form factor
A = Area of the basin (Sq km)
Lb = basin length
10 Circularity ratio (Rc)
Rc = (4 * Pi * A)1/2
/ P²
Miller (1953)
Where, Rc = Circularity ratio
Pi = 'Pi' value i.e., 3.14
A = Area of the basin (Sq km)
P² = Square of the perimeter (km)
11 Elongation ratio (Re)
Re = 2 (A/Pi)½ / Lb
Schumn (1956)
Where, Re = Elongation ratio
A = Area of the basin (Sq km)
Pi = 'Pi' value i.e., 3.14 and Lb = Basin length
Int. J. Sci. Res. in Multidisciplinary Studies Vol. 5(9), Sept 2019
© 2019, IJSRMS All Rights Reserved 36
Figure 4 Percentage area distribution of Subwatershed
Table 3: Linear Morphometric Characteristics of Subwatersheds in Miniwatershed 1
Subwatershed Stream
order
No of
Streams
Total
length of
Streams
(km)
Cumulative
Length(km)
Mean Stream
Length(km)
Bifurcation
Ratio
Length
Ratio
S1A
1 114 88.78 88.78 0.78
2 25 34.75 123.53 1.39 4.56 1.78
3 6 25.72 149.25 4.29 4.16 3.08
4 2 9.24 158.49 4.62 3 1.08
5 1 2.69 161.18 2.69 2 0.58
S1B
1 57 40.17 40.17 0.70
2 10 17.34 57.51 1.73 5.70 2.46
3 3 11.39 68.90 3.80 3.333 2.19
4 1 7.54 76.44 7.54 3 1.99
S1C
1 39 26.80 26.80 0.69
2 8 12.91 39.71 1.61 4.88 2.35
3 2 12.39 52.10 6.20 4 3.84
4 1 4.60 56.70 4.60 2 0.74
S1D
1 65 66.45 66.45 1.02
2 18 27.06 93.51 1.50 3.61 1.47
3 4 22.10 115.61 5.53 4.5 3.68
4 1 4.16 119.77 4.16 4 0.75
S1E
1 70 53.50 53.50 0.76
2 16 19.54 73.04 1.22 4.38 1.60
3 2 6.64 79.68 3.32 8 2.72
4 2 2.78 82.46 1.39 1 0.42
5 2 7.83 90.29 3.92 1 2.82
6 1 12.12 102.41 12.12 2 3.10
S1F
1 54 43.68 43.68 0.81
2 15 23.14 66.82 1.54 3.60 1.91
3 2 14.58 81.40 7.29 7.5 4.73
4 1 7.84 89.24 7.84 2 1.08
1 30 19.63 19.63 0.65
2 8 14.22 33.85 1.78 3.75 2.72
Int. J. Sci. Res. in Multidisciplinary Studies Vol. 5(9), Sept 2019
© 2019, IJSRMS All Rights Reserved 37
S1G
3 1 0.52 34.37 0.52 8 0.29
4 1 4.70 39.07 4.70 1 9.04
5 0 0.00 39.07 - - -
6 1 6.50 45.57 6.50 - -
Table 4: Linear Morphometric Characteristics of Subwatersheds in Miniwatershed 2
Subwatershed Stream
order
No of
Streams
Total length of
Streams (km)
Cumulative
Length(km)
Mean Stream
Length(km)
Bifurcation
Ratio
Length
Ratio
S2A
1 28 24.08 24.08 0.86
2 4 14.13 38.21 3.53 7.00 4.11
3 1 5.94 44.15 5.94 4 1.68
S2B 1 66 48.76 48.76 0.74
2 13 27.93 76.69 2.15 5.08 2.91
3 3 12.49 89.18 4.16 4.333333333 1.94
4 1 2.31 91.49 2.31 3 0.55
S2C
1 34 25.41 25.41 0.75
2 7 10.60 36.01 1.51 4.86 2.03
3 2 12.14 48.15 6.07 3.5 4.01
4 1 0.63 48.78 0.63 2 0.10
S2D
1 43 36.94 36.94 0.86
2 9 24.01 60.95 2.67 4.78 3.11
3 2 7.22 68.17 3.61 4.5 1.35
4 1 4.55 72.72 4.55 2 1.26
S2E
1 49 37.08 37.08 0.76
2 7 18.50 55.58 2.64 7.00 3.49
3 1 5.30 60.88 5.30 7 2.01
4 2 3.04 63.92 1.52 0.5 0.29
5 1 9.01 72.93 9.01 2 5.93
S2F
1 53 53.03 53.03 1.00
2 9 17.15 70.18 1.91 5.89 1.90
3 1 10.48 80.66 10.48 9 5.50
4 1 17.23 97.89 17.23 1 1.64
S2G
1 31 25.64 25.64 0.83
2 5 5.97 31.61 1.19 6.20 1.44
3 1 8.13 39.74 8.13 5 6.81
4 1 0.28 40.02 0.28 1 0.03
5 1 5.06 45.08 5.06 1 18.07
Figure 5 Bifurcation Ratio
Int. J. Sci. Res. in Multidisciplinary Studies Vol. 5(9), Sept 2019
© 2019, IJSRMS All Rights Reserved 38
3.2 Priortization of subwatersheds
Morphometric aspects such as Bifurcation ratio (Rb),
Drainage density (Dd), Stream frequency (Ns), Texture ratio
(T), Form factor (Rf), Circularity ratio (Rc), Elongation
Ratio (Re), length of overland flow, Basin Shape (Bs),
compactness ratio(Cc) are also termed as erosin risk
assessment parameters and have been used for prioritizing
subwatersheds (Biswas et al 1999). The preliminary priority
ranking of sub-watersheds was done on the basis of
morphological characteristics the parameters such as
Bifurcation ratio(Rb), Stream frequency (Ns), Drainage
density(Dd), Texture ratio(T), have a direct relationship with
erodibility higher values of all these have been have been
given rank 1 second largest is rated as rank 2 and so on with
the least ranked last in each of the mini watersheds.
Parameters such as Form factor (Rf), Circularity ratio (Rc),
Elongation Ratio (Re), Basin Shape (Bs) have inverse
relationship with the erodibility higher the value less is
erosion lower the value high is erodibility. In this manner
least estimations of this is appraised as rank 1 and second
least been rated as rank 2 and so on and the highest values is
given last rank. The final priority ranking and related
categorization were made on the basis of the compound
factor value, which was computed by multiplying the ranks
from morphometric analysis and their weights obtained
using cross-correlation analysis of these parameters to give
compound factor for final prioritization of sub-watersheds.
The compound factor is calculated using equation 1.
CF= PPRmp x Wmp (1) Where CF is compound factor,
PPRmp is the preliminary priority rank based on
morphometric parameter, and Wmp is the weight of
morphometric parameter obtained using cross correlation
analysis. Based on final value of compound factor
Subwatershed with least rating was assigned highest rank
next value was assigned second rank and so on and the
subwatershed with highest compound value was assigned
last rank.
3.2.1 Prioritization of sub-watershed based on weighted
sum approach
The cross-correlation analysis among various morphometric
parameters (Table 6 and 7) was performed and tested at 5%
level of significance. The priority ranks of sub-watersheds
were determined on the basis of compound factor (Table 6),
which was calculated using Eq.1.The value of weights
assigned to a morphometric parameter was calculated by
dividing the sum of correlation coefficient of each parameter
by the grand total of correlations (Table 6 and 7). By
assigning the weights to different parameters, a model was
formulated to assess the final priority ranking. The
compound factor form mini- watershed 1 prioritization was
computed as follows:
Compound factor =(0.2088*PPR of Rbm)+(0.4209*PPR of
Dd)-(0.432*PPR of LOF)- (0.3445*PPR of
Cc)+(0.3617*PPR of Rc)+(0.1195*PPR of
Ns)+(0.1508*PPR of Rf)-(0.2329*PPR of Bs)+(0.2296*PPR
of Re)+(0.5188*PPR of T) .
The final priority ranking was made in such a way that the
lowest value of compound factor was given the priority rank
of 1, the next lower value was given priority rank of 2, and
so on for all the sub-watersheds. Figure 10 shows the final
priority ranking map of 14 sub-watersheds under study.
Based on the compound factor value, all the subwatersheds
of both Mini-watersheds were classified into five priority
categories such as (i) very high (0 to 2.5), (ii) high (2.5 to
5.0), (iii) medium (5.0 to 7.5), (iv) low (7.5 to 10.0), and (v)
very low (>10.0) as given in Table 11 and 12. It was
observed from Table 11 that the three sub-watersheds (S1A,
S1B and S1F) were under very high category, two sub-
watersheds (S1D and S1E) under high category, one sub-
watersheds (S1C) under medium, and one sub-watershed
(S1G) was under very low category. And from Table 12 that
the two sub-watersheds (S2C and S2G) were under very
high category, one sub-watersheds (S2F) under high
category, four sub-watersheds (S2A, S2B, S2D and S2E)
under medium.
Table 5 Morphometric Parameters of Subwatersheds
Sub
Watershed
Bifurcation
Ratio
Mean
Drainage
Density
Length
Of
Overland
Flow
Compactness
Coefficient
Circularity
Ratio
Stream
Frequency
Form
Factor
Elongation
Ratio
Shape
Factor
Texture
Ratio
S1A 3.43 1.224 0.408 1.761 0.325 1.124 0.285 0.602 3.508 1.59
S1B 4 1.273 0.393 1.640 0.374 1.182 0.396 0.711 2.523 1.26
S1C 3.62 1.218 0.411 1.760 0.323 1.074 0.304 0.622 3.286 0.91
S1D 4.03 1.367 0.366 1.560 0.41 1.004 0.511 0.866 1.958 1.25
S1E 3.27 1.228 0.407 1.830 0.299 1.115 0.475 0.777 2.103 1.18
S1F 4.36 1.231 0.406 1.810 0.304 0.994 0.47 0.773 2.129 0.96
S1G 2.95 1.222 0.409 1.690 0.351 1.119 0.579 0.858 1.726 0.82
S2A 5.5 1.268 0.394 1.61 0.385 0.95 0.44 0.748 2.27 0.83
S2B 4.13 1.26 0.396 1.41 0.5 1.14 0.85 1.04 1.17 1.544
Int. J. Sci. Res. in Multidisciplinary Studies Vol. 5(9), Sept 2019
© 2019, IJSRMS All Rights Reserved 39
S2C 3.45 1.277 0.391 1.76 0.324 1.15 0.299 0.616 3.34 0.883
S2D 3.76 1.373 0.364 1.64 0.37 1.03 0.328 0.646 3.04 1.014
S2E 4.12 1.313 0.38 1.95 0.263 1.08 0.442 0.75 2.26 0.951
S2F 5.29 1.368 0.365 1.99 0.253 0.89 0.314 0.632 3.18 0.89
S2G 3.3 1.28 0.39 2.01 0.246 1.1 0.23 0.55 4.2 0.731
Figure 6 Drainage density
Int. J. Sci. Res. in Multidisciplinary Studies Vol. 5(9), Sept 2019
© 2019, IJSRMS All Rights Reserved 40
Int. J. Sci. Res. in Multidisciplinary Studies Vol. 5(9), Sept 2019
© 2019, IJSRMS All Rights Reserved 41
Figure 7 Regression of stream order vs No of Streams
Int. J. Sci. Res. in Multidisciplinary Studies Vol. 5(9), Sept 2019
© 2019, IJSRMS All Rights Reserved 42
Figure 8 Regression of stream order vs mean stream length
Int. J. Sci. Res. in Multidisciplinary Studies Vol. 5(9), Sept 2019
© 2019, IJSRMS All Rights Reserved 43
Table 6: Preliminary priority ranking of Mini-watershed 1
Subwatershed
Bifurcation
Ratio
Mean
DRAINAGE
DENSITY
LENGTH
OF
OVERLAND
FLOW
COMPACTNESS
COEFFICIENT
CIRCULARITY
RATIO
Stream
Frequency Form Factor
ELONGATION
RATIO
Shape
Factor Texture Ratio
S1A 1 6 2 2 6 6 5 5 3 6
S1B 3 7 1 1 7 2 7 7 1 1
S1C 6 5 3 4 4 1 2 2 6 5
S1D 5 1 7 3 5 5 4 4 4 2
S1E 4 3 5 5 3 4 6 6 2 3
S1F 2 2 6 6 2 7 3 3 5 4
S1G 7 4 4 7 1 3 1 1 7 7
Table 7: Preliminary priority ranking of Mini-watershed 2
Subwatershed
Bifurcation
Ratio
Mean
DRAINAGE
DENSITY
LENGTH
OF
OVERLAND
FLOW
COMPACTNESS
COEFFICIENT
CIRCULARITY
RATIO
Stream
Frequency Form Factor
ELONGATION
RATIO
Shape
Factor Texture Ratio
S2A 1 6 2 2 6 6 5 5 3 6
S2B 3 7 1 1 7 2 7 7 1 1
S2C 6 5 3 4 4 1 2 2 6 5
S2D 5 1 7 3 5 5 4 4 4 2
S2E 4 3 5 5 3 4 6 6 2 3
S2F 2 2 6 6 2 7 3 3 5 4
S2G 7 4 4 7 1 3 1 1 7 7
Table 8: Cross-correlation matrix between various parameters of mini watershed 1
Rbm Dd LOF Cc Rc Ns Rf Re Bf T
Rbm 1.0000 0.4332 -0.4402 -0.1644 0.1769 -0.4973 -0.3141 -0.1696 0.1903 0.3935
Dd 0.4332 1.0000 -0.9995 -0.8282 0.8541 -0.3170 0.2110 0.4530 -0.2648 0.6843
LOF -0.4402 -0.9995 1.0000 0.8277 -0.8538 0.3033 -0.2194 -0.4591 0.2777 -0.6973
Cc -0.1644 -0.8282 0.8277 1.0000 -0.9986 -0.0332 -0.2094 -0.3791 0.1939 -0.4121
Rc 0.1769 0.8541 -0.8538 -0.9986 1.0000 0.0199 0.2166 0.3939 -0.2079 0.4527
Ns -0.4973 -0.3170 0.3033 -0.0332 0.0199 1.0000 -0.1483 -0.2690 0.1409 0.1490
Rf -0.3141 0.2110 -0.2194 -0.2094 0.2166 -0.1483 1.0000 0.9645 -0.9801 -0.0816
Int. J. Sci. Res. in Multidisciplinary Studies Vol. 5(9), Sept 2019
© 2019, IJSRMS All Rights Reserved 44
Re -0.1696 0.4530 -0.4591 -0.3791 0.3939 -0.2690 0.9645 1.0000 -0.9585 0.0926
Bf 0.1903 -0.2648 0.2777 0.1939 -0.2079 0.1409 -0.9801 -0.9585 1.0000 -0.0699
T 0.3935 0.6843 -0.6973 -0.4121 0.4527 0.1490 -0.0816 0.0926 -0.0699 1.0000
Sum 0.6083 1.2261 -1.2607 -1.0036 1.0538 0.3482 0.4393 0.6688 -0.6784 1.5112
Grand Total 2.9130 2.9130 2.9130 2.9130 2.9130 2.9130 2.9130 2.9130 2.9130 2.9130
Weight 0.2088 0.4209 -0.4328 -0.3445 0.3617 0.1195 0.1508 0.2296 -0.2329 0.5188
Table 9: Cross-correlation matrix between various parameters of mini watershed 2
Rbm Dd LOF Cc Rc Ns Rf Re Bf T
Rbm 1.0000 0.5342 -0.5390 0.1490 -0.0933 -0.8084 0.1785 0.2012 -0.3039 0.1713
Dd 0.5342 1.0000 -0.9996 0.2771 -0.3315 -0.8530 -0.4294 -0.3970 0.2242 -0.3059
LOF -0.5390 -0.9996 1.0000 -0.2949 0.3484 0.8554 0.4341 0.4006 -0.2246 0.3160
Cc 0.1490 0.2771 -0.2949 1.0000 -0.9893 -0.4446 -0.7654 -0.7527 0.7016 -0.8806
Rc -0.0933 -0.3315 0.3484 -0.9893 1.0000 0.4332 0.8370 0.8212 -0.7484 0.9295
Ns -0.8084 -0.8530 0.8554 -0.4446 0.4332 1.0000 0.3447 0.3269 -0.2215 0.2917
Rf 0.1785 -0.4294 0.4341 -0.7654 0.8370 0.3447 1.0000 0.9977 -0.9413 0.9698
Re 0.2012 -0.3970 0.4006 -0.7527 0.8212 0.3269 0.9977 1.0000 -0.9613 0.9652
Bf -0.3039 0.2242 -0.2246 0.7016 -0.7484 -0.2215 -0.9413 -0.9613 1.0000 -0.9171
T 0.1713 -0.3059 0.3160 -0.8806 0.9295 0.2917 0.9698 0.9652 -0.9171 1.0000
Sum 0.4896 -1.2809 1.2963 -1.9999 2.2068 0.9244 2.6258 2.6018 -2.3923 2.5399
Grand Total 7.0114 7.0114 7.0114 7.0114 7.0114 7.0114 7.0114 7.0114 7.0114 7.0114
Weight 0.0698 -0.1827 0.1849 -0.2852 0.3147 0.1318 0.3745 0.3711 -0.3412 0.3623
Table 10 : Final Priority Ranking
Subwatersheds Name Compound factor Rank Subwatersheds Name Compound factor Rank
S1A 1.0853 1 S2A 6.32865 6
S1B 1.4874 2 S2B 6.53433 7
S1C 6.1268 6 S2C 1.55998 2
S1D 4.3134 5 S2D 5.17446 4
S1E 2.9078 4 S2E 5.57464 5
S1F 1.9841 3 S2F 2.70167 3
S1G 10.0756 7 S2G 0.09799 1
Int. J. Sci. Res. in Multidisciplinary Studies Vol. 5(9), Sept 2019
© 2019, IJSRMS All Rights Reserved 45
Figure 9 Priority Map
Table 11: Priority category based on compound factor for mini-watershed 1
Sl No Priority Level Priority Category Subwatershed name % Area
1 0.0-2.5 Very High S1A, S1B,S1F 50.87
2 2.5-5.0 High S1D, S1E 32.94
3 5.0-7.5 Medium S1C 8.96
4 7.5-10.0 Low - -
5 >10.0 Very Low S1G 7.23
Table 12: Priority category based on compound factor for mini-watershed 2
Sl No Priority Level Priority Category Subwatershed name % Area
1 0.0-2.5 Very High S2C, S2G 20.34
2 2.5-5.0 High S2F 19.82
3 5.0-7.5 Medium S2A, S2B,S2D,S2E 59.84
4 7.5-10.0 Low - -
5 >10.0 Very Low - -
Figure 10 Final priority category map
Int. J. Sci. Res. in Multidisciplinary Studies Vol. 5(9), Sept 2019
© 2019, IJSRMS All Rights Reserved 46
IV. CONCLUSIONS
The length of overland flow (lof) for majority of the
subwatersheds in the present study is more than 0.30 hence
they have longer flow paths associated with more
infiltration and reduced runoff. Stream frequency (Ns) for
present study is low demonstrating relatively a low runoff.
Higher value of form factor (Rf) indicates wider basin and
lower value indicates narrow basin. Drainage density
varies from1.222 km/km2
to 1.373 km/km2
indicating
subwatersheds fall under coarse and very coarse texture.
From table 11 and 12 it can be found that the 50.87 % of
area of mini-watershed 1 falls under very high priority
category where as 20.34% of area of mini-watershed falls
under this category. 8.96 % of area of mini-watershed 1
falls under Medium priority category where as 59.84 % of
area of mini-watershed falls under this category. We can
also conclude that in case of unavailability of soil maps
this type of study could be used in selecting area for soil
conservation measure.
REFERENCES
[1]. Horton R.E.(1945). Erosional Development of streams and their
drainage basins, Hydro physical approach to quantitative
morphology. Geological Society of American Bulletin. 56:
275-370.
[2]. Mohammed Badiuddin Parvez, M Inayathulla “Prioritization Of
Subwatersheds of Cauvery Region Based on Morphometric
Analysis Using GIS”, International Journal for Research in
Engineering Application & Management (IJREAM), Volume:
05 Issue: 01, April -2019.
[3]. Mohammed Badiuddin Parvez, M Inayathulla “Modelling of
Short Duration Isopluvial Map For Raichur District Karnataka”,
International Journal for Science and Advance Research in
Technology (IJSART), Volume: 05 Issue: 4, April -2019.
[4]. Mohammed Badiuddin Parvez, and M .Inayathulla.
"Morphometry, Hypsometry Analysis and Runoff Estimation of
Aam Talab Watershed Raichur, Karnataka" International
Journal Of Advance Research And Innovative Ideas In
Education Volume 5 Issue 3 2019 Page 1713-1727
[5]. Mohammed Badiuddin Parvez, M Inayathulla, “Development of
S Curve for Mini-Watershed of Raichur City Karnataka”,
International Journal of Scientific Research in Multidisciplinary
Studies , Vol.5, Issue.8, pp.1-11, 2019.
[6]. Vijith, H and Sateesh, R. (2006). GIS based morphometric
analysis of two major upland Sub-watershed of Meenachil river
in Kerala. Journal of Indian society of Remote Sensing. 34(2):
181-185.
Authors Profile
Mohammed Badiuddin Parvez Is a
life member of Indian Water Resources
Society, ASCE Born in Gangavathi,
Obtained his BE in Civil Engineering in
the year 2009-2013 from UVCE,
Banagalore and M.E with specialization
on Water Resources Engineering
during 2013-2015 from UVCE, Bangalore University and
Pursuing Ph.D from Bangalore University. And has 3
years of teaching experience. Till date, has presented and
published several technical papers in many National and
International seminars, Journals and conferences.
Dr M Inayathulla Is a life member
of Environmental and Water Resources
Engineering (EWRI), ASCE, WWI,
ASTEE, ASFPM. Born in Karnataka,
Obtained his BE in Civil Engineering in
the year 1987-1991 from UBDT,
Davanagere and M.E with specialization
on Water Resources Engineering during
1992-1994 from UVCE, Bangalore University and got
Doctorate from Bangalore University in the year 1990-
1995. Presently working as Professor at UVCE, Bangalore
University, India. And has more than 25 years of teaching
experience. Till date, has presented and published several
technical papers in many National and International
seminars and conferences.

More Related Content

What's hot

Streamflow simulation using radar-based precipitation applied to the Illinois...
Streamflow simulation using radar-based precipitation applied to the Illinois...Streamflow simulation using radar-based precipitation applied to the Illinois...
Streamflow simulation using radar-based precipitation applied to the Illinois...Alireza Safari
 
Quantitative evaluation and analysis of morphometric parameters derived from ...
Quantitative evaluation and analysis of morphometric parameters derived from ...Quantitative evaluation and analysis of morphometric parameters derived from ...
Quantitative evaluation and analysis of morphometric parameters derived from ...AM Publications
 
Estimating and Classifying Spatial and Temporal Distributions of Flow Conditi...
Estimating and Classifying Spatial and Temporal Distributions of Flow Conditi...Estimating and Classifying Spatial and Temporal Distributions of Flow Conditi...
Estimating and Classifying Spatial and Temporal Distributions of Flow Conditi...Beniamino Murgante
 
I031102071079
I031102071079I031102071079
I031102071079theijes
 
IRJET-Morphometric Analysis of Vela Hari Watershed using GIS
IRJET-Morphometric Analysis of Vela Hari Watershed using GISIRJET-Morphometric Analysis of Vela Hari Watershed using GIS
IRJET-Morphometric Analysis of Vela Hari Watershed using GISIRJET Journal
 
IRJET- Morphometric Analysis of Venna River Basin using Geospatial Tool
IRJET- Morphometric Analysis of Venna River Basin using Geospatial ToolIRJET- Morphometric Analysis of Venna River Basin using Geospatial Tool
IRJET- Morphometric Analysis of Venna River Basin using Geospatial ToolIRJET Journal
 
Masek_Watershed Deliniation Portfolio
Masek_Watershed Deliniation PortfolioMasek_Watershed Deliniation Portfolio
Masek_Watershed Deliniation PortfolioRyan Masek
 
Remote Sensing & GIS based drainage morphometry
Remote Sensing & GIS based drainage morphometryRemote Sensing & GIS based drainage morphometry
Remote Sensing & GIS based drainage morphometryAkshay Wakode
 
IRJET- GIS based Quantitative Morphometric Analysis of Warna Watershed, Mahar...
IRJET- GIS based Quantitative Morphometric Analysis of Warna Watershed, Mahar...IRJET- GIS based Quantitative Morphometric Analysis of Warna Watershed, Mahar...
IRJET- GIS based Quantitative Morphometric Analysis of Warna Watershed, Mahar...IRJET Journal
 
Morphometric Analysis of Markandeya River Sub Basin (MRSB), Belgaum District,...
Morphometric Analysis of Markandeya River Sub Basin (MRSB), Belgaum District,...Morphometric Analysis of Markandeya River Sub Basin (MRSB), Belgaum District,...
Morphometric Analysis of Markandeya River Sub Basin (MRSB), Belgaum District,...IJERD Editor
 
3 d numerical modeling of supercritical flow in gradual expansions
3 d numerical modeling of supercritical flow in gradual expansions3 d numerical modeling of supercritical flow in gradual expansions
3 d numerical modeling of supercritical flow in gradual expansionsPercy Rosales
 
IRJET- Morphometric Estimation of Parameters of Uttar Mand River Basin, Sata...
IRJET-	 Morphometric Estimation of Parameters of Uttar Mand River Basin, Sata...IRJET-	 Morphometric Estimation of Parameters of Uttar Mand River Basin, Sata...
IRJET- Morphometric Estimation of Parameters of Uttar Mand River Basin, Sata...IRJET Journal
 
Suspended Sediment Rating Curve for Tigris River Upstream Al- Betera Regulator
Suspended Sediment Rating Curve for Tigris River Upstream Al- Betera RegulatorSuspended Sediment Rating Curve for Tigris River Upstream Al- Betera Regulator
Suspended Sediment Rating Curve for Tigris River Upstream Al- Betera RegulatorIJRES Journal
 
Morphometric analysis of vrishabhavathi watershed using remote sensing and gis
Morphometric analysis of vrishabhavathi watershed using remote sensing and gisMorphometric analysis of vrishabhavathi watershed using remote sensing and gis
Morphometric analysis of vrishabhavathi watershed using remote sensing and giseSAT Journals
 
Heritage hetherington lidar_pdf[1]
Heritage hetherington lidar_pdf[1]Heritage hetherington lidar_pdf[1]
Heritage hetherington lidar_pdf[1]llica
 

What's hot (19)

Streamflow simulation using radar-based precipitation applied to the Illinois...
Streamflow simulation using radar-based precipitation applied to the Illinois...Streamflow simulation using radar-based precipitation applied to the Illinois...
Streamflow simulation using radar-based precipitation applied to the Illinois...
 
Quantitative evaluation and analysis of morphometric parameters derived from ...
Quantitative evaluation and analysis of morphometric parameters derived from ...Quantitative evaluation and analysis of morphometric parameters derived from ...
Quantitative evaluation and analysis of morphometric parameters derived from ...
 
Ijirt148631 paper (1)
Ijirt148631 paper (1)Ijirt148631 paper (1)
Ijirt148631 paper (1)
 
Estimating and Classifying Spatial and Temporal Distributions of Flow Conditi...
Estimating and Classifying Spatial and Temporal Distributions of Flow Conditi...Estimating and Classifying Spatial and Temporal Distributions of Flow Conditi...
Estimating and Classifying Spatial and Temporal Distributions of Flow Conditi...
 
I031102071079
I031102071079I031102071079
I031102071079
 
04 mb.v.h
04 mb.v.h04 mb.v.h
04 mb.v.h
 
IRJET-Morphometric Analysis of Vela Hari Watershed using GIS
IRJET-Morphometric Analysis of Vela Hari Watershed using GISIRJET-Morphometric Analysis of Vela Hari Watershed using GIS
IRJET-Morphometric Analysis of Vela Hari Watershed using GIS
 
IRJET- Morphometric Analysis of Venna River Basin using Geospatial Tool
IRJET- Morphometric Analysis of Venna River Basin using Geospatial ToolIRJET- Morphometric Analysis of Venna River Basin using Geospatial Tool
IRJET- Morphometric Analysis of Venna River Basin using Geospatial Tool
 
Masek_Watershed Deliniation Portfolio
Masek_Watershed Deliniation PortfolioMasek_Watershed Deliniation Portfolio
Masek_Watershed Deliniation Portfolio
 
Remote Sensing & GIS based drainage morphometry
Remote Sensing & GIS based drainage morphometryRemote Sensing & GIS based drainage morphometry
Remote Sensing & GIS based drainage morphometry
 
IRJET- GIS based Quantitative Morphometric Analysis of Warna Watershed, Mahar...
IRJET- GIS based Quantitative Morphometric Analysis of Warna Watershed, Mahar...IRJET- GIS based Quantitative Morphometric Analysis of Warna Watershed, Mahar...
IRJET- GIS based Quantitative Morphometric Analysis of Warna Watershed, Mahar...
 
Morphometric Analysis of Markandeya River Sub Basin (MRSB), Belgaum District,...
Morphometric Analysis of Markandeya River Sub Basin (MRSB), Belgaum District,...Morphometric Analysis of Markandeya River Sub Basin (MRSB), Belgaum District,...
Morphometric Analysis of Markandeya River Sub Basin (MRSB), Belgaum District,...
 
3 d numerical modeling of supercritical flow in gradual expansions
3 d numerical modeling of supercritical flow in gradual expansions3 d numerical modeling of supercritical flow in gradual expansions
3 d numerical modeling of supercritical flow in gradual expansions
 
IRJET- Morphometric Estimation of Parameters of Uttar Mand River Basin, Sata...
IRJET-	 Morphometric Estimation of Parameters of Uttar Mand River Basin, Sata...IRJET-	 Morphometric Estimation of Parameters of Uttar Mand River Basin, Sata...
IRJET- Morphometric Estimation of Parameters of Uttar Mand River Basin, Sata...
 
Reservoir mapping
Reservoir mappingReservoir mapping
Reservoir mapping
 
Suspended Sediment Rating Curve for Tigris River Upstream Al- Betera Regulator
Suspended Sediment Rating Curve for Tigris River Upstream Al- Betera RegulatorSuspended Sediment Rating Curve for Tigris River Upstream Al- Betera Regulator
Suspended Sediment Rating Curve for Tigris River Upstream Al- Betera Regulator
 
Morphometric analysis of vrishabhavathi watershed using remote sensing and gis
Morphometric analysis of vrishabhavathi watershed using remote sensing and gisMorphometric analysis of vrishabhavathi watershed using remote sensing and gis
Morphometric analysis of vrishabhavathi watershed using remote sensing and gis
 
Heritage hetherington lidar_pdf[1]
Heritage hetherington lidar_pdf[1]Heritage hetherington lidar_pdf[1]
Heritage hetherington lidar_pdf[1]
 
Af31231237
Af31231237Af31231237
Af31231237
 

Similar to 6 ijsrms-02616 (1)

IRJET- Geomorphological Analysis of Two Mini-Watersheds in Raichur City K...
IRJET-  	  Geomorphological Analysis of Two Mini-Watersheds in Raichur City K...IRJET-  	  Geomorphological Analysis of Two Mini-Watersheds in Raichur City K...
IRJET- Geomorphological Analysis of Two Mini-Watersheds in Raichur City K...IRJET Journal
 
Prioritization Of Subwatersheds of Cauvery Region Based on Morphometric Analy...
Prioritization Of Subwatersheds of Cauvery Region Based on Morphometric Analy...Prioritization Of Subwatersheds of Cauvery Region Based on Morphometric Analy...
Prioritization Of Subwatersheds of Cauvery Region Based on Morphometric Analy...Mohammed Badiuddin Parvez
 
Estimation of morphometric parameters and
Estimation of morphometric parameters andEstimation of morphometric parameters and
Estimation of morphometric parameters andeSAT Publishing House
 
Estimation of morphometric parameters and runoff using rs & gis techniques
Estimation of morphometric parameters and runoff using rs & gis techniquesEstimation of morphometric parameters and runoff using rs & gis techniques
Estimation of morphometric parameters and runoff using rs & gis techniqueseSAT Journals
 
Morphometry hypsometry_analysis_and_runoff_estimation_of_aam_talab_watershed...
Morphometry  hypsometry_analysis_and_runoff_estimation_of_aam_talab_watershed...Morphometry  hypsometry_analysis_and_runoff_estimation_of_aam_talab_watershed...
Morphometry hypsometry_analysis_and_runoff_estimation_of_aam_talab_watershed...Mohammed Badiuddin Parvez
 
Morphometric Studies of Fourth order Sub-Basins (FOSB’s) in North Bangalore M...
Morphometric Studies of Fourth order Sub-Basins (FOSB’s) in North Bangalore M...Morphometric Studies of Fourth order Sub-Basins (FOSB’s) in North Bangalore M...
Morphometric Studies of Fourth order Sub-Basins (FOSB’s) in North Bangalore M...Dr Ramesh Dikpal
 
IRJET- Quantitative Morphometric Analysis of Panchganga Basin using GIS
IRJET- Quantitative Morphometric Analysis of Panchganga Basin using GISIRJET- Quantitative Morphometric Analysis of Panchganga Basin using GIS
IRJET- Quantitative Morphometric Analysis of Panchganga Basin using GISIRJET Journal
 
Evaluation of Morphometric Parameters Derived from CartoDEM and Aster GDEM wi...
Evaluation of Morphometric Parameters Derived from CartoDEM and Aster GDEM wi...Evaluation of Morphometric Parameters Derived from CartoDEM and Aster GDEM wi...
Evaluation of Morphometric Parameters Derived from CartoDEM and Aster GDEM wi...Dr Ramesh Dikpal
 
2018 GIS in Education: GIS Watershed Delineation and Morphometric Analysis of...
2018 GIS in Education: GIS Watershed Delineation and Morphometric Analysis of...2018 GIS in Education: GIS Watershed Delineation and Morphometric Analysis of...
2018 GIS in Education: GIS Watershed Delineation and Morphometric Analysis of...GIS in the Rockies
 
Morphometric Analysis of Warana Basin using GIS and Remote Sensing Techniques
Morphometric Analysis of Warana Basin using GIS and Remote Sensing TechniquesMorphometric Analysis of Warana Basin using GIS and Remote Sensing Techniques
Morphometric Analysis of Warana Basin using GIS and Remote Sensing TechniquesIRJET Journal
 
Remote sensing and GIS in the morphometric analysis of macro-watersheds for h...
Remote sensing and GIS in the morphometric analysis of macro-watersheds for h...Remote sensing and GIS in the morphometric analysis of macro-watersheds for h...
Remote sensing and GIS in the morphometric analysis of macro-watersheds for h...IRJET Journal
 
WATERSHED PRIORITIZATION IN RELATION TO SOIL EROSION USING GEOSPATIAL TECHNIQ...
WATERSHED PRIORITIZATION IN RELATION TO SOIL EROSION USING GEOSPATIAL TECHNIQ...WATERSHED PRIORITIZATION IN RELATION TO SOIL EROSION USING GEOSPATIAL TECHNIQ...
WATERSHED PRIORITIZATION IN RELATION TO SOIL EROSION USING GEOSPATIAL TECHNIQ...IRJET Journal
 
Morphometric analysis of a Semi Urban Watershed, trans Yamuna, draining at Al...
Morphometric analysis of a Semi Urban Watershed, trans Yamuna, draining at Al...Morphometric analysis of a Semi Urban Watershed, trans Yamuna, draining at Al...
Morphometric analysis of a Semi Urban Watershed, trans Yamuna, draining at Al...theijes
 
IRJET- Quantitative Morphometric Analysis of a Manganga Basin, Maharashtr...
IRJET-  	  Quantitative Morphometric Analysis of a Manganga Basin, Maharashtr...IRJET-  	  Quantitative Morphometric Analysis of a Manganga Basin, Maharashtr...
IRJET- Quantitative Morphometric Analysis of a Manganga Basin, Maharashtr...IRJET Journal
 
IRJET- A Review of Synthetic Hydrograph Methods for Design Storm
IRJET-  	  A Review of Synthetic Hydrograph Methods for Design StormIRJET-  	  A Review of Synthetic Hydrograph Methods for Design Storm
IRJET- A Review of Synthetic Hydrograph Methods for Design StormIRJET Journal
 

Similar to 6 ijsrms-02616 (1) (20)

IRJET- Geomorphological Analysis of Two Mini-Watersheds in Raichur City K...
IRJET-  	  Geomorphological Analysis of Two Mini-Watersheds in Raichur City K...IRJET-  	  Geomorphological Analysis of Two Mini-Watersheds in Raichur City K...
IRJET- Geomorphological Analysis of Two Mini-Watersheds in Raichur City K...
 
Prioritization Of Subwatersheds of Cauvery Region Based on Morphometric Analy...
Prioritization Of Subwatersheds of Cauvery Region Based on Morphometric Analy...Prioritization Of Subwatersheds of Cauvery Region Based on Morphometric Analy...
Prioritization Of Subwatersheds of Cauvery Region Based on Morphometric Analy...
 
Estimation of morphometric parameters and
Estimation of morphometric parameters andEstimation of morphometric parameters and
Estimation of morphometric parameters and
 
Estimation of morphometric parameters and runoff using rs & gis techniques
Estimation of morphometric parameters and runoff using rs & gis techniquesEstimation of morphometric parameters and runoff using rs & gis techniques
Estimation of morphometric parameters and runoff using rs & gis techniques
 
Estimation of morphometric parameters and runoff using rs & gis techniques
Estimation of morphometric parameters and runoff using rs & gis techniquesEstimation of morphometric parameters and runoff using rs & gis techniques
Estimation of morphometric parameters and runoff using rs & gis techniques
 
Morphometry hypsometry_analysis_and_runoff_estimation_of_aam_talab_watershed...
Morphometry  hypsometry_analysis_and_runoff_estimation_of_aam_talab_watershed...Morphometry  hypsometry_analysis_and_runoff_estimation_of_aam_talab_watershed...
Morphometry hypsometry_analysis_and_runoff_estimation_of_aam_talab_watershed...
 
Morphometric Studies of Fourth order Sub-Basins (FOSB’s) in North Bangalore M...
Morphometric Studies of Fourth order Sub-Basins (FOSB’s) in North Bangalore M...Morphometric Studies of Fourth order Sub-Basins (FOSB’s) in North Bangalore M...
Morphometric Studies of Fourth order Sub-Basins (FOSB’s) in North Bangalore M...
 
Ijirt148701 paper
Ijirt148701 paperIjirt148701 paper
Ijirt148701 paper
 
IRJET- Quantitative Morphometric Analysis of Panchganga Basin using GIS
IRJET- Quantitative Morphometric Analysis of Panchganga Basin using GISIRJET- Quantitative Morphometric Analysis of Panchganga Basin using GIS
IRJET- Quantitative Morphometric Analysis of Panchganga Basin using GIS
 
Evaluation of Morphometric Parameters Derived from CartoDEM and Aster GDEM wi...
Evaluation of Morphometric Parameters Derived from CartoDEM and Aster GDEM wi...Evaluation of Morphometric Parameters Derived from CartoDEM and Aster GDEM wi...
Evaluation of Morphometric Parameters Derived from CartoDEM and Aster GDEM wi...
 
1 ijsrms 02516 (1)
1 ijsrms 02516 (1)1 ijsrms 02516 (1)
1 ijsrms 02516 (1)
 
2018 GIS in Education: GIS Watershed Delineation and Morphometric Analysis of...
2018 GIS in Education: GIS Watershed Delineation and Morphometric Analysis of...2018 GIS in Education: GIS Watershed Delineation and Morphometric Analysis of...
2018 GIS in Education: GIS Watershed Delineation and Morphometric Analysis of...
 
Morphometric Analysis of Warana Basin using GIS and Remote Sensing Techniques
Morphometric Analysis of Warana Basin using GIS and Remote Sensing TechniquesMorphometric Analysis of Warana Basin using GIS and Remote Sensing Techniques
Morphometric Analysis of Warana Basin using GIS and Remote Sensing Techniques
 
Remote sensing and GIS in the morphometric analysis of macro-watersheds for h...
Remote sensing and GIS in the morphometric analysis of macro-watersheds for h...Remote sensing and GIS in the morphometric analysis of macro-watersheds for h...
Remote sensing and GIS in the morphometric analysis of macro-watersheds for h...
 
WATERSHED PRIORITIZATION IN RELATION TO SOIL EROSION USING GEOSPATIAL TECHNIQ...
WATERSHED PRIORITIZATION IN RELATION TO SOIL EROSION USING GEOSPATIAL TECHNIQ...WATERSHED PRIORITIZATION IN RELATION TO SOIL EROSION USING GEOSPATIAL TECHNIQ...
WATERSHED PRIORITIZATION IN RELATION TO SOIL EROSION USING GEOSPATIAL TECHNIQ...
 
CFD modeling
CFD modelingCFD modeling
CFD modeling
 
Morphometric analysis of a Semi Urban Watershed, trans Yamuna, draining at Al...
Morphometric analysis of a Semi Urban Watershed, trans Yamuna, draining at Al...Morphometric analysis of a Semi Urban Watershed, trans Yamuna, draining at Al...
Morphometric analysis of a Semi Urban Watershed, trans Yamuna, draining at Al...
 
2 ijsrms-02753
2 ijsrms-027532 ijsrms-02753
2 ijsrms-02753
 
IRJET- Quantitative Morphometric Analysis of a Manganga Basin, Maharashtr...
IRJET-  	  Quantitative Morphometric Analysis of a Manganga Basin, Maharashtr...IRJET-  	  Quantitative Morphometric Analysis of a Manganga Basin, Maharashtr...
IRJET- Quantitative Morphometric Analysis of a Manganga Basin, Maharashtr...
 
IRJET- A Review of Synthetic Hydrograph Methods for Design Storm
IRJET-  	  A Review of Synthetic Hydrograph Methods for Design StormIRJET-  	  A Review of Synthetic Hydrograph Methods for Design Storm
IRJET- A Review of Synthetic Hydrograph Methods for Design Storm
 

More from Mohammed Badiuddin Parvez

Estimation of Crop water Requirement for Kolar Taluk Sub watershed
Estimation of Crop water Requirement for Kolar Taluk Sub watershed Estimation of Crop water Requirement for Kolar Taluk Sub watershed
Estimation of Crop water Requirement for Kolar Taluk Sub watershed Mohammed Badiuddin Parvez
 
Derivation Of Intensity Duration Frequency Curves Using Short Duration Rainfa...
Derivation Of Intensity Duration Frequency Curves Using Short Duration Rainfa...Derivation Of Intensity Duration Frequency Curves Using Short Duration Rainfa...
Derivation Of Intensity Duration Frequency Curves Using Short Duration Rainfa...Mohammed Badiuddin Parvez
 
Modelling of Short Duration Isopluvial Map For Raichur District Karnataka Moh...
Modelling of Short Duration Isopluvial Map For Raichur District Karnataka Moh...Modelling of Short Duration Isopluvial Map For Raichur District Karnataka Moh...
Modelling of Short Duration Isopluvial Map For Raichur District Karnataka Moh...Mohammed Badiuddin Parvez
 
Generation of short_duration_isohyetal_maps_for_raichur_district_karnataka_ij...
Generation of short_duration_isohyetal_maps_for_raichur_district_karnataka_ij...Generation of short_duration_isohyetal_maps_for_raichur_district_karnataka_ij...
Generation of short_duration_isohyetal_maps_for_raichur_district_karnataka_ij...Mohammed Badiuddin Parvez
 
Generation of intensity_duration_frequency_curves_for manvi taluk raichur dis...
Generation of intensity_duration_frequency_curves_for manvi taluk raichur dis...Generation of intensity_duration_frequency_curves_for manvi taluk raichur dis...
Generation of intensity_duration_frequency_curves_for manvi taluk raichur dis...Mohammed Badiuddin Parvez
 
Assesment of groundwater_potential_zones_for_bruhat_bangalore_mahanagara_pali...
Assesment of groundwater_potential_zones_for_bruhat_bangalore_mahanagara_pali...Assesment of groundwater_potential_zones_for_bruhat_bangalore_mahanagara_pali...
Assesment of groundwater_potential_zones_for_bruhat_bangalore_mahanagara_pali...Mohammed Badiuddin Parvez
 

More from Mohammed Badiuddin Parvez (19)

24 cej-2795.f
24 cej-2795.f24 cej-2795.f
24 cej-2795.f
 
29 cej-2730.f
29 cej-2730.f29 cej-2730.f
29 cej-2730.f
 
11 isroset-ijsrms-02993
11 isroset-ijsrms-0299311 isroset-ijsrms-02993
11 isroset-ijsrms-02993
 
5 wajes-02738
5 wajes-027385 wajes-02738
5 wajes-02738
 
4 wajes-02828
4 wajes-028284 wajes-02828
4 wajes-02828
 
4 wajes-02687
4 wajes-026874 wajes-02687
4 wajes-02687
 
3 ijsrmss-02686-paid
3 ijsrmss-02686-paid3 ijsrmss-02686-paid
3 ijsrmss-02686-paid
 
A4410119119
A4410119119A4410119119
A4410119119
 
Pstj 1342
Pstj 1342Pstj 1342
Pstj 1342
 
16 ijsrms-02614 (1)
16 ijsrms-02614 (1)16 ijsrms-02614 (1)
16 ijsrms-02614 (1)
 
5 ijsrms-02617 (1)
5 ijsrms-02617 (1)5 ijsrms-02617 (1)
5 ijsrms-02617 (1)
 
Multi criteria decision-making-analysis
Multi criteria decision-making-analysisMulti criteria decision-making-analysis
Multi criteria decision-making-analysis
 
Aam talab
Aam talabAam talab
Aam talab
 
Estimation of Crop water Requirement for Kolar Taluk Sub watershed
Estimation of Crop water Requirement for Kolar Taluk Sub watershed Estimation of Crop water Requirement for Kolar Taluk Sub watershed
Estimation of Crop water Requirement for Kolar Taluk Sub watershed
 
Derivation Of Intensity Duration Frequency Curves Using Short Duration Rainfa...
Derivation Of Intensity Duration Frequency Curves Using Short Duration Rainfa...Derivation Of Intensity Duration Frequency Curves Using Short Duration Rainfa...
Derivation Of Intensity Duration Frequency Curves Using Short Duration Rainfa...
 
Modelling of Short Duration Isopluvial Map For Raichur District Karnataka Moh...
Modelling of Short Duration Isopluvial Map For Raichur District Karnataka Moh...Modelling of Short Duration Isopluvial Map For Raichur District Karnataka Moh...
Modelling of Short Duration Isopluvial Map For Raichur District Karnataka Moh...
 
Generation of short_duration_isohyetal_maps_for_raichur_district_karnataka_ij...
Generation of short_duration_isohyetal_maps_for_raichur_district_karnataka_ij...Generation of short_duration_isohyetal_maps_for_raichur_district_karnataka_ij...
Generation of short_duration_isohyetal_maps_for_raichur_district_karnataka_ij...
 
Generation of intensity_duration_frequency_curves_for manvi taluk raichur dis...
Generation of intensity_duration_frequency_curves_for manvi taluk raichur dis...Generation of intensity_duration_frequency_curves_for manvi taluk raichur dis...
Generation of intensity_duration_frequency_curves_for manvi taluk raichur dis...
 
Assesment of groundwater_potential_zones_for_bruhat_bangalore_mahanagara_pali...
Assesment of groundwater_potential_zones_for_bruhat_bangalore_mahanagara_pali...Assesment of groundwater_potential_zones_for_bruhat_bangalore_mahanagara_pali...
Assesment of groundwater_potential_zones_for_bruhat_bangalore_mahanagara_pali...
 

Recently uploaded

Effects of rheological properties on mixing
Effects of rheological properties on mixingEffects of rheological properties on mixing
Effects of rheological properties on mixingviprabot1
 
VICTOR MAESTRE RAMIREZ - Planetary Defender on NASA's Double Asteroid Redirec...
VICTOR MAESTRE RAMIREZ - Planetary Defender on NASA's Double Asteroid Redirec...VICTOR MAESTRE RAMIREZ - Planetary Defender on NASA's Double Asteroid Redirec...
VICTOR MAESTRE RAMIREZ - Planetary Defender on NASA's Double Asteroid Redirec...VICTOR MAESTRE RAMIREZ
 
Gurgaon ✡️9711147426✨Call In girls Gurgaon Sector 51 escort service
Gurgaon ✡️9711147426✨Call In girls Gurgaon Sector 51 escort serviceGurgaon ✡️9711147426✨Call In girls Gurgaon Sector 51 escort service
Gurgaon ✡️9711147426✨Call In girls Gurgaon Sector 51 escort servicejennyeacort
 
Work Experience-Dalton Park.pptxfvvvvvvv
Work Experience-Dalton Park.pptxfvvvvvvvWork Experience-Dalton Park.pptxfvvvvvvv
Work Experience-Dalton Park.pptxfvvvvvvvLewisJB
 
Architect Hassan Khalil Portfolio for 2024
Architect Hassan Khalil Portfolio for 2024Architect Hassan Khalil Portfolio for 2024
Architect Hassan Khalil Portfolio for 2024hassan khalil
 
EduAI - E learning Platform integrated with AI
EduAI - E learning Platform integrated with AIEduAI - E learning Platform integrated with AI
EduAI - E learning Platform integrated with AIkoyaldeepu123
 
Artificial-Intelligence-in-Electronics (K).pptx
Artificial-Intelligence-in-Electronics (K).pptxArtificial-Intelligence-in-Electronics (K).pptx
Artificial-Intelligence-in-Electronics (K).pptxbritheesh05
 
UNIT III ANALOG ELECTRONICS (BASIC ELECTRONICS)
UNIT III ANALOG ELECTRONICS (BASIC ELECTRONICS)UNIT III ANALOG ELECTRONICS (BASIC ELECTRONICS)
UNIT III ANALOG ELECTRONICS (BASIC ELECTRONICS)Dr SOUNDIRARAJ N
 
Introduction-To-Agricultural-Surveillance-Rover.pptx
Introduction-To-Agricultural-Surveillance-Rover.pptxIntroduction-To-Agricultural-Surveillance-Rover.pptx
Introduction-To-Agricultural-Surveillance-Rover.pptxk795866
 
Call Girls Narol 7397865700 Independent Call Girls
Call Girls Narol 7397865700 Independent Call GirlsCall Girls Narol 7397865700 Independent Call Girls
Call Girls Narol 7397865700 Independent Call Girlsssuser7cb4ff
 
complete construction, environmental and economics information of biomass com...
complete construction, environmental and economics information of biomass com...complete construction, environmental and economics information of biomass com...
complete construction, environmental and economics information of biomass com...asadnawaz62
 
Application of Residue Theorem to evaluate real integrations.pptx
Application of Residue Theorem to evaluate real integrations.pptxApplication of Residue Theorem to evaluate real integrations.pptx
Application of Residue Theorem to evaluate real integrations.pptx959SahilShah
 
CCS355 Neural Network & Deep Learning Unit II Notes with Question bank .pdf
CCS355 Neural Network & Deep Learning Unit II Notes with Question bank .pdfCCS355 Neural Network & Deep Learning Unit II Notes with Question bank .pdf
CCS355 Neural Network & Deep Learning Unit II Notes with Question bank .pdfAsst.prof M.Gokilavani
 
Software and Systems Engineering Standards: Verification and Validation of Sy...
Software and Systems Engineering Standards: Verification and Validation of Sy...Software and Systems Engineering Standards: Verification and Validation of Sy...
Software and Systems Engineering Standards: Verification and Validation of Sy...VICTOR MAESTRE RAMIREZ
 
Electronically Controlled suspensions system .pdf
Electronically Controlled suspensions system .pdfElectronically Controlled suspensions system .pdf
Electronically Controlled suspensions system .pdfme23b1001
 
Gfe Mayur Vihar Call Girls Service WhatsApp -> 9999965857 Available 24x7 ^ De...
Gfe Mayur Vihar Call Girls Service WhatsApp -> 9999965857 Available 24x7 ^ De...Gfe Mayur Vihar Call Girls Service WhatsApp -> 9999965857 Available 24x7 ^ De...
Gfe Mayur Vihar Call Girls Service WhatsApp -> 9999965857 Available 24x7 ^ De...srsj9000
 

Recently uploaded (20)

Effects of rheological properties on mixing
Effects of rheological properties on mixingEffects of rheological properties on mixing
Effects of rheological properties on mixing
 
VICTOR MAESTRE RAMIREZ - Planetary Defender on NASA's Double Asteroid Redirec...
VICTOR MAESTRE RAMIREZ - Planetary Defender on NASA's Double Asteroid Redirec...VICTOR MAESTRE RAMIREZ - Planetary Defender on NASA's Double Asteroid Redirec...
VICTOR MAESTRE RAMIREZ - Planetary Defender on NASA's Double Asteroid Redirec...
 
Gurgaon ✡️9711147426✨Call In girls Gurgaon Sector 51 escort service
Gurgaon ✡️9711147426✨Call In girls Gurgaon Sector 51 escort serviceGurgaon ✡️9711147426✨Call In girls Gurgaon Sector 51 escort service
Gurgaon ✡️9711147426✨Call In girls Gurgaon Sector 51 escort service
 
young call girls in Rajiv Chowk🔝 9953056974 🔝 Delhi escort Service
young call girls in Rajiv Chowk🔝 9953056974 🔝 Delhi escort Serviceyoung call girls in Rajiv Chowk🔝 9953056974 🔝 Delhi escort Service
young call girls in Rajiv Chowk🔝 9953056974 🔝 Delhi escort Service
 
Work Experience-Dalton Park.pptxfvvvvvvv
Work Experience-Dalton Park.pptxfvvvvvvvWork Experience-Dalton Park.pptxfvvvvvvv
Work Experience-Dalton Park.pptxfvvvvvvv
 
Architect Hassan Khalil Portfolio for 2024
Architect Hassan Khalil Portfolio for 2024Architect Hassan Khalil Portfolio for 2024
Architect Hassan Khalil Portfolio for 2024
 
EduAI - E learning Platform integrated with AI
EduAI - E learning Platform integrated with AIEduAI - E learning Platform integrated with AI
EduAI - E learning Platform integrated with AI
 
Artificial-Intelligence-in-Electronics (K).pptx
Artificial-Intelligence-in-Electronics (K).pptxArtificial-Intelligence-in-Electronics (K).pptx
Artificial-Intelligence-in-Electronics (K).pptx
 
Design and analysis of solar grass cutter.pdf
Design and analysis of solar grass cutter.pdfDesign and analysis of solar grass cutter.pdf
Design and analysis of solar grass cutter.pdf
 
UNIT III ANALOG ELECTRONICS (BASIC ELECTRONICS)
UNIT III ANALOG ELECTRONICS (BASIC ELECTRONICS)UNIT III ANALOG ELECTRONICS (BASIC ELECTRONICS)
UNIT III ANALOG ELECTRONICS (BASIC ELECTRONICS)
 
Introduction-To-Agricultural-Surveillance-Rover.pptx
Introduction-To-Agricultural-Surveillance-Rover.pptxIntroduction-To-Agricultural-Surveillance-Rover.pptx
Introduction-To-Agricultural-Surveillance-Rover.pptx
 
Call Girls Narol 7397865700 Independent Call Girls
Call Girls Narol 7397865700 Independent Call GirlsCall Girls Narol 7397865700 Independent Call Girls
Call Girls Narol 7397865700 Independent Call Girls
 
complete construction, environmental and economics information of biomass com...
complete construction, environmental and economics information of biomass com...complete construction, environmental and economics information of biomass com...
complete construction, environmental and economics information of biomass com...
 
Application of Residue Theorem to evaluate real integrations.pptx
Application of Residue Theorem to evaluate real integrations.pptxApplication of Residue Theorem to evaluate real integrations.pptx
Application of Residue Theorem to evaluate real integrations.pptx
 
CCS355 Neural Network & Deep Learning Unit II Notes with Question bank .pdf
CCS355 Neural Network & Deep Learning Unit II Notes with Question bank .pdfCCS355 Neural Network & Deep Learning Unit II Notes with Question bank .pdf
CCS355 Neural Network & Deep Learning Unit II Notes with Question bank .pdf
 
Software and Systems Engineering Standards: Verification and Validation of Sy...
Software and Systems Engineering Standards: Verification and Validation of Sy...Software and Systems Engineering Standards: Verification and Validation of Sy...
Software and Systems Engineering Standards: Verification and Validation of Sy...
 
Electronically Controlled suspensions system .pdf
Electronically Controlled suspensions system .pdfElectronically Controlled suspensions system .pdf
Electronically Controlled suspensions system .pdf
 
POWER SYSTEMS-1 Complete notes examples
POWER SYSTEMS-1 Complete notes  examplesPOWER SYSTEMS-1 Complete notes  examples
POWER SYSTEMS-1 Complete notes examples
 
Gfe Mayur Vihar Call Girls Service WhatsApp -> 9999965857 Available 24x7 ^ De...
Gfe Mayur Vihar Call Girls Service WhatsApp -> 9999965857 Available 24x7 ^ De...Gfe Mayur Vihar Call Girls Service WhatsApp -> 9999965857 Available 24x7 ^ De...
Gfe Mayur Vihar Call Girls Service WhatsApp -> 9999965857 Available 24x7 ^ De...
 
young call girls in Green Park🔝 9953056974 🔝 escort Service
young call girls in Green Park🔝 9953056974 🔝 escort Serviceyoung call girls in Green Park🔝 9953056974 🔝 escort Service
young call girls in Green Park🔝 9953056974 🔝 escort Service
 

6 ijsrms-02616 (1)

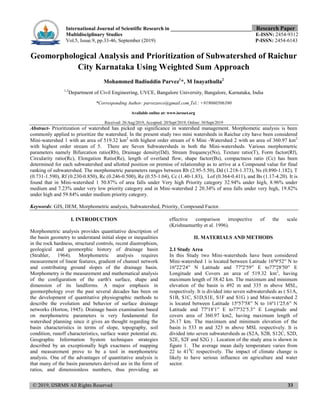
  • 1. © 2019, IJSRMS All Rights Reserved 33 International Journal of Scientific Research in _______________________________ Research Paper . Multidisciplinary Studies E-ISSN: 2454-9312 Vol.5, Issue.9, pp.33-46, September (2019) P-ISSN: 2454-6143 Geomorphological Analysis and Prioritization of Subwatershed of Raichur City Karnataka Using Weighted Sum Approach Mohammed Badiuddin Parvez1 *, M Inayathulla2 1,2 Department of Civil Engineering, UVCE, Bangalore University, Bangalore, Karnataka, India *Corresponding Author: parvezuvce@gmail.com Tel.: +919060506390 Available online at: www.isroset.org Received: 26/Aug/2019, Accepted: 20/Sept/2019, Online: 30/Sept/2019 Abstract- Prioritization of watershed has picked up significance in watershed management. Morphometic analysis is been commonly applied to prioritize the watershed. In the present study two mini watersheds in Raichur city have been considered Mini-watershed 1 with an area of 519.32 km2 with highest order stream of 6 Mini -Watershed 2 with an area of 360.97 km2 with highest order stream of 5. There are Seven Subwatersheds in both the Mini-watersheds. Various morphometric parameters namely Bifurcation ratio(Rb), Drainage density(Dd), Stream frequency(Ns), Texture ratio(T), Form factor(Rf), Circularity ratio(Rc), Elongation Ratio(Re), length of overland flow, shape factor(Bs), compactness ratio (Cc) has been determined for each subwatershed and allotted position on premise of relationship as to arrive at a Compound value for final ranking of subwatershed. The morphometric parameters ranges between Rb (2.95-5.50), Dd (1.218-1.373), Ns (0.890-1.182), T (0.731-1.590), Rf (0.230-0.850), Rc (0.246-0.500), Re (0.55-1.04), Cc (1.40-1.83), Lof (0.364-0.411), and Bs (1.17-4.20). It is found that in Mini-watershed 1 50.87% of area falls under Very high Priority category 32.94% under high, 8.96% under medium and 7.23% under very low priority category and in Mini-watershed 2 20.34% of area falls under very high, 19.82% under high and 59.84% under medium priority category. Keywords: GIS, DEM, Morphometric analysis, Subwatershed, Priority, Compound Factor. I. INTRODUCTION Morphometric analysis provides quantitative description of the basin geometry to understand initial slope or inequalities in the rock hardness, structural controls, recent diastrophism, geological and geomorphic history of drainage basin (Strahler, 1964). Morphometric analysis requires measurement of linear features, gradient of channel network and contributing ground slopes of the drainage basin. Morphometry is the measurement and mathematical analysis of the configuration of the earth's surface, shape and dimension of its landforms. A major emphasis in geomorphology over the past several decades has been on the development of quantitative physiographic methods to describe the evolution and behavior of surface drainage networks (Horton, 1945). Drainage basin examination based on morphometric parameters is very fundamental for watershed planning since it gives an thought regarding the basin characteristics in terms of slope, topography, soil condition, runoff characteristics, surface water potential etc. Geographic Information System techniques strategies described by an exceptionally high exactness of mapping and measurement prove to be a tool in morphometric analysis. One of the advantages of quantitative analysis is that many of the basin parameters derived are in the form of ratios, and dimensionless numbers, thus providing an effective comparison irrespective of the scale (Krishnamurthy et al. 1996). II. MATERIALS AND METHODS 2.1 Study Area In this Study two Mini-watersheds have been considered Mini-watershed 1 is located between Latitude 16º9′52′′ N to 16º22′24′′ N Latitude and 77º2′59′′ E to77º28′50′′ E Longitude and Covers an area of 519.32 km2 , having maximum length of 38.42 km. The maximum and minimum elevation of the basin is 492 m and 335 m above MSL, respectively. It is divided into seven subwatersheds as ( S1A, S1B, S1C, S1D,S1E, S1F and S1G ) and Mini-watershed 2 is located between Latitude 15º57′58′′ N to 16º11′25.6′′ N Latitude and 77º18′1′′ E to77º32′5.3′′ E Longitude and covers area of 360.97 km2, having maximum length of 26.17 km. The maximum and minimum elevation of the basin is 533 m and 323 m above MSL respectively. It is divided into seven subwatersheds as (S2A, S2B, S12C, S2D, S2E, S2F and S2G ) . Location of the study area is shown in figure 1. The average mean daily temperature varies from 22 to 410 C respectively. The impact of climate change is likely to have serious influence on agriculture and water sector.
  • 2. Int. J. Sci. Res. in Multidisciplinary Studies Vol. 5(9), Sept 2019 © 2019, IJSRMS All Rights Reserved 34 2.2 Methodology By using SRTM DEM data, basin was delineated and the drainage network was extracted. Initially the sink or depression area in DEM is been filled to get rid of small uneveness in the data. Then on basis of relative slopes between pixels flow direction is determined. Flow accumulation grid has been prepared using this data. Stream order was generated using above data on the basis of drainage flow direction watershed was divided into seven subwatersheds designated as ( S1A, S1B, S1C, S1D,S1E, S1F and S1G ) and ( S2A, S2B, S12C, S2D, S2E, S2F and S2G ) for Mini waterhed 1 and 2 respectively as show in figure 2 and 3. Morphometric aspects such as Bifurcation ratio(Rb), Drainage density(Dd), Stream frequency(Ns), Texture ratio(T), Form factor(Rf), Circularity ratio(Rc), Elongation Ratio(Re), length of overland flow, shape factor(Bs), drainage texture, compactness ratio(Cc) is calculated using formulas shown in table. Figure 1 location map of study area Figure 2 Stream order map The total Area (A), Perimeter (P) of Seven subwatersheds of both is calculated using Arc GIS and values are tabulated in table 2. III. RESULTS AND DISCUSSIONS 3.1 Morphometric analysis Designation of Stream order is the basic step in morphometric analysis of a drainage basin, based on the hierarchic making of streams proposed by Strahler (1964). The highest order stream in the study area is 6th order. The morphometric parameters were calculated its shows that Bifurcation ratio (Rb) ranges from 2.95 to 5.50 S1G have low Rb whereas S2A have high Rb. Drainage density (Dd) is low in S1C and high in S2D its value ranges from 1.218 to 1.373. Stream frequency (Ns) varies from 0.890 to 1.182 with S2F having low and S1B has high value. Texture ratio (T) ranges from 0.731 to 1.590 with low in S2G and high in S1A. Form factor (Rf) is low in S2G and high in S2B it ranges from 0.230 to 0.850. Length of overland flow varies from 0.364 to 0.411 with low in S2D and high in S1C. Basin shape(Bs) is low in S2B and high in S2G it ranges from 1.17 to 4.20. Compactness coefficient(Cc) show wide variation across the subwatershed it is more in S2B and less in S1E it varies from 1.40 to 1.83. Elongation ratio(Re) varies from 0.55 to 1.04 with S2G has low and S2B has high value. Circularity ratio(Rc) of subwatersheds ranges from 0.246 to 0.500 with low in S2G and high in S2B. The Tabulated results are shown in Table 4. Linear morphometric characteristics is shown in table 3. Figure 3 Subwatershed map
  • 3. Int. J. Sci. Res. in Multidisciplinary Studies Vol. 5(9), Sept 2019 © 2019, IJSRMS All Rights Reserved 35 Table 1: Formula adopted for computation of morphometric parameters for the study area Table 2 : Subwatersheds of Cauvery Catchment Subwatersheds Area(km2 ) Perimeter(km) Length(km) Width(km) S1A 131.66 71.41 21.49 7.35 S1B 60.05 44.97 12.31 6.42 S1C 46.57 42.58 12.37 5.04 S1D 87.63 51.88 13.10 7.88 S1E 83.4 59.2 13.25 6.85 S1F 72.47 54.75 12.42 6.63 S1G 37.55 36.71 8.05 6.97 S2A 34.83 33.72 8.90 4.50 S2B 72.6 42.73 9.24 10.25 S2C 38.18 38.48 11.3 3.98 S2D 52.96 42.38 12.7 4.95 S2E 55.53 51.5 11.2 8.28 S2F 71.51 59.54 15.08 6.21 S2G 35.22 42.39 12.17 3.24 Sl no Morphometric parameters Formula Refrence 1 Stream order Hierarchial rank Strahler (1964) 2 Stream length (Lu) Length of the stream Horton (1945 3 Mean stream length (Lsm) Lsm = ? Lu / Nu Strahler (1964) Where, Lsm = Mean stream length Lu = Total stream length of order 'u' Nu = Total no. of stream segments of order 'u' 4 Stream length ratio (RL RL = Lu / Lu – 1 Horton (1945) Where, RL = Stream length ratio Lu = The total stream length of the order 'u' Lu – 1 = The total stream length of its next lower order 5 Bifurcation ratio (Rb) Rb = Nu / Nu + 1 Schumn (1956) Where, Rb = Bifurcation ratio Nu = Total no. of stream segments of order 'u' Nu + 1 = Number of segments of the next higher order 6 Relief ratio (Rh) Rh = H / Lb Where, Rh = Relief ratio Schumn (1956)H = Total relief (Relative relief) of the basin (km) Lb = Basin length 7 Drainage density (D) D = Lu / A Horton (1932) Where, D = Drainage density Lu = Total stream len gth of all orders A = Area of the basin (Sq km) 8 Stream frequency (Fs) Fs = Nu / A Horton (1932) Where, Fs = Stream frequency Ns = Total no. of streams segments A = Area of the basin (Sq km) 9 Form factor (Rf) Rf = A / Lb Horton (1932) Where, Rf = Form factor A = Area of the basin (Sq km) Lb = basin length 10 Circularity ratio (Rc) Rc = (4 * Pi * A)1/2 / P² Miller (1953) Where, Rc = Circularity ratio Pi = 'Pi' value i.e., 3.14 A = Area of the basin (Sq km) P² = Square of the perimeter (km) 11 Elongation ratio (Re) Re = 2 (A/Pi)½ / Lb Schumn (1956) Where, Re = Elongation ratio A = Area of the basin (Sq km) Pi = 'Pi' value i.e., 3.14 and Lb = Basin length
  • 4. Int. J. Sci. Res. in Multidisciplinary Studies Vol. 5(9), Sept 2019 © 2019, IJSRMS All Rights Reserved 36 Figure 4 Percentage area distribution of Subwatershed Table 3: Linear Morphometric Characteristics of Subwatersheds in Miniwatershed 1 Subwatershed Stream order No of Streams Total length of Streams (km) Cumulative Length(km) Mean Stream Length(km) Bifurcation Ratio Length Ratio S1A 1 114 88.78 88.78 0.78 2 25 34.75 123.53 1.39 4.56 1.78 3 6 25.72 149.25 4.29 4.16 3.08 4 2 9.24 158.49 4.62 3 1.08 5 1 2.69 161.18 2.69 2 0.58 S1B 1 57 40.17 40.17 0.70 2 10 17.34 57.51 1.73 5.70 2.46 3 3 11.39 68.90 3.80 3.333 2.19 4 1 7.54 76.44 7.54 3 1.99 S1C 1 39 26.80 26.80 0.69 2 8 12.91 39.71 1.61 4.88 2.35 3 2 12.39 52.10 6.20 4 3.84 4 1 4.60 56.70 4.60 2 0.74 S1D 1 65 66.45 66.45 1.02 2 18 27.06 93.51 1.50 3.61 1.47 3 4 22.10 115.61 5.53 4.5 3.68 4 1 4.16 119.77 4.16 4 0.75 S1E 1 70 53.50 53.50 0.76 2 16 19.54 73.04 1.22 4.38 1.60 3 2 6.64 79.68 3.32 8 2.72 4 2 2.78 82.46 1.39 1 0.42 5 2 7.83 90.29 3.92 1 2.82 6 1 12.12 102.41 12.12 2 3.10 S1F 1 54 43.68 43.68 0.81 2 15 23.14 66.82 1.54 3.60 1.91 3 2 14.58 81.40 7.29 7.5 4.73 4 1 7.84 89.24 7.84 2 1.08 1 30 19.63 19.63 0.65 2 8 14.22 33.85 1.78 3.75 2.72
  • 5. Int. J. Sci. Res. in Multidisciplinary Studies Vol. 5(9), Sept 2019 © 2019, IJSRMS All Rights Reserved 37 S1G 3 1 0.52 34.37 0.52 8 0.29 4 1 4.70 39.07 4.70 1 9.04 5 0 0.00 39.07 - - - 6 1 6.50 45.57 6.50 - - Table 4: Linear Morphometric Characteristics of Subwatersheds in Miniwatershed 2 Subwatershed Stream order No of Streams Total length of Streams (km) Cumulative Length(km) Mean Stream Length(km) Bifurcation Ratio Length Ratio S2A 1 28 24.08 24.08 0.86 2 4 14.13 38.21 3.53 7.00 4.11 3 1 5.94 44.15 5.94 4 1.68 S2B 1 66 48.76 48.76 0.74 2 13 27.93 76.69 2.15 5.08 2.91 3 3 12.49 89.18 4.16 4.333333333 1.94 4 1 2.31 91.49 2.31 3 0.55 S2C 1 34 25.41 25.41 0.75 2 7 10.60 36.01 1.51 4.86 2.03 3 2 12.14 48.15 6.07 3.5 4.01 4 1 0.63 48.78 0.63 2 0.10 S2D 1 43 36.94 36.94 0.86 2 9 24.01 60.95 2.67 4.78 3.11 3 2 7.22 68.17 3.61 4.5 1.35 4 1 4.55 72.72 4.55 2 1.26 S2E 1 49 37.08 37.08 0.76 2 7 18.50 55.58 2.64 7.00 3.49 3 1 5.30 60.88 5.30 7 2.01 4 2 3.04 63.92 1.52 0.5 0.29 5 1 9.01 72.93 9.01 2 5.93 S2F 1 53 53.03 53.03 1.00 2 9 17.15 70.18 1.91 5.89 1.90 3 1 10.48 80.66 10.48 9 5.50 4 1 17.23 97.89 17.23 1 1.64 S2G 1 31 25.64 25.64 0.83 2 5 5.97 31.61 1.19 6.20 1.44 3 1 8.13 39.74 8.13 5 6.81 4 1 0.28 40.02 0.28 1 0.03 5 1 5.06 45.08 5.06 1 18.07 Figure 5 Bifurcation Ratio
  • 6. Int. J. Sci. Res. in Multidisciplinary Studies Vol. 5(9), Sept 2019 © 2019, IJSRMS All Rights Reserved 38 3.2 Priortization of subwatersheds Morphometric aspects such as Bifurcation ratio (Rb), Drainage density (Dd), Stream frequency (Ns), Texture ratio (T), Form factor (Rf), Circularity ratio (Rc), Elongation Ratio (Re), length of overland flow, Basin Shape (Bs), compactness ratio(Cc) are also termed as erosin risk assessment parameters and have been used for prioritizing subwatersheds (Biswas et al 1999). The preliminary priority ranking of sub-watersheds was done on the basis of morphological characteristics the parameters such as Bifurcation ratio(Rb), Stream frequency (Ns), Drainage density(Dd), Texture ratio(T), have a direct relationship with erodibility higher values of all these have been have been given rank 1 second largest is rated as rank 2 and so on with the least ranked last in each of the mini watersheds. Parameters such as Form factor (Rf), Circularity ratio (Rc), Elongation Ratio (Re), Basin Shape (Bs) have inverse relationship with the erodibility higher the value less is erosion lower the value high is erodibility. In this manner least estimations of this is appraised as rank 1 and second least been rated as rank 2 and so on and the highest values is given last rank. The final priority ranking and related categorization were made on the basis of the compound factor value, which was computed by multiplying the ranks from morphometric analysis and their weights obtained using cross-correlation analysis of these parameters to give compound factor for final prioritization of sub-watersheds. The compound factor is calculated using equation 1. CF= PPRmp x Wmp (1) Where CF is compound factor, PPRmp is the preliminary priority rank based on morphometric parameter, and Wmp is the weight of morphometric parameter obtained using cross correlation analysis. Based on final value of compound factor Subwatershed with least rating was assigned highest rank next value was assigned second rank and so on and the subwatershed with highest compound value was assigned last rank. 3.2.1 Prioritization of sub-watershed based on weighted sum approach The cross-correlation analysis among various morphometric parameters (Table 6 and 7) was performed and tested at 5% level of significance. The priority ranks of sub-watersheds were determined on the basis of compound factor (Table 6), which was calculated using Eq.1.The value of weights assigned to a morphometric parameter was calculated by dividing the sum of correlation coefficient of each parameter by the grand total of correlations (Table 6 and 7). By assigning the weights to different parameters, a model was formulated to assess the final priority ranking. The compound factor form mini- watershed 1 prioritization was computed as follows: Compound factor =(0.2088*PPR of Rbm)+(0.4209*PPR of Dd)-(0.432*PPR of LOF)- (0.3445*PPR of Cc)+(0.3617*PPR of Rc)+(0.1195*PPR of Ns)+(0.1508*PPR of Rf)-(0.2329*PPR of Bs)+(0.2296*PPR of Re)+(0.5188*PPR of T) . The final priority ranking was made in such a way that the lowest value of compound factor was given the priority rank of 1, the next lower value was given priority rank of 2, and so on for all the sub-watersheds. Figure 10 shows the final priority ranking map of 14 sub-watersheds under study. Based on the compound factor value, all the subwatersheds of both Mini-watersheds were classified into five priority categories such as (i) very high (0 to 2.5), (ii) high (2.5 to 5.0), (iii) medium (5.0 to 7.5), (iv) low (7.5 to 10.0), and (v) very low (>10.0) as given in Table 11 and 12. It was observed from Table 11 that the three sub-watersheds (S1A, S1B and S1F) were under very high category, two sub- watersheds (S1D and S1E) under high category, one sub- watersheds (S1C) under medium, and one sub-watershed (S1G) was under very low category. And from Table 12 that the two sub-watersheds (S2C and S2G) were under very high category, one sub-watersheds (S2F) under high category, four sub-watersheds (S2A, S2B, S2D and S2E) under medium. Table 5 Morphometric Parameters of Subwatersheds Sub Watershed Bifurcation Ratio Mean Drainage Density Length Of Overland Flow Compactness Coefficient Circularity Ratio Stream Frequency Form Factor Elongation Ratio Shape Factor Texture Ratio S1A 3.43 1.224 0.408 1.761 0.325 1.124 0.285 0.602 3.508 1.59 S1B 4 1.273 0.393 1.640 0.374 1.182 0.396 0.711 2.523 1.26 S1C 3.62 1.218 0.411 1.760 0.323 1.074 0.304 0.622 3.286 0.91 S1D 4.03 1.367 0.366 1.560 0.41 1.004 0.511 0.866 1.958 1.25 S1E 3.27 1.228 0.407 1.830 0.299 1.115 0.475 0.777 2.103 1.18 S1F 4.36 1.231 0.406 1.810 0.304 0.994 0.47 0.773 2.129 0.96 S1G 2.95 1.222 0.409 1.690 0.351 1.119 0.579 0.858 1.726 0.82 S2A 5.5 1.268 0.394 1.61 0.385 0.95 0.44 0.748 2.27 0.83 S2B 4.13 1.26 0.396 1.41 0.5 1.14 0.85 1.04 1.17 1.544
  • 7. Int. J. Sci. Res. in Multidisciplinary Studies Vol. 5(9), Sept 2019 © 2019, IJSRMS All Rights Reserved 39 S2C 3.45 1.277 0.391 1.76 0.324 1.15 0.299 0.616 3.34 0.883 S2D 3.76 1.373 0.364 1.64 0.37 1.03 0.328 0.646 3.04 1.014 S2E 4.12 1.313 0.38 1.95 0.263 1.08 0.442 0.75 2.26 0.951 S2F 5.29 1.368 0.365 1.99 0.253 0.89 0.314 0.632 3.18 0.89 S2G 3.3 1.28 0.39 2.01 0.246 1.1 0.23 0.55 4.2 0.731 Figure 6 Drainage density
  • 8. Int. J. Sci. Res. in Multidisciplinary Studies Vol. 5(9), Sept 2019 © 2019, IJSRMS All Rights Reserved 40
  • 9. Int. J. Sci. Res. in Multidisciplinary Studies Vol. 5(9), Sept 2019 © 2019, IJSRMS All Rights Reserved 41 Figure 7 Regression of stream order vs No of Streams
  • 10. Int. J. Sci. Res. in Multidisciplinary Studies Vol. 5(9), Sept 2019 © 2019, IJSRMS All Rights Reserved 42 Figure 8 Regression of stream order vs mean stream length
  • 11. Int. J. Sci. Res. in Multidisciplinary Studies Vol. 5(9), Sept 2019 © 2019, IJSRMS All Rights Reserved 43 Table 6: Preliminary priority ranking of Mini-watershed 1 Subwatershed Bifurcation Ratio Mean DRAINAGE DENSITY LENGTH OF OVERLAND FLOW COMPACTNESS COEFFICIENT CIRCULARITY RATIO Stream Frequency Form Factor ELONGATION RATIO Shape Factor Texture Ratio S1A 1 6 2 2 6 6 5 5 3 6 S1B 3 7 1 1 7 2 7 7 1 1 S1C 6 5 3 4 4 1 2 2 6 5 S1D 5 1 7 3 5 5 4 4 4 2 S1E 4 3 5 5 3 4 6 6 2 3 S1F 2 2 6 6 2 7 3 3 5 4 S1G 7 4 4 7 1 3 1 1 7 7 Table 7: Preliminary priority ranking of Mini-watershed 2 Subwatershed Bifurcation Ratio Mean DRAINAGE DENSITY LENGTH OF OVERLAND FLOW COMPACTNESS COEFFICIENT CIRCULARITY RATIO Stream Frequency Form Factor ELONGATION RATIO Shape Factor Texture Ratio S2A 1 6 2 2 6 6 5 5 3 6 S2B 3 7 1 1 7 2 7 7 1 1 S2C 6 5 3 4 4 1 2 2 6 5 S2D 5 1 7 3 5 5 4 4 4 2 S2E 4 3 5 5 3 4 6 6 2 3 S2F 2 2 6 6 2 7 3 3 5 4 S2G 7 4 4 7 1 3 1 1 7 7 Table 8: Cross-correlation matrix between various parameters of mini watershed 1 Rbm Dd LOF Cc Rc Ns Rf Re Bf T Rbm 1.0000 0.4332 -0.4402 -0.1644 0.1769 -0.4973 -0.3141 -0.1696 0.1903 0.3935 Dd 0.4332 1.0000 -0.9995 -0.8282 0.8541 -0.3170 0.2110 0.4530 -0.2648 0.6843 LOF -0.4402 -0.9995 1.0000 0.8277 -0.8538 0.3033 -0.2194 -0.4591 0.2777 -0.6973 Cc -0.1644 -0.8282 0.8277 1.0000 -0.9986 -0.0332 -0.2094 -0.3791 0.1939 -0.4121 Rc 0.1769 0.8541 -0.8538 -0.9986 1.0000 0.0199 0.2166 0.3939 -0.2079 0.4527 Ns -0.4973 -0.3170 0.3033 -0.0332 0.0199 1.0000 -0.1483 -0.2690 0.1409 0.1490 Rf -0.3141 0.2110 -0.2194 -0.2094 0.2166 -0.1483 1.0000 0.9645 -0.9801 -0.0816
  • 12. Int. J. Sci. Res. in Multidisciplinary Studies Vol. 5(9), Sept 2019 © 2019, IJSRMS All Rights Reserved 44 Re -0.1696 0.4530 -0.4591 -0.3791 0.3939 -0.2690 0.9645 1.0000 -0.9585 0.0926 Bf 0.1903 -0.2648 0.2777 0.1939 -0.2079 0.1409 -0.9801 -0.9585 1.0000 -0.0699 T 0.3935 0.6843 -0.6973 -0.4121 0.4527 0.1490 -0.0816 0.0926 -0.0699 1.0000 Sum 0.6083 1.2261 -1.2607 -1.0036 1.0538 0.3482 0.4393 0.6688 -0.6784 1.5112 Grand Total 2.9130 2.9130 2.9130 2.9130 2.9130 2.9130 2.9130 2.9130 2.9130 2.9130 Weight 0.2088 0.4209 -0.4328 -0.3445 0.3617 0.1195 0.1508 0.2296 -0.2329 0.5188 Table 9: Cross-correlation matrix between various parameters of mini watershed 2 Rbm Dd LOF Cc Rc Ns Rf Re Bf T Rbm 1.0000 0.5342 -0.5390 0.1490 -0.0933 -0.8084 0.1785 0.2012 -0.3039 0.1713 Dd 0.5342 1.0000 -0.9996 0.2771 -0.3315 -0.8530 -0.4294 -0.3970 0.2242 -0.3059 LOF -0.5390 -0.9996 1.0000 -0.2949 0.3484 0.8554 0.4341 0.4006 -0.2246 0.3160 Cc 0.1490 0.2771 -0.2949 1.0000 -0.9893 -0.4446 -0.7654 -0.7527 0.7016 -0.8806 Rc -0.0933 -0.3315 0.3484 -0.9893 1.0000 0.4332 0.8370 0.8212 -0.7484 0.9295 Ns -0.8084 -0.8530 0.8554 -0.4446 0.4332 1.0000 0.3447 0.3269 -0.2215 0.2917 Rf 0.1785 -0.4294 0.4341 -0.7654 0.8370 0.3447 1.0000 0.9977 -0.9413 0.9698 Re 0.2012 -0.3970 0.4006 -0.7527 0.8212 0.3269 0.9977 1.0000 -0.9613 0.9652 Bf -0.3039 0.2242 -0.2246 0.7016 -0.7484 -0.2215 -0.9413 -0.9613 1.0000 -0.9171 T 0.1713 -0.3059 0.3160 -0.8806 0.9295 0.2917 0.9698 0.9652 -0.9171 1.0000 Sum 0.4896 -1.2809 1.2963 -1.9999 2.2068 0.9244 2.6258 2.6018 -2.3923 2.5399 Grand Total 7.0114 7.0114 7.0114 7.0114 7.0114 7.0114 7.0114 7.0114 7.0114 7.0114 Weight 0.0698 -0.1827 0.1849 -0.2852 0.3147 0.1318 0.3745 0.3711 -0.3412 0.3623 Table 10 : Final Priority Ranking Subwatersheds Name Compound factor Rank Subwatersheds Name Compound factor Rank S1A 1.0853 1 S2A 6.32865 6 S1B 1.4874 2 S2B 6.53433 7 S1C 6.1268 6 S2C 1.55998 2 S1D 4.3134 5 S2D 5.17446 4 S1E 2.9078 4 S2E 5.57464 5 S1F 1.9841 3 S2F 2.70167 3 S1G 10.0756 7 S2G 0.09799 1
  • 13. Int. J. Sci. Res. in Multidisciplinary Studies Vol. 5(9), Sept 2019 © 2019, IJSRMS All Rights Reserved 45 Figure 9 Priority Map Table 11: Priority category based on compound factor for mini-watershed 1 Sl No Priority Level Priority Category Subwatershed name % Area 1 0.0-2.5 Very High S1A, S1B,S1F 50.87 2 2.5-5.0 High S1D, S1E 32.94 3 5.0-7.5 Medium S1C 8.96 4 7.5-10.0 Low - - 5 >10.0 Very Low S1G 7.23 Table 12: Priority category based on compound factor for mini-watershed 2 Sl No Priority Level Priority Category Subwatershed name % Area 1 0.0-2.5 Very High S2C, S2G 20.34 2 2.5-5.0 High S2F 19.82 3 5.0-7.5 Medium S2A, S2B,S2D,S2E 59.84 4 7.5-10.0 Low - - 5 >10.0 Very Low - - Figure 10 Final priority category map
  • 14. Int. J. Sci. Res. in Multidisciplinary Studies Vol. 5(9), Sept 2019 © 2019, IJSRMS All Rights Reserved 46 IV. CONCLUSIONS The length of overland flow (lof) for majority of the subwatersheds in the present study is more than 0.30 hence they have longer flow paths associated with more infiltration and reduced runoff. Stream frequency (Ns) for present study is low demonstrating relatively a low runoff. Higher value of form factor (Rf) indicates wider basin and lower value indicates narrow basin. Drainage density varies from1.222 km/km2 to 1.373 km/km2 indicating subwatersheds fall under coarse and very coarse texture. From table 11 and 12 it can be found that the 50.87 % of area of mini-watershed 1 falls under very high priority category where as 20.34% of area of mini-watershed falls under this category. 8.96 % of area of mini-watershed 1 falls under Medium priority category where as 59.84 % of area of mini-watershed falls under this category. We can also conclude that in case of unavailability of soil maps this type of study could be used in selecting area for soil conservation measure. REFERENCES [1]. Horton R.E.(1945). Erosional Development of streams and their drainage basins, Hydro physical approach to quantitative morphology. Geological Society of American Bulletin. 56: 275-370. [2]. Mohammed Badiuddin Parvez, M Inayathulla “Prioritization Of Subwatersheds of Cauvery Region Based on Morphometric Analysis Using GIS”, International Journal for Research in Engineering Application & Management (IJREAM), Volume: 05 Issue: 01, April -2019. [3]. Mohammed Badiuddin Parvez, M Inayathulla “Modelling of Short Duration Isopluvial Map For Raichur District Karnataka”, International Journal for Science and Advance Research in Technology (IJSART), Volume: 05 Issue: 4, April -2019. [4]. Mohammed Badiuddin Parvez, and M .Inayathulla. "Morphometry, Hypsometry Analysis and Runoff Estimation of Aam Talab Watershed Raichur, Karnataka" International Journal Of Advance Research And Innovative Ideas In Education Volume 5 Issue 3 2019 Page 1713-1727 [5]. Mohammed Badiuddin Parvez, M Inayathulla, “Development of S Curve for Mini-Watershed of Raichur City Karnataka”, International Journal of Scientific Research in Multidisciplinary Studies , Vol.5, Issue.8, pp.1-11, 2019. [6]. Vijith, H and Sateesh, R. (2006). GIS based morphometric analysis of two major upland Sub-watershed of Meenachil river in Kerala. Journal of Indian society of Remote Sensing. 34(2): 181-185. Authors Profile Mohammed Badiuddin Parvez Is a life member of Indian Water Resources Society, ASCE Born in Gangavathi, Obtained his BE in Civil Engineering in the year 2009-2013 from UVCE, Banagalore and M.E with specialization on Water Resources Engineering during 2013-2015 from UVCE, Bangalore University and Pursuing Ph.D from Bangalore University. And has 3 years of teaching experience. Till date, has presented and published several technical papers in many National and International seminars, Journals and conferences. Dr M Inayathulla Is a life member of Environmental and Water Resources Engineering (EWRI), ASCE, WWI, ASTEE, ASFPM. Born in Karnataka, Obtained his BE in Civil Engineering in the year 1987-1991 from UBDT, Davanagere and M.E with specialization on Water Resources Engineering during 1992-1994 from UVCE, Bangalore University and got Doctorate from Bangalore University in the year 1990- 1995. Presently working as Professor at UVCE, Bangalore University, India. And has more than 25 years of teaching experience. Till date, has presented and published several technical papers in many National and International seminars and conferences.