SlideShare a Scribd company logo
1 of 7
Download to read offline
© July 2019 | IJIRT | Volume 6 Issue 2 | ISSN: 2349-6002
IJIRT 148410 INTERNATIONAL JOURNAL OF INNOVATIVE RESEARCH IN TECHNOLOGY 1
Derivation of Intensity Duration Frequency Curves Using
Short Duration Rainfall for Yermarus Raingauge Station
Raichur District Karnataka
Mohammed Badiuddin Parvez1
, M .Inayathulla2
1
Research Scholar, Department of Civil Engineering, UVCE, Bangalore University, Bangalore,
Karnataka, India
2
Professor, Department of Civil Engineering, UVCE, Bangalore University, Bangalore, Karnataka, India
Abstract- The estimation of rainfall intensity is
commonly required for the design of hydraulic and
water resources engineering control structures. The
intensity-duration-frequency (IDF) relationship is a
mathematical relationship between the rainfall
intensity, the duration and the return period. The
present study aimed the derivation of IDF curves of
Yermarus Raingauge Station of Raichur District with
19 years of rainfall data (1998 to 2016). The Normal
Distribution, Log Normal Distribution, Gumbel
distribution, Pearson Type III Distribution and Log
Pearsons Type III Distribution techniques are used to
Find the rainfall intensity values of 2, 5, 10, 15, 30, 60,
120, 720, 1440 minutes of rainfall duration with
different return period. Chi Square test was conducted
to find the goodness of fit the short duration IDF using
daily rainfall data are presented, which is input for
water resources projects.
Index terms- Gumbel Distribution, Intensity Duration
Frequency (IDF), Log Normal Distribution, Normal
Distribution, Pearson Type III Distribution, Log
Pearson Type III Distribution Rainfall Duration,
Return Period, Rainfall Intensity
I. INTRODUCTION
IDF stands for Intensity-Duration-Frequency.
Rainfall intensity is defined as the ratio of the total
amount of rain (rainfall depth) falling during a given
period to the duration of the period It is expressed in
depth units per unit time, usually as mm per hour.
The period of time over which rainfall is measured is
called duration. The number of times, during a
specified period of years, that precipitation of a
certain magnitude or greater occurs or will occur at a
station is called frequency (FAO, 2012).
The IDF-relationships give an idea about the
frequency or return period of a mean rainfall intensity
or rainfall volume that can be expected within a
certain period, i.e. the storm duration. In this sense
the storm duration is an artificial parameter that can
comprise any part of a rainfall event. Runoff occurs
when precipitation moves across the land surface,
some of which eventually reaches natural or artificial
streams and lakes. Runoff often transports
contaminants to these water bodies, reducing their
usefulness as a source of water (National Association
of RC and D Councils, 2001). The relation between
rainfall and runoff is influenced by various storm and
basin characteristics. Because of these complexities
and the frequent paucity of adequate runoff data,
many approximate formulae have been developed to
relate rainfall and runoff. The earliest of these
formulae were usually empirical statements.
The scope of this study was to predict rainfall depth
and intensity for Yermarus station using the data
from 1998 to 2016 by using Normal, Log Normal,
Pearson Type III, Log Pearson Type III and Gumbel
distribution. For the distribution giving the best
results, short duration IDF curves and equations were
derived for the station having maximum rainfall
depth for various short durations and standard return
periods,
II MATERIALS AND METHODS
A Study Area
The Study area Yermarus Station of Raichur District,
Karnataka is located It is located 7 Km towards North
from District headquarters Raichur Karnataka. The
average mean daily temperature varies from 24 to
410C respectively.
© August 2017 | IJIRT | Volume 4 Issue 3 | ISSN: 2349-6002
IJIRT 144769 INTERNATIONAL JOURNAL OF INNOVATIVE RESEARCH IN TECHNOLOGY 2
Fig 1 Location Map of Study Area
B Methodology
Fig 2 Methodology adopted for IDF curves
© August 2017 | IJIRT | Volume 4 Issue 3 | ISSN: 2349-6002
IJIRT 144769 INTERNATIONAL JOURNAL OF INNOVATIVE RESEARCH IN TECHNOLOGY 3
III RESULTS AND DISCUSSIONS
A Estimation of Short Duration Rainfall
Indian Meteorological Department (IMD) use an
empirical reduction formula (Equation 3.1) for
estimation of various duration like 1-hr, 2-hr, 3-hr, 5-
hr, 8-hr rainfall values from annual maximum values.
Chowdhury et al. (2007), used IMD empirical
reduction formula to estimate the short duration
rainfall from daily rainfall data in Sylhet city and
found that this formula give the best estimation of
short duration rainfall. (Rashid et al, 2012)
P_t=P_24 (t/24)^(1/3) (3.1)
where, Pt is the required rainfall depth in mm at t-hr
duration,
P24 is the daily rainfall in mm and t is the duration of
rainfall for which the rainfall depth is required in hr.
Short duration rainfall by using IMD empirical
formula for Yermarus station is tabulated in Table 1.
Year Rainfall
(mm) ( ) in mm where, time t is in hours
Duration in
Minutes
5 10 15 30 60 120 720 1440
1998 113.4 17.17177 21.635114 24.766006 31.203213 39.313584 49.532012 90.00564 113.4
1999 84.1 12.73497 16.045089 18.367029 23.141007 29.155842 36.734059 66.75021 84.1
2000 63.8 9.661012 12.172136 13.933608 17.555247 22.118225 27.867217 50.63809 63.8
2001 75.9 11.49327 14.480645 16.576189 20.88469 26.31306 33.152379 60.24187 75.9
2002 60.9 9.221875 11.618857 13.300263 16.757281 21.112851 26.600525 48.33636 60.9
2003 57 8.631311 10.874793 12.448522 15.684154 19.760796 24.897043 45.24093 57
2004 98.8 14.96094 18.84964 21.577437 27.185868 34.252047 43.154875 78.41761 98.8
2005 63.4 9.600441 12.095822 13.84625 17.445182 21.979552 27.692501 50.32061 63.4
2006 116 17.56548 22.131157 25.333833 31.91863 40.214954 50.667667 92.06926 116
2007 101.9 15.43036 19.441077 22.254462 28.038866 35.326757 44.508925 80.87808 101.9
2008 80.4 12.17469 15.339181 17.558967 22.122913 27.873123 35.117935 63.81352 80.4
2009 265.5 40.20374 50.653639 57.983903 73.05514 92.043709 115.96781 210.7275 265.5
2010 65.8 9.963865 12.553708 14.370399 18.105568 22.811586 28.740797 52.22549 65.8
2011 103 15.59693 19.650941 22.494697 28.341542 35.708106 44.989394 81.75115 103
2012 29.5 4.467082 5.6281821 6.4426559 8.1172378 10.227079 12.885312 23.41417 29.5
2013 64.7 9.797295 12.343843 14.130164 17.802891 22.430237 28.260328 51.35242 64.7
2014 85.5 12.94697 16.312189 18.672782 23.526232 29.641194 37.345565 67.86139 85.5
2015 74.1 11.2207 14.13723 16.183078 20.389401 25.689035 32.366156 58.81321 74.1
2016 68.3 10.34243 13.030672 14.916386 18.793469 23.678288 29.832773 54.20975 68.3
Table1 Short duration rainfall for Yermarus
B Normal Distribution
© August 2017 | IJIRT | Volume 4 Issue 3 | ISSN: 2349-6002
IJIRT 144769 INTERNATIONAL JOURNAL OF INNOVATIVE RESEARCH IN TECHNOLOGY 4
C Log Normal Distribution
D Gumbel’s Distribution
E Pearson Type III Distribution
F Log Pearsons Type III Distribution
© August 2017 | IJIRT | Volume 4 Issue 3 | ISSN: 2349-6002
IJIRT 144769 INTERNATIONAL JOURNAL OF INNOVATIVE RESEARCH IN TECHNOLOGY 5
G Chi-Square Test
To identify a specific theoretical distribution for the
available data it is important to do a test. The aim of
the test is to find how good a fit is between the
observed and the predicted data. Chi-square is one of
the most widely used tests to find the best fit
theoretical distribution of any specific dataset which
is represented by Equation 3.2.
χ2=∑_(i=1)^n▒(O_i-E_i )^2 ∕E_i (3.2)
where, Oi and Ei represent the observed and expected
frequencies respectively. If the observed frequencies
are close to the corresponding expected frequencies,
the χ2 value will be small, indicating a good fit;
otherwise it will be a poor fit. (Rashid et al, 2012)
Table 7 : Chi –Square Test
Durati
on in
minute
s
Observed
values
NORMAL
DISTRIBUTION
LOG-NORMAL DISTRIBUTION GUMBELS DISTRIBUTION
Expected
values
Chi-square
values
Expected
values
Chi-square
values
Expected
values
Chi-square
values
5 13.32553325 19.19288241 1.793674629 17.65889708 1.063375703 26.38436048 6.463411112
10 16.78915342 24.18156492 2.259892942 22.24886064 1.339772111 33.24227764 8.143404001
15 19.21877022 27.68096332 2.586929912 25.46857068 1.533655195 38.0528833 9.321864328
30 24.21413316 34.87582837 3.259327451 32.08838831 1.932284463 47.94362868 11.74481309
60 30.50789607 43.9407903 4.106495264 40.42883589 2.43452587 60.40518698 14.79753724
120 38.43754045 55.36192664 5.173859824 50.93714136 3.06731039 76.1057666 18.64372866
720 69.84564629 100.599297 9.401527231 92.5589285 5.573672874 138.2933557 33.87790327
1440 88 126.7471718 11.84518206 116.6169424 7.022387779 174.2387099 42.68348345
Table 7 Contd….
Duration in
minutes
Observed values PEARSON TYPE III LOG PEARSON TYPE III
Expected values Chi-square values Expected values Chi-square values
5 13.32553325 24.59217347 5.161690243 25.2391913 5.62360523
10 16.78915342
30.98425898 6.503335197 31.79945201 7.08531278
15 19.21877022 35.4680989 7.444455461 36.40126135 8.11065305
30 24.21413316
44.68700441 9.37942614 45.86271542 10.2187825
60 30.50789607 56.30209751 11.81733643 57.78340056 12.8748592
120 38.43754045
70.93619781 14.88891092 72.8025227 16.2213061
720 69.84564629 128.8996258 27.05494664 132.2909632 29.4760693
1440 88
162.4033519 34.08709678 166.6761693 37.1375202
© August 2017 | IJIRT | Volume 4 Issue 3 | ISSN: 2349-6002
IJIRT 144769 INTERNATIONAL JOURNAL OF INNOVATIVE RESEARCH IN TECHNOLOGY 6
Fig 3: IDF for Yermarus Raingauge Station by Log
Normal Distribution
Table 8 : Rainfall IDF Empirical Equation For Respective
Return Period Using Log Normal Distribution
Return Period (T)
years
i= x * (td)-y
X Y
2 584.26 0.667
5 613.86 0.667
10 622.65 0.667
25 627.61 0.667
50 629.21 0.667
75 629.74 0.667
100 630.00 0.667
IV CONCLUSIONS
Among the various available probability distribution
functions Log_ Normal distribution had the best
approximation of rainfall intensity for various return
periods. Study showed that i = x * (td)-y was the best
form of IDF empirical equation for Yermarus
Raingauge Station Raichur It has been tabulated in
Table 8. These IDF equations will help to estimate
the rainfall intensity for any specific return period in
Yermarus Raingauge Station Raichur in a short time
and more easily. The results computed can be utilized
for developing surface drain network for recharging
ground water.
REFERENCES
© July 2019 | IJIRT | Volume 6 Issue 2 | ISSN: 2349-6002
IJIRT 148410 INTERNATIONAL JOURNAL OF INNOVATIVE RESEARCH IN TECHNOLOGY 7
[1] Bell F. C., 1969, “Generalized rainfall-duration-
frequency relationship”, ASCE J. Hydraulic
Eng., 95, 311–327.
[2] Bernard, M. M., (1932), “Formulas for rainfall
intensities of long durations”. Trans. ASCE
6:592 - 624.
[3] Bhaskar, N. R.; Parida, B. P.; Nayak, A. K.
1997. Flood Estimation for Ungauged
Catchments Using the GIUH. Journal of Water
Resources Planning and Management, ASCE
123(4): 228-238.
[4] Chow V.T., D.R. Maidment and L.W.Mays,
1988, “Applied Hydrology”, McGraw- Hill,
Chapter 10 – Probability, Risk and Uncertainty
Analysis for Hydrologic and Hydraulic Design:
361 – 398.
[5] M. M. Rashid, 1 S. B. Faruque and 2 J. B. Alam
2012, “Modeling of Short Duration Rainfall
Intensity Duration Frequency (SDRIDF)
Equation for Sylhet City in Bangladesh.
[6] Mohammed Badiuddin Parvez, M Inayathulla
“Generation Of Intensity Duration Frequency
Curves For Different Return Period Using Short
Duration Rainfall For Manvi Taluk Raichur
District Karnataka”, International Research
Journal of Engineering and Management Studies
(IRJEMS), Volume: 03 Issue: 04 | April -2019.
[7] Mohammed Badiuddin Parvez, M Inayathulla
“Prioritization Of Subwatersheds of Cauvery
Region Based on Morphometric Analysis Using
GIS”, International Journal for Research in
Engineering Application & Management
(IJREAM), Volume: 05 Issue: 01, April -2019.
4.
[8] Mohammed Badiuddin Parvez, M Inayathulla
“Modelling of Short Duration Isopluvial Map
For Raichur District Karnataka”, International
Journal for Science and Advance Research in
Technology (IJSART), Volume: 05 Issue: 4,
April -2019.
[9] Mohammed Badiuddin Parvez, and M
.Inayathulla. "Morphometry, Hypsometry
Analysis and Runoff Estimation of Aam Talab
Watershed Raichur, Karnataka" International
Journal Of Advance Research And Innovative
Ideas In Education Volume 5 Issue 3 2019 Page
1713-1727
[10]V.T.Chow, “Handbook of Applied Hydrology,”
McGraw-Hill Book.

More Related Content

What's hot

A study on comparision of runoff estimated by Empirical formulae with Measure...
A study on comparision of runoff estimated by Empirical formulae with Measure...A study on comparision of runoff estimated by Empirical formulae with Measure...
A study on comparision of runoff estimated by Empirical formulae with Measure...Ahmed Ali S D
 
International Journal of Computational Engineering Research(IJCER)
International Journal of Computational Engineering Research(IJCER)International Journal of Computational Engineering Research(IJCER)
International Journal of Computational Engineering Research(IJCER)ijceronline
 
Regional Rainfall Frequency Analysis By L-Moments Approach For Madina Region,...
Regional Rainfall Frequency Analysis By L-Moments Approach For Madina Region,...Regional Rainfall Frequency Analysis By L-Moments Approach For Madina Region,...
Regional Rainfall Frequency Analysis By L-Moments Approach For Madina Region,...IJERDJOURNAL
 
Comparative Analysis of Terrestrial Rain Attenuation at Ku band for Stations ...
Comparative Analysis of Terrestrial Rain Attenuation at Ku band for Stations ...Comparative Analysis of Terrestrial Rain Attenuation at Ku band for Stations ...
Comparative Analysis of Terrestrial Rain Attenuation at Ku band for Stations ...IRJET Journal
 
River engineering flood design
River engineering flood designRiver engineering flood design
River engineering flood designSharifah Ain
 
A Study on Intensity of Rainfall in Urban Bangalore Areas
A Study on Intensity of Rainfall in Urban Bangalore AreasA Study on Intensity of Rainfall in Urban Bangalore Areas
A Study on Intensity of Rainfall in Urban Bangalore AreasIRJET Journal
 
Rainfall-Runoff Modelling using Modified NRCS-CN,RS and GIS -A Case Study
Rainfall-Runoff Modelling using Modified NRCS-CN,RS and GIS -A Case StudyRainfall-Runoff Modelling using Modified NRCS-CN,RS and GIS -A Case Study
Rainfall-Runoff Modelling using Modified NRCS-CN,RS and GIS -A Case StudyIJERA Editor
 
ASSESSING THE EFFECTS OF SPATIAL INTERPOLATION OF RAINFALL ON THE STREAMFLOW ...
ASSESSING THE EFFECTS OF SPATIAL INTERPOLATION OF RAINFALL ON THE STREAMFLOW ...ASSESSING THE EFFECTS OF SPATIAL INTERPOLATION OF RAINFALL ON THE STREAMFLOW ...
ASSESSING THE EFFECTS OF SPATIAL INTERPOLATION OF RAINFALL ON THE STREAMFLOW ...civej
 
Flood frequency analyses
Flood frequency analysesFlood frequency analyses
Flood frequency analysesvivek gami
 
HYDROLOGICAL STUDY OF MAN (CHANDRABHAGA) RIVER
HYDROLOGICAL STUDY OF MAN (CHANDRABHAGA) RIVER HYDROLOGICAL STUDY OF MAN (CHANDRABHAGA) RIVER
HYDROLOGICAL STUDY OF MAN (CHANDRABHAGA) RIVER Anil Shirgire
 
Water Resources Engineering - Question Bank (Subjective)
Water Resources Engineering - Question Bank (Subjective)Water Resources Engineering - Question Bank (Subjective)
Water Resources Engineering - Question Bank (Subjective)Malla Reddy University
 

What's hot (20)

Idf
IdfIdf
Idf
 
A study on comparision of runoff estimated by Empirical formulae with Measure...
A study on comparision of runoff estimated by Empirical formulae with Measure...A study on comparision of runoff estimated by Empirical formulae with Measure...
A study on comparision of runoff estimated by Empirical formulae with Measure...
 
International Journal of Computational Engineering Research(IJCER)
International Journal of Computational Engineering Research(IJCER)International Journal of Computational Engineering Research(IJCER)
International Journal of Computational Engineering Research(IJCER)
 
A4410119119
A4410119119A4410119119
A4410119119
 
Regional Rainfall Frequency Analysis By L-Moments Approach For Madina Region,...
Regional Rainfall Frequency Analysis By L-Moments Approach For Madina Region,...Regional Rainfall Frequency Analysis By L-Moments Approach For Madina Region,...
Regional Rainfall Frequency Analysis By L-Moments Approach For Madina Region,...
 
Rainfall-Runoff Modelling
Rainfall-Runoff ModellingRainfall-Runoff Modelling
Rainfall-Runoff Modelling
 
Comparative Analysis of Terrestrial Rain Attenuation at Ku band for Stations ...
Comparative Analysis of Terrestrial Rain Attenuation at Ku band for Stations ...Comparative Analysis of Terrestrial Rain Attenuation at Ku band for Stations ...
Comparative Analysis of Terrestrial Rain Attenuation at Ku band for Stations ...
 
River engineering flood design
River engineering flood designRiver engineering flood design
River engineering flood design
 
A Study on Intensity of Rainfall in Urban Bangalore Areas
A Study on Intensity of Rainfall in Urban Bangalore AreasA Study on Intensity of Rainfall in Urban Bangalore Areas
A Study on Intensity of Rainfall in Urban Bangalore Areas
 
Updating the curve number method for rainfall runoff estimation
Updating the curve number method for rainfall runoff estimationUpdating the curve number method for rainfall runoff estimation
Updating the curve number method for rainfall runoff estimation
 
3 ijsrmss-02686-paid
3 ijsrmss-02686-paid3 ijsrmss-02686-paid
3 ijsrmss-02686-paid
 
Rainfall-Runoff Modelling using Modified NRCS-CN,RS and GIS -A Case Study
Rainfall-Runoff Modelling using Modified NRCS-CN,RS and GIS -A Case StudyRainfall-Runoff Modelling using Modified NRCS-CN,RS and GIS -A Case Study
Rainfall-Runoff Modelling using Modified NRCS-CN,RS and GIS -A Case Study
 
ASSESSING THE EFFECTS OF SPATIAL INTERPOLATION OF RAINFALL ON THE STREAMFLOW ...
ASSESSING THE EFFECTS OF SPATIAL INTERPOLATION OF RAINFALL ON THE STREAMFLOW ...ASSESSING THE EFFECTS OF SPATIAL INTERPOLATION OF RAINFALL ON THE STREAMFLOW ...
ASSESSING THE EFFECTS OF SPATIAL INTERPOLATION OF RAINFALL ON THE STREAMFLOW ...
 
Flood frequency analyses
Flood frequency analysesFlood frequency analyses
Flood frequency analyses
 
Flood
FloodFlood
Flood
 
HYDROLOGICAL STUDY OF MAN (CHANDRABHAGA) RIVER
HYDROLOGICAL STUDY OF MAN (CHANDRABHAGA) RIVER HYDROLOGICAL STUDY OF MAN (CHANDRABHAGA) RIVER
HYDROLOGICAL STUDY OF MAN (CHANDRABHAGA) RIVER
 
Runoff & Flood Frequency Analysis
Runoff & Flood Frequency AnalysisRunoff & Flood Frequency Analysis
Runoff & Flood Frequency Analysis
 
July 30-130-Ken Kagy2
July 30-130-Ken Kagy2July 30-130-Ken Kagy2
July 30-130-Ken Kagy2
 
20320140505008 2
20320140505008 220320140505008 2
20320140505008 2
 
Water Resources Engineering - Question Bank (Subjective)
Water Resources Engineering - Question Bank (Subjective)Water Resources Engineering - Question Bank (Subjective)
Water Resources Engineering - Question Bank (Subjective)
 

Similar to Derivation Of Intensity Duration Frequency Curves Using Short Duration Rainfall For Yermarus Raingauge Station Raichur District Karnataka

Generation of short_duration_isohyetal_maps_for_raichur_district_karnataka_ij...
Generation of short_duration_isohyetal_maps_for_raichur_district_karnataka_ij...Generation of short_duration_isohyetal_maps_for_raichur_district_karnataka_ij...
Generation of short_duration_isohyetal_maps_for_raichur_district_karnataka_ij...Mohammed Badiuddin Parvez
 
Weekly Rainfall Analysis for Crop Planning Using Markov’s Chain Model for Kan...
Weekly Rainfall Analysis for Crop Planning Using Markov’s Chain Model for Kan...Weekly Rainfall Analysis for Crop Planning Using Markov’s Chain Model for Kan...
Weekly Rainfall Analysis for Crop Planning Using Markov’s Chain Model for Kan...IJERA Editor
 
Statistical analysis of an orographic rainfall for eight north-east region of...
Statistical analysis of an orographic rainfall for eight north-east region of...Statistical analysis of an orographic rainfall for eight north-east region of...
Statistical analysis of an orographic rainfall for eight north-east region of...IJICTJOURNAL
 
IRJET- Rainfall Simulation using ANN based Generealized Feed Forward and MLR ...
IRJET- Rainfall Simulation using ANN based Generealized Feed Forward and MLR ...IRJET- Rainfall Simulation using ANN based Generealized Feed Forward and MLR ...
IRJET- Rainfall Simulation using ANN based Generealized Feed Forward and MLR ...IRJET Journal
 
Application of mathematical modelling in rainfall forcast a csae study in...
Application of mathematical modelling in rainfall forcast     a csae study in...Application of mathematical modelling in rainfall forcast     a csae study in...
Application of mathematical modelling in rainfall forcast a csae study in...eSAT Journals
 
Remote Sensing Method for Flood Management System
 Remote Sensing Method for Flood Management System Remote Sensing Method for Flood Management System
Remote Sensing Method for Flood Management SystemIJMREMJournal
 
Numerical recreation of rainfall and runoff in Namakkal District of Tamil Nad...
Numerical recreation of rainfall and runoff in Namakkal District of Tamil Nad...Numerical recreation of rainfall and runoff in Namakkal District of Tamil Nad...
Numerical recreation of rainfall and runoff in Namakkal District of Tamil Nad...IRJET Journal
 
ANNUAL PRECIPITATION IN SOUTHERN OF MADAGASCAR: MODELING USING HIGH ORDER FUZ...
ANNUAL PRECIPITATION IN SOUTHERN OF MADAGASCAR: MODELING USING HIGH ORDER FUZ...ANNUAL PRECIPITATION IN SOUTHERN OF MADAGASCAR: MODELING USING HIGH ORDER FUZ...
ANNUAL PRECIPITATION IN SOUTHERN OF MADAGASCAR: MODELING USING HIGH ORDER FUZ...ijfls
 
PM10 CONCENTRATION CHANGES AS A RESULT OF WIDESPRING PRECIPITATION IN AGRA
PM10 CONCENTRATION CHANGES AS A RESULT OF WIDESPRING PRECIPITATION IN AGRAPM10 CONCENTRATION CHANGES AS A RESULT OF WIDESPRING PRECIPITATION IN AGRA
PM10 CONCENTRATION CHANGES AS A RESULT OF WIDESPRING PRECIPITATION IN AGRAIRJET Journal
 
Modelling the Monthly Vulnerability of Land Degradation by Using the Method o...
Modelling the Monthly Vulnerability of Land Degradation by Using the Method o...Modelling the Monthly Vulnerability of Land Degradation by Using the Method o...
Modelling the Monthly Vulnerability of Land Degradation by Using the Method o...IJAEMSJORNAL
 
Progressive Improvements in basic Intensity-Duration-Frequency Curves Derivin...
Progressive Improvements in basic Intensity-Duration-Frequency Curves Derivin...Progressive Improvements in basic Intensity-Duration-Frequency Curves Derivin...
Progressive Improvements in basic Intensity-Duration-Frequency Curves Derivin...IRJET Journal
 
monther,+5049-Article-Text-15067-1-6-20190816.pdf
monther,+5049-Article-Text-15067-1-6-20190816.pdfmonther,+5049-Article-Text-15067-1-6-20190816.pdf
monther,+5049-Article-Text-15067-1-6-20190816.pdfAllexbyCEstardo
 

Similar to Derivation Of Intensity Duration Frequency Curves Using Short Duration Rainfall For Yermarus Raingauge Station Raichur District Karnataka (20)

Multi criteria decision-making-analysis
Multi criteria decision-making-analysisMulti criteria decision-making-analysis
Multi criteria decision-making-analysis
 
4 wajes-02687
4 wajes-026874 wajes-02687
4 wajes-02687
 
5 ijsrms-02617 (1)
5 ijsrms-02617 (1)5 ijsrms-02617 (1)
5 ijsrms-02617 (1)
 
16 ijsrms-02614 (1)
16 ijsrms-02614 (1)16 ijsrms-02614 (1)
16 ijsrms-02614 (1)
 
5 wajes-02738
5 wajes-027385 wajes-02738
5 wajes-02738
 
Generation of short_duration_isohyetal_maps_for_raichur_district_karnataka_ij...
Generation of short_duration_isohyetal_maps_for_raichur_district_karnataka_ij...Generation of short_duration_isohyetal_maps_for_raichur_district_karnataka_ij...
Generation of short_duration_isohyetal_maps_for_raichur_district_karnataka_ij...
 
1 ijsrms 02516 (1)
1 ijsrms 02516 (1)1 ijsrms 02516 (1)
1 ijsrms 02516 (1)
 
29 cej-2730.f
29 cej-2730.f29 cej-2730.f
29 cej-2730.f
 
Weekly Rainfall Analysis for Crop Planning Using Markov’s Chain Model for Kan...
Weekly Rainfall Analysis for Crop Planning Using Markov’s Chain Model for Kan...Weekly Rainfall Analysis for Crop Planning Using Markov’s Chain Model for Kan...
Weekly Rainfall Analysis for Crop Planning Using Markov’s Chain Model for Kan...
 
Statistical analysis of an orographic rainfall for eight north-east region of...
Statistical analysis of an orographic rainfall for eight north-east region of...Statistical analysis of an orographic rainfall for eight north-east region of...
Statistical analysis of an orographic rainfall for eight north-east region of...
 
IRJET- Rainfall Simulation using ANN based Generealized Feed Forward and MLR ...
IRJET- Rainfall Simulation using ANN based Generealized Feed Forward and MLR ...IRJET- Rainfall Simulation using ANN based Generealized Feed Forward and MLR ...
IRJET- Rainfall Simulation using ANN based Generealized Feed Forward and MLR ...
 
Application of mathematical modelling in rainfall forcast a csae study in...
Application of mathematical modelling in rainfall forcast     a csae study in...Application of mathematical modelling in rainfall forcast     a csae study in...
Application of mathematical modelling in rainfall forcast a csae study in...
 
Remote Sensing Method for Flood Management System
 Remote Sensing Method for Flood Management System Remote Sensing Method for Flood Management System
Remote Sensing Method for Flood Management System
 
Numerical recreation of rainfall and runoff in Namakkal District of Tamil Nad...
Numerical recreation of rainfall and runoff in Namakkal District of Tamil Nad...Numerical recreation of rainfall and runoff in Namakkal District of Tamil Nad...
Numerical recreation of rainfall and runoff in Namakkal District of Tamil Nad...
 
ANNUAL PRECIPITATION IN SOUTHERN OF MADAGASCAR: MODELING USING HIGH ORDER FUZ...
ANNUAL PRECIPITATION IN SOUTHERN OF MADAGASCAR: MODELING USING HIGH ORDER FUZ...ANNUAL PRECIPITATION IN SOUTHERN OF MADAGASCAR: MODELING USING HIGH ORDER FUZ...
ANNUAL PRECIPITATION IN SOUTHERN OF MADAGASCAR: MODELING USING HIGH ORDER FUZ...
 
WERM_hic2016
WERM_hic2016WERM_hic2016
WERM_hic2016
 
PM10 CONCENTRATION CHANGES AS A RESULT OF WIDESPRING PRECIPITATION IN AGRA
PM10 CONCENTRATION CHANGES AS A RESULT OF WIDESPRING PRECIPITATION IN AGRAPM10 CONCENTRATION CHANGES AS A RESULT OF WIDESPRING PRECIPITATION IN AGRA
PM10 CONCENTRATION CHANGES AS A RESULT OF WIDESPRING PRECIPITATION IN AGRA
 
Modelling the Monthly Vulnerability of Land Degradation by Using the Method o...
Modelling the Monthly Vulnerability of Land Degradation by Using the Method o...Modelling the Monthly Vulnerability of Land Degradation by Using the Method o...
Modelling the Monthly Vulnerability of Land Degradation by Using the Method o...
 
Progressive Improvements in basic Intensity-Duration-Frequency Curves Derivin...
Progressive Improvements in basic Intensity-Duration-Frequency Curves Derivin...Progressive Improvements in basic Intensity-Duration-Frequency Curves Derivin...
Progressive Improvements in basic Intensity-Duration-Frequency Curves Derivin...
 
monther,+5049-Article-Text-15067-1-6-20190816.pdf
monther,+5049-Article-Text-15067-1-6-20190816.pdfmonther,+5049-Article-Text-15067-1-6-20190816.pdf
monther,+5049-Article-Text-15067-1-6-20190816.pdf
 

More from Mohammed Badiuddin Parvez

Estimation of Crop water Requirement for Kolar Taluk Sub watershed
Estimation of Crop water Requirement for Kolar Taluk Sub watershed Estimation of Crop water Requirement for Kolar Taluk Sub watershed
Estimation of Crop water Requirement for Kolar Taluk Sub watershed Mohammed Badiuddin Parvez
 
Groundwater Prospectus Map for Suryanagar Subwatershed
Groundwater Prospectus Map for Suryanagar Subwatershed     Groundwater Prospectus Map for Suryanagar Subwatershed
Groundwater Prospectus Map for Suryanagar Subwatershed Mohammed Badiuddin Parvez
 
Geomorphological Analysis of Two Mini-Watersheds in Raichur City Karnataka
Geomorphological Analysis of Two Mini-Watersheds in Raichur City KarnatakaGeomorphological Analysis of Two Mini-Watersheds in Raichur City Karnataka
Geomorphological Analysis of Two Mini-Watersheds in Raichur City KarnatakaMohammed Badiuddin Parvez
 
Prioritization Of Subwatersheds of Cauvery Region Based on Morphometric Analy...
Prioritization Of Subwatersheds of Cauvery Region Based on Morphometric Analy...Prioritization Of Subwatersheds of Cauvery Region Based on Morphometric Analy...
Prioritization Of Subwatersheds of Cauvery Region Based on Morphometric Analy...Mohammed Badiuddin Parvez
 
Assesment of groundwater_potential_zones_for_bruhat_bangalore_mahanagara_pali...
Assesment of groundwater_potential_zones_for_bruhat_bangalore_mahanagara_pali...Assesment of groundwater_potential_zones_for_bruhat_bangalore_mahanagara_pali...
Assesment of groundwater_potential_zones_for_bruhat_bangalore_mahanagara_pali...Mohammed Badiuddin Parvez
 
Morphometry hypsometry_analysis_and_runoff_estimation_of_aam_talab_watershed...
Morphometry  hypsometry_analysis_and_runoff_estimation_of_aam_talab_watershed...Morphometry  hypsometry_analysis_and_runoff_estimation_of_aam_talab_watershed...
Morphometry hypsometry_analysis_and_runoff_estimation_of_aam_talab_watershed...Mohammed Badiuddin Parvez
 

More from Mohammed Badiuddin Parvez (16)

24 cej-2795.f
24 cej-2795.f24 cej-2795.f
24 cej-2795.f
 
11 isroset-ijsrms-02993
11 isroset-ijsrms-0299311 isroset-ijsrms-02993
11 isroset-ijsrms-02993
 
4 wajes-02828
4 wajes-028284 wajes-02828
4 wajes-02828
 
2 ijsrms-02753
2 ijsrms-027532 ijsrms-02753
2 ijsrms-02753
 
2 wajes-02668
2 wajes-026682 wajes-02668
2 wajes-02668
 
6 ijsrms-02660
6 ijsrms-026606 ijsrms-02660
6 ijsrms-02660
 
Ijirt148701 paper
Ijirt148701 paperIjirt148701 paper
Ijirt148701 paper
 
Ijirt148631 paper (1)
Ijirt148631 paper (1)Ijirt148631 paper (1)
Ijirt148631 paper (1)
 
6 ijsrms-02616 (1)
6 ijsrms-02616 (1)6 ijsrms-02616 (1)
6 ijsrms-02616 (1)
 
Aam talab
Aam talabAam talab
Aam talab
 
Estimation of Crop water Requirement for Kolar Taluk Sub watershed
Estimation of Crop water Requirement for Kolar Taluk Sub watershed Estimation of Crop water Requirement for Kolar Taluk Sub watershed
Estimation of Crop water Requirement for Kolar Taluk Sub watershed
 
Groundwater Prospectus Map for Suryanagar Subwatershed
Groundwater Prospectus Map for Suryanagar Subwatershed     Groundwater Prospectus Map for Suryanagar Subwatershed
Groundwater Prospectus Map for Suryanagar Subwatershed
 
Geomorphological Analysis of Two Mini-Watersheds in Raichur City Karnataka
Geomorphological Analysis of Two Mini-Watersheds in Raichur City KarnatakaGeomorphological Analysis of Two Mini-Watersheds in Raichur City Karnataka
Geomorphological Analysis of Two Mini-Watersheds in Raichur City Karnataka
 
Prioritization Of Subwatersheds of Cauvery Region Based on Morphometric Analy...
Prioritization Of Subwatersheds of Cauvery Region Based on Morphometric Analy...Prioritization Of Subwatersheds of Cauvery Region Based on Morphometric Analy...
Prioritization Of Subwatersheds of Cauvery Region Based on Morphometric Analy...
 
Assesment of groundwater_potential_zones_for_bruhat_bangalore_mahanagara_pali...
Assesment of groundwater_potential_zones_for_bruhat_bangalore_mahanagara_pali...Assesment of groundwater_potential_zones_for_bruhat_bangalore_mahanagara_pali...
Assesment of groundwater_potential_zones_for_bruhat_bangalore_mahanagara_pali...
 
Morphometry hypsometry_analysis_and_runoff_estimation_of_aam_talab_watershed...
Morphometry  hypsometry_analysis_and_runoff_estimation_of_aam_talab_watershed...Morphometry  hypsometry_analysis_and_runoff_estimation_of_aam_talab_watershed...
Morphometry hypsometry_analysis_and_runoff_estimation_of_aam_talab_watershed...
 

Recently uploaded

Concrete Mix Design - IS 10262-2019 - .pptx
Concrete Mix Design - IS 10262-2019 - .pptxConcrete Mix Design - IS 10262-2019 - .pptx
Concrete Mix Design - IS 10262-2019 - .pptxKartikeyaDwivedi3
 
INFLUENCE OF NANOSILICA ON THE PROPERTIES OF CONCRETE
INFLUENCE OF NANOSILICA ON THE PROPERTIES OF CONCRETEINFLUENCE OF NANOSILICA ON THE PROPERTIES OF CONCRETE
INFLUENCE OF NANOSILICA ON THE PROPERTIES OF CONCRETEroselinkalist12
 
Call Us ≽ 8377877756 ≼ Call Girls In Shastri Nagar (Delhi)
Call Us ≽ 8377877756 ≼ Call Girls In Shastri Nagar (Delhi)Call Us ≽ 8377877756 ≼ Call Girls In Shastri Nagar (Delhi)
Call Us ≽ 8377877756 ≼ Call Girls In Shastri Nagar (Delhi)dollysharma2066
 
Effects of rheological properties on mixing
Effects of rheological properties on mixingEffects of rheological properties on mixing
Effects of rheological properties on mixingviprabot1
 
Gfe Mayur Vihar Call Girls Service WhatsApp -> 9999965857 Available 24x7 ^ De...
Gfe Mayur Vihar Call Girls Service WhatsApp -> 9999965857 Available 24x7 ^ De...Gfe Mayur Vihar Call Girls Service WhatsApp -> 9999965857 Available 24x7 ^ De...
Gfe Mayur Vihar Call Girls Service WhatsApp -> 9999965857 Available 24x7 ^ De...srsj9000
 
Gurgaon ✡️9711147426✨Call In girls Gurgaon Sector 51 escort service
Gurgaon ✡️9711147426✨Call In girls Gurgaon Sector 51 escort serviceGurgaon ✡️9711147426✨Call In girls Gurgaon Sector 51 escort service
Gurgaon ✡️9711147426✨Call In girls Gurgaon Sector 51 escort servicejennyeacort
 
Study on Air-Water & Water-Water Heat Exchange in a Finned Tube Exchanger
Study on Air-Water & Water-Water Heat Exchange in a Finned Tube ExchangerStudy on Air-Water & Water-Water Heat Exchange in a Finned Tube Exchanger
Study on Air-Water & Water-Water Heat Exchange in a Finned Tube ExchangerAnamika Sarkar
 
Work Experience-Dalton Park.pptxfvvvvvvv
Work Experience-Dalton Park.pptxfvvvvvvvWork Experience-Dalton Park.pptxfvvvvvvv
Work Experience-Dalton Park.pptxfvvvvvvvLewisJB
 
EduAI - E learning Platform integrated with AI
EduAI - E learning Platform integrated with AIEduAI - E learning Platform integrated with AI
EduAI - E learning Platform integrated with AIkoyaldeepu123
 
Oxy acetylene welding presentation note.
Oxy acetylene welding presentation note.Oxy acetylene welding presentation note.
Oxy acetylene welding presentation note.eptoze12
 
CCS355 Neural Network & Deep Learning UNIT III notes and Question bank .pdf
CCS355 Neural Network & Deep Learning UNIT III notes and Question bank .pdfCCS355 Neural Network & Deep Learning UNIT III notes and Question bank .pdf
CCS355 Neural Network & Deep Learning UNIT III notes and Question bank .pdfAsst.prof M.Gokilavani
 
Application of Residue Theorem to evaluate real integrations.pptx
Application of Residue Theorem to evaluate real integrations.pptxApplication of Residue Theorem to evaluate real integrations.pptx
Application of Residue Theorem to evaluate real integrations.pptx959SahilShah
 
An experimental study in using natural admixture as an alternative for chemic...
An experimental study in using natural admixture as an alternative for chemic...An experimental study in using natural admixture as an alternative for chemic...
An experimental study in using natural admixture as an alternative for chemic...Chandu841456
 
CCS355 Neural Networks & Deep Learning Unit 1 PDF notes with Question bank .pdf
CCS355 Neural Networks & Deep Learning Unit 1 PDF notes with Question bank .pdfCCS355 Neural Networks & Deep Learning Unit 1 PDF notes with Question bank .pdf
CCS355 Neural Networks & Deep Learning Unit 1 PDF notes with Question bank .pdfAsst.prof M.Gokilavani
 
Introduction-To-Agricultural-Surveillance-Rover.pptx
Introduction-To-Agricultural-Surveillance-Rover.pptxIntroduction-To-Agricultural-Surveillance-Rover.pptx
Introduction-To-Agricultural-Surveillance-Rover.pptxk795866
 

Recently uploaded (20)

Concrete Mix Design - IS 10262-2019 - .pptx
Concrete Mix Design - IS 10262-2019 - .pptxConcrete Mix Design - IS 10262-2019 - .pptx
Concrete Mix Design - IS 10262-2019 - .pptx
 
INFLUENCE OF NANOSILICA ON THE PROPERTIES OF CONCRETE
INFLUENCE OF NANOSILICA ON THE PROPERTIES OF CONCRETEINFLUENCE OF NANOSILICA ON THE PROPERTIES OF CONCRETE
INFLUENCE OF NANOSILICA ON THE PROPERTIES OF CONCRETE
 
Exploring_Network_Security_with_JA3_by_Rakesh Seal.pptx
Exploring_Network_Security_with_JA3_by_Rakesh Seal.pptxExploring_Network_Security_with_JA3_by_Rakesh Seal.pptx
Exploring_Network_Security_with_JA3_by_Rakesh Seal.pptx
 
Call Us ≽ 8377877756 ≼ Call Girls In Shastri Nagar (Delhi)
Call Us ≽ 8377877756 ≼ Call Girls In Shastri Nagar (Delhi)Call Us ≽ 8377877756 ≼ Call Girls In Shastri Nagar (Delhi)
Call Us ≽ 8377877756 ≼ Call Girls In Shastri Nagar (Delhi)
 
Effects of rheological properties on mixing
Effects of rheological properties on mixingEffects of rheological properties on mixing
Effects of rheological properties on mixing
 
Gfe Mayur Vihar Call Girls Service WhatsApp -> 9999965857 Available 24x7 ^ De...
Gfe Mayur Vihar Call Girls Service WhatsApp -> 9999965857 Available 24x7 ^ De...Gfe Mayur Vihar Call Girls Service WhatsApp -> 9999965857 Available 24x7 ^ De...
Gfe Mayur Vihar Call Girls Service WhatsApp -> 9999965857 Available 24x7 ^ De...
 
Call Us -/9953056974- Call Girls In Vikaspuri-/- Delhi NCR
Call Us -/9953056974- Call Girls In Vikaspuri-/- Delhi NCRCall Us -/9953056974- Call Girls In Vikaspuri-/- Delhi NCR
Call Us -/9953056974- Call Girls In Vikaspuri-/- Delhi NCR
 
Gurgaon ✡️9711147426✨Call In girls Gurgaon Sector 51 escort service
Gurgaon ✡️9711147426✨Call In girls Gurgaon Sector 51 escort serviceGurgaon ✡️9711147426✨Call In girls Gurgaon Sector 51 escort service
Gurgaon ✡️9711147426✨Call In girls Gurgaon Sector 51 escort service
 
Study on Air-Water & Water-Water Heat Exchange in a Finned Tube Exchanger
Study on Air-Water & Water-Water Heat Exchange in a Finned Tube ExchangerStudy on Air-Water & Water-Water Heat Exchange in a Finned Tube Exchanger
Study on Air-Water & Water-Water Heat Exchange in a Finned Tube Exchanger
 
Work Experience-Dalton Park.pptxfvvvvvvv
Work Experience-Dalton Park.pptxfvvvvvvvWork Experience-Dalton Park.pptxfvvvvvvv
Work Experience-Dalton Park.pptxfvvvvvvv
 
🔝9953056974🔝!!-YOUNG call girls in Rajendra Nagar Escort rvice Shot 2000 nigh...
🔝9953056974🔝!!-YOUNG call girls in Rajendra Nagar Escort rvice Shot 2000 nigh...🔝9953056974🔝!!-YOUNG call girls in Rajendra Nagar Escort rvice Shot 2000 nigh...
🔝9953056974🔝!!-YOUNG call girls in Rajendra Nagar Escort rvice Shot 2000 nigh...
 
Design and analysis of solar grass cutter.pdf
Design and analysis of solar grass cutter.pdfDesign and analysis of solar grass cutter.pdf
Design and analysis of solar grass cutter.pdf
 
EduAI - E learning Platform integrated with AI
EduAI - E learning Platform integrated with AIEduAI - E learning Platform integrated with AI
EduAI - E learning Platform integrated with AI
 
Oxy acetylene welding presentation note.
Oxy acetylene welding presentation note.Oxy acetylene welding presentation note.
Oxy acetylene welding presentation note.
 
CCS355 Neural Network & Deep Learning UNIT III notes and Question bank .pdf
CCS355 Neural Network & Deep Learning UNIT III notes and Question bank .pdfCCS355 Neural Network & Deep Learning UNIT III notes and Question bank .pdf
CCS355 Neural Network & Deep Learning UNIT III notes and Question bank .pdf
 
Application of Residue Theorem to evaluate real integrations.pptx
Application of Residue Theorem to evaluate real integrations.pptxApplication of Residue Theorem to evaluate real integrations.pptx
Application of Residue Theorem to evaluate real integrations.pptx
 
An experimental study in using natural admixture as an alternative for chemic...
An experimental study in using natural admixture as an alternative for chemic...An experimental study in using natural admixture as an alternative for chemic...
An experimental study in using natural admixture as an alternative for chemic...
 
CCS355 Neural Networks & Deep Learning Unit 1 PDF notes with Question bank .pdf
CCS355 Neural Networks & Deep Learning Unit 1 PDF notes with Question bank .pdfCCS355 Neural Networks & Deep Learning Unit 1 PDF notes with Question bank .pdf
CCS355 Neural Networks & Deep Learning Unit 1 PDF notes with Question bank .pdf
 
Introduction-To-Agricultural-Surveillance-Rover.pptx
Introduction-To-Agricultural-Surveillance-Rover.pptxIntroduction-To-Agricultural-Surveillance-Rover.pptx
Introduction-To-Agricultural-Surveillance-Rover.pptx
 
9953056974 Call Girls In South Ex, Escorts (Delhi) NCR.pdf
9953056974 Call Girls In South Ex, Escorts (Delhi) NCR.pdf9953056974 Call Girls In South Ex, Escorts (Delhi) NCR.pdf
9953056974 Call Girls In South Ex, Escorts (Delhi) NCR.pdf
 

Derivation Of Intensity Duration Frequency Curves Using Short Duration Rainfall For Yermarus Raingauge Station Raichur District Karnataka

  • 1. © July 2019 | IJIRT | Volume 6 Issue 2 | ISSN: 2349-6002 IJIRT 148410 INTERNATIONAL JOURNAL OF INNOVATIVE RESEARCH IN TECHNOLOGY 1 Derivation of Intensity Duration Frequency Curves Using Short Duration Rainfall for Yermarus Raingauge Station Raichur District Karnataka Mohammed Badiuddin Parvez1 , M .Inayathulla2 1 Research Scholar, Department of Civil Engineering, UVCE, Bangalore University, Bangalore, Karnataka, India 2 Professor, Department of Civil Engineering, UVCE, Bangalore University, Bangalore, Karnataka, India Abstract- The estimation of rainfall intensity is commonly required for the design of hydraulic and water resources engineering control structures. The intensity-duration-frequency (IDF) relationship is a mathematical relationship between the rainfall intensity, the duration and the return period. The present study aimed the derivation of IDF curves of Yermarus Raingauge Station of Raichur District with 19 years of rainfall data (1998 to 2016). The Normal Distribution, Log Normal Distribution, Gumbel distribution, Pearson Type III Distribution and Log Pearsons Type III Distribution techniques are used to Find the rainfall intensity values of 2, 5, 10, 15, 30, 60, 120, 720, 1440 minutes of rainfall duration with different return period. Chi Square test was conducted to find the goodness of fit the short duration IDF using daily rainfall data are presented, which is input for water resources projects. Index terms- Gumbel Distribution, Intensity Duration Frequency (IDF), Log Normal Distribution, Normal Distribution, Pearson Type III Distribution, Log Pearson Type III Distribution Rainfall Duration, Return Period, Rainfall Intensity I. INTRODUCTION IDF stands for Intensity-Duration-Frequency. Rainfall intensity is defined as the ratio of the total amount of rain (rainfall depth) falling during a given period to the duration of the period It is expressed in depth units per unit time, usually as mm per hour. The period of time over which rainfall is measured is called duration. The number of times, during a specified period of years, that precipitation of a certain magnitude or greater occurs or will occur at a station is called frequency (FAO, 2012). The IDF-relationships give an idea about the frequency or return period of a mean rainfall intensity or rainfall volume that can be expected within a certain period, i.e. the storm duration. In this sense the storm duration is an artificial parameter that can comprise any part of a rainfall event. Runoff occurs when precipitation moves across the land surface, some of which eventually reaches natural or artificial streams and lakes. Runoff often transports contaminants to these water bodies, reducing their usefulness as a source of water (National Association of RC and D Councils, 2001). The relation between rainfall and runoff is influenced by various storm and basin characteristics. Because of these complexities and the frequent paucity of adequate runoff data, many approximate formulae have been developed to relate rainfall and runoff. The earliest of these formulae were usually empirical statements. The scope of this study was to predict rainfall depth and intensity for Yermarus station using the data from 1998 to 2016 by using Normal, Log Normal, Pearson Type III, Log Pearson Type III and Gumbel distribution. For the distribution giving the best results, short duration IDF curves and equations were derived for the station having maximum rainfall depth for various short durations and standard return periods, II MATERIALS AND METHODS A Study Area The Study area Yermarus Station of Raichur District, Karnataka is located It is located 7 Km towards North from District headquarters Raichur Karnataka. The average mean daily temperature varies from 24 to 410C respectively.
  • 2. © August 2017 | IJIRT | Volume 4 Issue 3 | ISSN: 2349-6002 IJIRT 144769 INTERNATIONAL JOURNAL OF INNOVATIVE RESEARCH IN TECHNOLOGY 2 Fig 1 Location Map of Study Area B Methodology Fig 2 Methodology adopted for IDF curves
  • 3. © August 2017 | IJIRT | Volume 4 Issue 3 | ISSN: 2349-6002 IJIRT 144769 INTERNATIONAL JOURNAL OF INNOVATIVE RESEARCH IN TECHNOLOGY 3 III RESULTS AND DISCUSSIONS A Estimation of Short Duration Rainfall Indian Meteorological Department (IMD) use an empirical reduction formula (Equation 3.1) for estimation of various duration like 1-hr, 2-hr, 3-hr, 5- hr, 8-hr rainfall values from annual maximum values. Chowdhury et al. (2007), used IMD empirical reduction formula to estimate the short duration rainfall from daily rainfall data in Sylhet city and found that this formula give the best estimation of short duration rainfall. (Rashid et al, 2012) P_t=P_24 (t/24)^(1/3) (3.1) where, Pt is the required rainfall depth in mm at t-hr duration, P24 is the daily rainfall in mm and t is the duration of rainfall for which the rainfall depth is required in hr. Short duration rainfall by using IMD empirical formula for Yermarus station is tabulated in Table 1. Year Rainfall (mm) ( ) in mm where, time t is in hours Duration in Minutes 5 10 15 30 60 120 720 1440 1998 113.4 17.17177 21.635114 24.766006 31.203213 39.313584 49.532012 90.00564 113.4 1999 84.1 12.73497 16.045089 18.367029 23.141007 29.155842 36.734059 66.75021 84.1 2000 63.8 9.661012 12.172136 13.933608 17.555247 22.118225 27.867217 50.63809 63.8 2001 75.9 11.49327 14.480645 16.576189 20.88469 26.31306 33.152379 60.24187 75.9 2002 60.9 9.221875 11.618857 13.300263 16.757281 21.112851 26.600525 48.33636 60.9 2003 57 8.631311 10.874793 12.448522 15.684154 19.760796 24.897043 45.24093 57 2004 98.8 14.96094 18.84964 21.577437 27.185868 34.252047 43.154875 78.41761 98.8 2005 63.4 9.600441 12.095822 13.84625 17.445182 21.979552 27.692501 50.32061 63.4 2006 116 17.56548 22.131157 25.333833 31.91863 40.214954 50.667667 92.06926 116 2007 101.9 15.43036 19.441077 22.254462 28.038866 35.326757 44.508925 80.87808 101.9 2008 80.4 12.17469 15.339181 17.558967 22.122913 27.873123 35.117935 63.81352 80.4 2009 265.5 40.20374 50.653639 57.983903 73.05514 92.043709 115.96781 210.7275 265.5 2010 65.8 9.963865 12.553708 14.370399 18.105568 22.811586 28.740797 52.22549 65.8 2011 103 15.59693 19.650941 22.494697 28.341542 35.708106 44.989394 81.75115 103 2012 29.5 4.467082 5.6281821 6.4426559 8.1172378 10.227079 12.885312 23.41417 29.5 2013 64.7 9.797295 12.343843 14.130164 17.802891 22.430237 28.260328 51.35242 64.7 2014 85.5 12.94697 16.312189 18.672782 23.526232 29.641194 37.345565 67.86139 85.5 2015 74.1 11.2207 14.13723 16.183078 20.389401 25.689035 32.366156 58.81321 74.1 2016 68.3 10.34243 13.030672 14.916386 18.793469 23.678288 29.832773 54.20975 68.3 Table1 Short duration rainfall for Yermarus B Normal Distribution
  • 4. © August 2017 | IJIRT | Volume 4 Issue 3 | ISSN: 2349-6002 IJIRT 144769 INTERNATIONAL JOURNAL OF INNOVATIVE RESEARCH IN TECHNOLOGY 4 C Log Normal Distribution D Gumbel’s Distribution E Pearson Type III Distribution F Log Pearsons Type III Distribution
  • 5. © August 2017 | IJIRT | Volume 4 Issue 3 | ISSN: 2349-6002 IJIRT 144769 INTERNATIONAL JOURNAL OF INNOVATIVE RESEARCH IN TECHNOLOGY 5 G Chi-Square Test To identify a specific theoretical distribution for the available data it is important to do a test. The aim of the test is to find how good a fit is between the observed and the predicted data. Chi-square is one of the most widely used tests to find the best fit theoretical distribution of any specific dataset which is represented by Equation 3.2. χ2=∑_(i=1)^n▒(O_i-E_i )^2 ∕E_i (3.2) where, Oi and Ei represent the observed and expected frequencies respectively. If the observed frequencies are close to the corresponding expected frequencies, the χ2 value will be small, indicating a good fit; otherwise it will be a poor fit. (Rashid et al, 2012) Table 7 : Chi –Square Test Durati on in minute s Observed values NORMAL DISTRIBUTION LOG-NORMAL DISTRIBUTION GUMBELS DISTRIBUTION Expected values Chi-square values Expected values Chi-square values Expected values Chi-square values 5 13.32553325 19.19288241 1.793674629 17.65889708 1.063375703 26.38436048 6.463411112 10 16.78915342 24.18156492 2.259892942 22.24886064 1.339772111 33.24227764 8.143404001 15 19.21877022 27.68096332 2.586929912 25.46857068 1.533655195 38.0528833 9.321864328 30 24.21413316 34.87582837 3.259327451 32.08838831 1.932284463 47.94362868 11.74481309 60 30.50789607 43.9407903 4.106495264 40.42883589 2.43452587 60.40518698 14.79753724 120 38.43754045 55.36192664 5.173859824 50.93714136 3.06731039 76.1057666 18.64372866 720 69.84564629 100.599297 9.401527231 92.5589285 5.573672874 138.2933557 33.87790327 1440 88 126.7471718 11.84518206 116.6169424 7.022387779 174.2387099 42.68348345 Table 7 Contd…. Duration in minutes Observed values PEARSON TYPE III LOG PEARSON TYPE III Expected values Chi-square values Expected values Chi-square values 5 13.32553325 24.59217347 5.161690243 25.2391913 5.62360523 10 16.78915342 30.98425898 6.503335197 31.79945201 7.08531278 15 19.21877022 35.4680989 7.444455461 36.40126135 8.11065305 30 24.21413316 44.68700441 9.37942614 45.86271542 10.2187825 60 30.50789607 56.30209751 11.81733643 57.78340056 12.8748592 120 38.43754045 70.93619781 14.88891092 72.8025227 16.2213061 720 69.84564629 128.8996258 27.05494664 132.2909632 29.4760693 1440 88 162.4033519 34.08709678 166.6761693 37.1375202
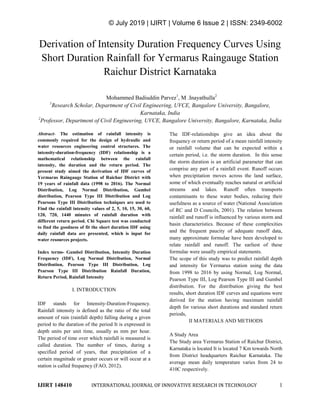
  • 6. © August 2017 | IJIRT | Volume 4 Issue 3 | ISSN: 2349-6002 IJIRT 144769 INTERNATIONAL JOURNAL OF INNOVATIVE RESEARCH IN TECHNOLOGY 6 Fig 3: IDF for Yermarus Raingauge Station by Log Normal Distribution Table 8 : Rainfall IDF Empirical Equation For Respective Return Period Using Log Normal Distribution Return Period (T) years i= x * (td)-y X Y 2 584.26 0.667 5 613.86 0.667 10 622.65 0.667 25 627.61 0.667 50 629.21 0.667 75 629.74 0.667 100 630.00 0.667 IV CONCLUSIONS Among the various available probability distribution functions Log_ Normal distribution had the best approximation of rainfall intensity for various return periods. Study showed that i = x * (td)-y was the best form of IDF empirical equation for Yermarus Raingauge Station Raichur It has been tabulated in Table 8. These IDF equations will help to estimate the rainfall intensity for any specific return period in Yermarus Raingauge Station Raichur in a short time and more easily. The results computed can be utilized for developing surface drain network for recharging ground water. REFERENCES
  • 7. © July 2019 | IJIRT | Volume 6 Issue 2 | ISSN: 2349-6002 IJIRT 148410 INTERNATIONAL JOURNAL OF INNOVATIVE RESEARCH IN TECHNOLOGY 7 [1] Bell F. C., 1969, “Generalized rainfall-duration- frequency relationship”, ASCE J. Hydraulic Eng., 95, 311–327. [2] Bernard, M. M., (1932), “Formulas for rainfall intensities of long durations”. Trans. ASCE 6:592 - 624. [3] Bhaskar, N. R.; Parida, B. P.; Nayak, A. K. 1997. Flood Estimation for Ungauged Catchments Using the GIUH. Journal of Water Resources Planning and Management, ASCE 123(4): 228-238. [4] Chow V.T., D.R. Maidment and L.W.Mays, 1988, “Applied Hydrology”, McGraw- Hill, Chapter 10 – Probability, Risk and Uncertainty Analysis for Hydrologic and Hydraulic Design: 361 – 398. [5] M. M. Rashid, 1 S. B. Faruque and 2 J. B. Alam 2012, “Modeling of Short Duration Rainfall Intensity Duration Frequency (SDRIDF) Equation for Sylhet City in Bangladesh. [6] Mohammed Badiuddin Parvez, M Inayathulla “Generation Of Intensity Duration Frequency Curves For Different Return Period Using Short Duration Rainfall For Manvi Taluk Raichur District Karnataka”, International Research Journal of Engineering and Management Studies (IRJEMS), Volume: 03 Issue: 04 | April -2019. [7] Mohammed Badiuddin Parvez, M Inayathulla “Prioritization Of Subwatersheds of Cauvery Region Based on Morphometric Analysis Using GIS”, International Journal for Research in Engineering Application & Management (IJREAM), Volume: 05 Issue: 01, April -2019. 4. [8] Mohammed Badiuddin Parvez, M Inayathulla “Modelling of Short Duration Isopluvial Map For Raichur District Karnataka”, International Journal for Science and Advance Research in Technology (IJSART), Volume: 05 Issue: 4, April -2019. [9] Mohammed Badiuddin Parvez, and M .Inayathulla. "Morphometry, Hypsometry Analysis and Runoff Estimation of Aam Talab Watershed Raichur, Karnataka" International Journal Of Advance Research And Innovative Ideas In Education Volume 5 Issue 3 2019 Page 1713-1727 [10]V.T.Chow, “Handbook of Applied Hydrology,” McGraw-Hill Book.