Prioritization Of Subwatersheds of Cauvery Region Based on Morphometric Analysis Using GIS Mohammed Badiudin Parvez

Prioritization of watershed has picked up significance in watershed management. Morphometic analysis is been commonly applied to prioritize the watershed. The present study makes an effort to organize subwatersheds dependent on morphometric characteristics using GIS techniques in Part of Cauvery region. There are twenty three Subwatersheds under this. Various morphometric parameters namely Bifurcation ratio(Rb), Drainage density(Dd), Stream frequency(Ns), Texture ratio(T), Form factor(Rf), Circularity ratio(Rc), Elongation Ratio(Re), length of overland flow, shape factor(Bs), drainage texture, compactness ratio (Cc) has been determined for each subwatershed and allotted position on premise of relationship as to arrive at a computed value for final ranking of subwatershed.

Recommended
Recommended
More Related Content
What's hot
What's hot (20)
Similar to Prioritization Of Subwatersheds of Cauvery Region Based on Morphometric Analysis Using GIS Mohammed Badiudin Parvez
Similar to Prioritization Of Subwatersheds of Cauvery Region Based on Morphometric Analysis Using GIS Mohammed Badiudin Parvez (20)
More from Mohammed Badiuddin Parvez
More from Mohammed Badiuddin Parvez (20)
Recently uploaded
Recently uploaded (20)
Prioritization Of Subwatersheds of Cauvery Region Based on Morphometric Analysis Using GIS Mohammed Badiudin Parvez
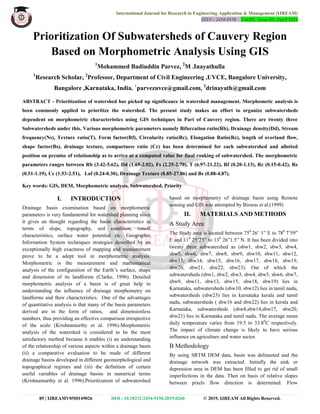
- 1. International Journal for Research in Engineering Application & Management (IJREAM) ISSN : 2454-9150 Vol-05, Issue-01, April 2019 85 | IJREAMV05I0149026 DOI : 10.18231/2454-9150.2019.0260 © 2019, IJREAM All Rights Reserved. Prioritization Of Subwatersheds of Cauvery Region Based on Morphometric Analysis Using GIS 1 Mohammed Badiuddin Parvez, 2 M .Inayathulla 1 Research Scholar, 2 Professor, Department of Civil Engineering ,UVCE, Bangalore University, Bangalore ,Karnataka, India. 1 parvezuvce@gmail.com, 2 drinayath@gmail.com ABSTRACT - Prioritization of watershed has picked up significance in watershed management. Morphometic analysis is been commonly applied to prioritize the watershed. The present study makes an effort to organize subwatersheds dependent on morphometric characteristics using GIS techniques in Part of Cauvery region. There are twenty three Subwatersheds under this. Various morphometric parameters namely Bifurcation ratio(Rb), Drainage density(Dd), Stream frequency(Ns), Texture ratio(T), Form factor(Rf), Circularity ratio(Rc), Elongation Ratio(Re), length of overland flow, shape factor(Bs), drainage texture, compactness ratio (Cc) has been determined for each subwatershed and allotted position on premise of relationship as to arrive at a computed value for final ranking of subwatershed. The morphometric parameters ranges between Rb (3.42-5.62), Dd (1.65-2.02), Fs (2.25-2.70), T (6.97-21.22), Rf (0.20-1.13), Rc (0.15-0.42), Re (0.51-1.19), Cc (1.53-2.51), Lof (0.24-0.30), Drainage Texture (8.85-27.06) and Bs (0.88-4.87). Key words: GIS, DEM, Morphometric analysis, Subwatershed, Priority I. INTRODUCTION Drainage basin examination based on morphometric parameters is very fundamental for watershed planning since it gives an thought regarding the basin characteristics in terms of slope, topography, soil condition, runoff characteristics, surface water potential etc. Geographic Information System techniques strategies described by an exceptionally high exactness of mapping and measurement prove to be a adept tool in morphometric analysis. Morphometric is the measurement and mathematical analysis of the configuration of the Earth’s surface, shape and dimension of its landforms (Clarke, 1996). Detailed morphometric analysis of a basin is of great help in understanding the influence of drainage morphometry on landforms and their characteristics. One of the advantages of quantitative analysis is that many of the basin parameters derived are in the form of ratios, and dimensionless numbers, thus providing an effective comparison irrespective of the scale (Krishnamurthy et al. 1996).Morphometric analysis of the watershed is considered to be the most satisfactory method because it enables (i) an understanding of the relationship of various aspects within a drainage basin (ii) a comparative evaluation to be made of different drainage basins developed in different geomorphological and topographical regimes and (iii) the definition of certain useful variables of drainage basins in numerical terms (Krishnamurthy et al. 1996).Prioritization of subwatershed based on morphometry of drainage basin using Remote sensing and GIS was attempted by Biswas et al.(1999) II. MATERIALS AND METHODS A Study Area The Study area is located between 750 26’ 1” E to 780 7’59” E and 110 25’23” to 130 26”1.5” N. It has been divided into twenty three subwatershed as (sbw1, sbw2, sbw3, sbw4, sbw5, sbw6, sbw7, sbw8, sbw9, sbw10, sbw11, sbw12, sbw13, sbw14, sbw15, sbw16, sbw17, sbw18, sbw19, sbw20, sbw21, sbw22, sbw23). Out of which the subwatersheds (sbw1, sbw2, sbw3, sbw4, sbw5, sbw6, sbw7, sbw9, sbw11, sbw13, sbw15, sbw18, sbw19) lies in Karnataka, subwatersheds (sbw10, sbw12) lies in tamil nadu, subwatersheds (sbw23) lies in karnataka kerala and tamil nadu, subwatersheds ( sbw16 and sbw22) lies in kerala and Karnataka, subwatersheds (sbw8,sbw14,sbw17, sbw20, sbw21) lies in Karnataka and tamil nadu. The average mean daily temperature varies from 19.5 to 33.80 C respectively. The impact of climate change is likely to have serious influence on agriculture and water sector. B Methodology By using SRTM DEM data, basin was delineated and the drainage network was extracted. Initially the sink or depression area in DEM has been filled to get rid of small imperfections in the data. Then on basis of relative slopes between pixels flow direction is determined. Flow
- 2. International Journal for Research in Engineering Application & Management (IJREAM) ISSN : 2454-9150 Vol-05, Issue-01, April 2019 86 | IJREAMV05I0149026 DOI : 10.18231/2454-9150.2019.0260 © 2019, IJREAM All Rights Reserved. accumulation grid has been prepared using this data. Stream order was generated using above data on the basis of drainage flow direction watershed was divided into twenty three subwatersheds designated as sbw1 to sbw23 as show in figure. Morphometric aspects such as Bifurcation ratio(Rb), Drainage density(Dd), Stream frequency(Ns), Texture ratio(T), Form factor(Rf), Circularity ratio(Rc), Elongation Ratio(Re), length of overland flow, shape factor(Bs), drainage texture, compactness ratio(Cc) is calculated using formulas and are shown in table 4. The total area(A), perimeter(P) of twenty three subwatersheds is calculated using Arc GIS and values are tabulated in table 2. III. RESULTS AND DISCUSSIONS A Morphometric analysis Designation ofStream order is the first step in morphometric analysis of a drainage basin, based on the hierarchic making of streams proposed by Strahler (1964). In the study area sbw1, sbw2, sbw3, sbw5, sbw6, sbw7, sbw8, sbw11, sbw13, sbw16, sbw18, sbw20, sbw21, sbw22 are of seventh order, sbw4,sbw10, sbw12, sbw17, sbw19, sbw23 are of sixth order where as sbw9, sbw14, sbw15 are of eighth order streams.The morphometric parameters were calculated its shows that Bifurcation ratio(Rb) ranges from 3.42 to 5.62 sbw14 have low Rb whereas sbw7 have high Rb. Drainage density (Dd) is low in sbw20 and high in sbw15 its value ranges from 1.65 to 2.02. Stream frequency (Ns) varies from 2.25 to 2.70 with sbw10 having low and sbw2 has high value. Texture ratio (T) ranges from 6.97 to 21.12 with low in sbw14 and high in sbw2. Form factor(Rf) is low in sbw17 and high in sbw22 it ranges from 0.20 to 1.13. Drainage Texture ranges from 8.85 to 27.06 with high in sbw2 and low in sbw10. Length of overland flow varies from 0.24 to 0.30. Basin shape(Bs) is low in sbw22 and high in sbw17 it ranges from 0.88 to 4.87. Compactness coefficient(Cc) show wide variation across the subwatershed it is more in sbw15 and less in sbw6 it varies from 1.53 to 2.51. Elongation ratio(Re) varies from 0.51 to 1.19 with sbw17 has low and sbw22 has high value. Circularity ratio(Rc) of subwatersheds ranges from 0.15 to 0.48 with low in sbw15 and high in sbw6. Figure 3 Regression of Drainage density on Stream frequency Figure 1 location map of study area Figure 2 Subwatershed map 2.2 2.4 2.6 2.8 1.00 10.00 StreamFrequency Drainage Density
- 3. International Journal for Research in Engineering Application & Management (IJREAM) ISSN : 2454-9150 Vol-05, Issue-01, April 2019 87 | IJREAMV05I0149026 DOI : 10.18231/2454-9150.2019.0260 © 2019, IJREAM All Rights Reserved. Morphometric Methods ReferencesParameters Stream order (U) Hierarchical order Strahler,1964 Stream length (Lu) Length of the stream Horton,1945L I N E A R Mean stream Lsm= Lu/Nu;where,Lu=Stream length of Horton,1945length (Lsm) order‘U’Nu=Total number of stream segments of order‘U’ Stream length Rl=Lu/Lu-1;whereLu=Total stream length Horton,1945ratio (Rl) of order‘U’,Lu-1=Stream length of next lower order Bifurcation ratio (Rb) Rb=Nu/Nu+1;where,Nu=Total number of Schumn,1956stream segment of order‘u’;Nu+1=Number of segment of next higher order Drainage density (Dd) Dd=L/A where, L=Total length of streams Horton,1945 ;A=Area of watershed Dt=N/PDrainage Texture Stream frequency (Fs) Fs=N/A; where, N=Total number of streams Horton,1945 ;A=Area of watershed Texture ratio (T) T= N1/P;where,N1=Total number of first Horton,1945Order streams ;P=Perimeter of watershed Form factor (Rf) Rf=A/(Lb) 2 ;where,A=Area of watershed, Horton,1932 Lb=Basin length Circulatory ratio (Rc) Rc=4πA/P 2 ;where,A=Area of watershed, Miller,1953 π=3.14,P=Perimeter of watershed Elongation ratio (Re) Re=2√(A/π)/Lb; where, A=Area of Schumn,1956 watershed, π=3.14,Lb=Basin length Length of overland Horton,1945 flow (Lof) Lof=1/2Dd;where,Dd=Drainage density Constant of channel C=1/Dd; where, Dd=Drainage density Schumn,1956maintenance (Ccm) Compactness ratio (Cc) Cc=0.2821*P/A 2 ;where, P=Perimeter of the Horton,1945 basin(km), A=Area of the basin (km 2 ) Table 1: Formula adopted for computation of morphometric parameters for the study area Table 2 : Subwatersheds of Cauvery Catchment Subwatersheds Area(km2 ) Perimeter(km) Length(km) Width(km) Sbw1 1647.71 278.23 71.04 40.59 Sbw2 4893.82 489.03 76.54 98.01 Sbw3 2912.77 389.93 75.85 42.03 Sbw4 870.69 168.97 50.71 25.95 Sbw5 2668.08 319.65 81.1 47.4 Sbw6 1451.32 206.74 59.97 33.7 Sbw7 3787.47 379.16 84.29 65.78 Sbw8 1642.8 304.34 50.49 37.21 Sbw9 1526.64 285.9 68.06 38.69 Sbw10 529.53 134.78 34.17 22.99 Sbw11 1761.97 279.44 50.77 39.19 Sbw12 1488.17 272.03 58.39 27.86 Sbw13 1917.59 337.83 79.02 34.18 Sbw14 1154.2 296.77 54.96 35.52 Sbw15 1499.29 344.45 50.4 26.29 Sbw16 3775.96 423.22 92.21 60.18 Sbw17 788.63 199.57 62 25.91 Sbw18 1022.04 219.29 59.88 25.19 Sbw19 1199.12 209.31 50.54 27 Sbw20 1698.49 283.89 58.02 36.64 Sbw21 817 172.12 30.64 41.2 Sbw22 1473.54 270.11 36.11 42.04 Sbw23 610.22 148.72 31.96 28.8 Table 3: Linear Morphometric Characteristics of Subwatersheds in Study area
- 4. International Journal for Research in Engineering Application & Management (IJREAM) ISSN : 2454-9150 Vol-05, Issue-01, April 2019 88 | IJREAMV05I0149026 DOI : 10.18231/2454-9150.2019.0260 © 2019, IJREAM All Rights Reserved. Subwatershed Stream order No of Streams Total length of Streams (km) Cumulative Length(km) Mean Stream Length(km) Bifurcation Ratio Length Ratio Sbw1 1 3451 1525.81 1525.81 0.44 2 698 734.51 2260.32 1.05 4.94 2.38 3 154 392.07 2652.39 2.55 4.53247 2.42 4 32 188.35 2840.74 5.89 4.8125 2.31 5 5 45.39 2886.13 9.08 6.4 1.54 6 2 74.82 2960.95 37.41 2.5 4.12 7 1 17.89 2978.84 17.89 2 0.48 Sbw2 1 10380 5068.12 5068.12 0.49 2 2255 2435.78 7503.90 1.08 4.60 2.21 3 470 1126.43 8630.33 2.40 4.79787 2.22 4 101 581.20 9211.53 5.75 4.65347 2.40 5 22 298.33 9509.86 13.56 4.59091 2.36 6 5 172.58 9682.44 34.52 4.4 2.55 7 1 42.21 9724.65 42.21 5 1.22 Sbw3 1 5524 2769.59 2769.59 0.50 2 1130 1320.29 4089.88 1.17 4.89 2.33 3 247 581.11 4670.99 2.35 4.5749 2.01 4 60 342.00 5012.99 5.70 4.11667 2.42 5 15 132.07 5145.06 8.80 4 1.54 6 2 149.33 5294.39 74.67 7.5 8.48 7 1 2.20 5296.59 2.20 2 0.03 Sbw4 1 1654 791.42 791.42 0.48 2 347 385.05 1176.47 1.11 4.77 2.32 3 71 212.76 1389.23 3.00 4.88732 2.70 4 18 98.71 1487.94 5.48 3.94444 1.83 5 5 56.58 1544.52 11.32 3.6 2.06 6 1 36.74 1581.26 36.74 5 3.25 Sbw5 1 5420 2553.86 2553.86 0.47 2 1154 1279.98 3833.84 1.11 4.70 2.35 3 248 620.02 4453.86 2.50 4.65323 2.25 4 49 233.96 4687.82 4.77 5.06122 1.91 5 10 176.63 4864.45 17.66 4.9 3.70 6 3 23.10 4887.55 7.70 3.33333 0.44 7 1 112.40 4999.95 112.40 3 14.60 Sbw6 1 2727 1309.65 1309.65 0.48 2 580 649.07 1958.72 1.12 4.70 2.33 3 125 285.08 2243.80 2.28 4.64 2.04 4 32 180.90 2424.70 5.65 3.90625 2.48 5 8 64.31 2489.01 8.04 4 1.42 6 - - 2489.01 - - - 7 1 84.09 2573.10 84.09 - - Sbw7 1 7714 3734.21 3734.21 0.48 2 1636 1870.28 5604.49 1.14 4.72 2.36 3 349 883.41 6487.90 2.53 4.687679 2.21 4 70 459.70 6947.60 6.57 4.985714 2.59 5 13 228.41 7176.01 17.57 5.384615 2.68 6 1 38.81 7214.82 38.81 13 2.21 7 1 105.93 7320.75 105.93 1 2.73 Sbw8 1 3187 1543.18 1543.18 0.48 2 668 762.07 2305.25 1.14 4.77 2.36 3 145 361.44 2666.69 2.49 4.606897 2.18 4 31 168.81 2835.50 5.45 4.677419 2.18 5 7 81.32 2916.82 11.62 4.428571 2.13 6 3 25.32 2942.14 8.44 2.333333 0.73 7 1 79.57 3021.71 79.57 3 9.43 Sbw9 1 2987 1522.22 1522.22 0.51 2 629 745.43 2267.65 1.19 4.75 2.33 3 141 339.12 2606.77 2.41 4.460993 2.03 4 31 163.24 2770.01 5.27 4.548387 2.19 5 5 85.03 2855.04 17.01 6.2 3.23 6 1 6.23 2861.27 6.23 5 0.37 7 2 6.91 2868.18 3.46 0.5 0.55 8 1 69.83 2938.01 69.83 2 20.21 Sbw10 1 942 470.04 470.04 0.50 2 198 226.48 696.52 1.14 4.76 2.29
- 5. International Journal for Research in Engineering Application & Management (IJREAM) ISSN : 2454-9150 Vol-05, Issue-01, April 2019 89 | IJREAMV05I0149026 DOI : 10.18231/2454-9150.2019.0260 © 2019, IJREAM All Rights Reserved. 3 40 136.78 833.30 3.42 4.95 2.99 4 10 52.82 886.12 5.28 4 1.54 5 3 22.47 908.59 7.49 3.333333 1.42 6 1 23.46 932.05 23.46 3 3.13 Sbw11 1 3333 1645.31 1645.31 0.49 2 728 773.62 2418.93 1.06 4.58 2.15 3 167 384.06 2802.99 2.30 4.359281 2.16 4 39 199.97 3002.96 5.13 4.282051 2.23 5 10 101.83 3104.79 10.18 3.9 1.99 6 2 79.73 3184.52 39.87 5 3.91 7 1 1.83 3186.35 1.83 2 0.05 Sbw12 1 2741 1383.29 1383.29 0.50 2 595 666.09 2049.38 1.12 4.61 2.22 3 126 350.61 2399.99 2.78 4.722222 2.49 4 34 190.14 2590.13 5.59 3.705882 2.01 5 8 61.16 2651.29 7.65 4.25 1.37 6 1 78.31 2729.60 78.31 8 10.24 Sbw13 1 3527 1700.23 1700.23 0.48 2 743 891.56 2591.79 1.20 4.75 2.49 3 158 392.42 2984.21 2.48 4.702532 2.07 4 32 192.69 3176.90 6.02 4.9375 2.42 5 7 82.95 3259.85 11.85 4.571429 1.97 6 2 73.13 3332.98 36.57 3.5 3.09 7 1 57.92 3390.90 57.92 2 1.58 Sbw14 1 2070 1006.79 1006.79 0.49 2 453 482.92 1489.71 1.07 4.57 2.19 3 107 294.86 1784.57 2.76 4.233645 2.58 4 22 123.74 1908.31 5.62 4.863636 2.04 5 4 23.79 1932.10 5.95 5.5 1.06 6 3 16.60 1948.70 5.53 1.333333 0.93 7 2 2.30 1951.00 1.15 1.5 0.21 8 1 81.24 2032.24 81.24 2 70.64 Sbw15 1 3058 1561.79 1561.79 0.51 2 663 742.96 2304.75 1.12 4.61 2.19 3 144 385.86 2690.61 2.68 4.604167 2.39 4 30 174.25 2864.86 5.81 4.8 2.17 5 5 54.58 2919.44 10.92 6 1.88 6 2 19.85 2939.29 9.93 2.5 0.91 7 3 4.22 2943.51 1.41 0.666667 0.14 8 1 87.74 3031.25 87.74 3 62.37 Sbw16 1 7043 3332.77 3332.77 0.47 2 1422 1686.87 5019.64 1.19 4.95 2.51 3 313 857.69 5877.33 2.74 4.543131 2.31 4 62 379.52 6256.85 6.12 5.048387 2.23 5 13 160.94 6417.79 12.38 4.769231 2.02 6 5 96.44 6514.23 19.29 2.6 1.56 7 1 148.88 6663.11 148.88 5 7.72 Sbw17 1 1524 712.10 712.10 0.47 2 313 354.64 1066.74 1.13 4.87 2.42 3 61 182.01 1248.75 2.98 5.131148 2.63 4 11 84.16 1332.91 7.65 5.545455 2.56 5 3 69.69 1402.60 23.23 3.666667 3.04 6 1 15.63 1418.23 15.63 3 0.67 Sbw18 1 2026 979.29 979.29 0.48 2 412 487.35 1466.64 1.18 4.92 2.45 3 85 259.17 1725.81 3.05 4.847059 2.58 4 21 132.34 1858.15 6.30 4.047619 2.07 5 5 70.34 1928.49 14.07 4.2 2.23 6 1 15.63 1944.12 15.63 5 1.11 7 1 48.80 1992.92 48.80 1 3.12 Sbw19 1 2523 1200.63 1200.63 0.48 2 516 554.26 1754.89 1.07 4.89 2.26 3 113 331.75 2086.64 2.94 4.566372 2.73 4 26 135.09 2221.73 5.20 4.346154 1.77 5 6 68.05 2289.78 11.34 4.333333 2.18 6 1 57.32 2347.10 57.32 6 5.05 Sbw20 1 3133 1380.40 1380.40 0.44
- 6. International Journal for Research in Engineering Application & Management (IJREAM) ISSN : 2454-9150 Vol-05, Issue-01, April 2019 90 | IJREAMV05I0149026 DOI : 10.18231/2454-9150.2019.0260 © 2019, IJREAM All Rights Reserved. 2 688 674.88 2055.28 0.98 4.55 2.23 3 152 392.53 2447.81 2.58 4.526316 2.63 4 36 180.81 2628.62 5.02 4.222222 1.94 5 10 98.72 2727.34 9.87 3.6 1.97 6 2 56.65 2783.99 28.33 5 2.87 7 1 20.58 2804.57 20.58 2 0.73 Table 3 Continued Subwatershed Stream order No of Streams Total length of Streams (km) Cumulative Length(km) Mean Stream Length(km) Bifurcation Ratio Length Ratio Sbw21 1 1507 713.80 713.80 0.47 2 320 358.52 1072.32 1.12 4.71 2.37 3 65 182.34 1254.66 2.81 4.923077 2.50 4 18 87.66 1342.32 4.87 3.611111 1.74 5 4 58.36 1400.68 14.59 4.5 3.00 6 2 19.76 1420.44 9.88 2 0.68 7 1 1.94 1422.38 1.94 2 0.20 Sbw22 1 2830 1444.39 1444.39 0.51 2 624 695.85 2140.24 1.12 4.54 2.18 3 145 334.33 2474.57 2.31 4.303448 2.07 4 29 177.77 2652.34 6.13 5 2.66 5 9 86.24 2738.58 9.58 3.222222 1.56 6 3 44.65 2783.23 14.88 3 1.55 7 1 16.16 2799.39 16.16 3 1.09 Sbw23 1 1179 549.56 549.56 0.47 2 282 295.89 845.45 1.05 4.18 2.25 3 63 129.54 974.99 2.06 4.47619 1.96 4 11 78.68 1053.67 7.15 5.727273 3.48 5 3 34.90 1088.57 11.63 3.666667 1.63 6 1 24.69 1113.26 24.69 3 2.12 B Priortization of subwatersheds Morphometric aspects such as Bifurcation ratio(Rb), Drainage density(Dd), Stream frequency(Ns), Texture ratio(T), Form factor(Rf), Circularity ratio(Rc), Elongation Ratio(Re), length of overland flow, Basin Shape(Bs), drainage texture, compactness ratio(Cc) are also termed as erosin risk assessment parameters and have been used for prioritizing subwatersheds (Biswas et al 1999). The parameters such as Bifurcation ratio(Rb), Drainage density(Dd), Drainage Texture, Stream frequency(Ns), Texture ratio(T),have a direct relationship with erodibility higher values of all these have been rated as rank 1 second largest is rated as rank 2 and so on with the least ranked last. Parameters such as Form factor(Rf), Circularity ratio(Rc), Elongation Ratio(Re), Basin Shape(Bs) have inverse relationship with the erodibility higher the value less is erosion lower the value high is erodibility. In this manner least estimations of this is appraised as rank 1 and second least been rated as rank 2 and so on and the highest values is given last rank.after the ranking has been done based on every single parameters of each subwatershed were added up for each of the twenty three subwatersheds to arrive at compound value. Based on the average value of these parameters. Subwatershed with least rating was assigned highest rank next value was assigned second rank and so on and the subwatershed with highest compound value was assigned last rank. Hence on basis of morphometric analysis subwatershed 2 is considered highly erosive and given first priority and the subwatershed 22 is given the last priority. The subwatershed were further grouped into three classes as High (5-9.99), Medium(9.99-14.99), Low(14.99-20) based on the compound values.
- 7. International Journal for Research in Engineering Application & Management (IJREAM) ISSN : 2454-9150 Vol-05, Issue-01, April 2019 91 | IJREAMV05I0149026 DOI : 10.18231/2454-9150.2019.0260 © 2019, IJREAM All Rights Reserved. Figure 4 Spatial Analysis of Morphometric Parameters
- 8. International Journal for Research in Engineering Application & Management (IJREAM) ISSN : 2454-9150 Vol-05, Issue-01, April 2019 92 | IJREAMV05I0149026 DOI : 10.18231/2454-9150.2019.0260 © 2019, IJREAM All Rights Reserved. Table 4 :Results of Morphometric Analysis Sub watershed Bifurcation ratio mean Drainage density Stream frequency Texture ratio Form factor Circularity ratio Elongation ratio Compactness coefficient Length of overland flow Drainage texture Basin shape Sbw1 4.196 1.8133693 2.64380201 12.4 0.325503 0.2665278 0.6439359 1.93699583 0.2757298 15.609387 3.07216830 Sbw2 4.672 1.9871286 2.70422696 21.22 0.835355 0.2570198 1.0315747 1.97249852 0.2516193 27.061734 1.19709584 Sbw3 4.511 1.8184031 2.39600106 14.16 0.5062849 0.2406149 0.8030871 2.03863151 0.2749665 17.898084 1.97517225 Sbw4 4.438 1.8229909 2.40728618 9.78 0.3385917 0.38303106 0.65675493 1.61578289 0.2742745 12.404568 2.95340948 Sbw5 4.273 1.87398804 2.58050733 16.95 0.4056552 0.32797374 0.71885904 1.74614565 0.2668106 21.539183 2.46514722 Sbw6 4.31 1.77293774 2.39299396 13.19 0.4035478 0.42648503 0.71698936 1.53125705 0.2820178 16.798877 2.47802062 Sbw7 5.62 1.9328866 2.58325478 20.34 0.5330857 0.33089775 0.82406927 1.73841353 0.2586804 25.804409 1.87587072 Sbw8 3.96 1.83936572 2.46043341 10.47 0.6444273 0.22276977 0.90604997 2.11871172 0.2718328 13.281198 1.55176534 Sbw9 3.92 1.92449431 2.48716135 10.44 0.3295738 0.23458377 0.64795008 2.06467176 0.2598085 13.280867 3.03422129 Sbw10 4.008 1.76014579 2.25482975 6.98 0.4535243 0.36612493 0.7600908 1.65266697 0.2840673 8.8588811 2.20495326 Sbw11 4.018 1.80840196 2.42909925 11.92 0.6835718 0.28340728 0.93316247 1.87842776 0.2764872 15.316347 1.46290396 Sbw12 5.05 1.83419905 2.35524167 10.07 0.4364913 0.2525856 0.74568081 1.98973715 0.2725985 12.884608 2.29099639 Sbw13 4.075 1.76831335 2.33105095 10.44 0.3071013 0.21103232 0.62546934 2.17683502 0.2827553 13.231507 3.25625415 Sbw14 3.42 1.76073471 2.30635938 6.97 0.3821093 0.16460034 0.69768435 2.46481678 0.2839723 8.9699093 2.61705215 Sbw15 3.73 2.02179031 2.60523314 8.87 0.5902344 0.1587168 0.86711651 2.51008569 0.2473055 11.339817 1.69424194 Sbw16 4.481 1.7646135 2.34615833 16.61 0.4440903 0.26477968 0.75214373 1.94337974 0.2833481 20.932375 2.25179400 Sbw17 4.44 1.7983465 2.42572563 7.63 0.2051586 0.24869807 0.5112227 2.00522814 0.2780331 9.5856090 4.87427564 Sbw18 4 1.94994325 2.49598842 9.23 0.2850302 0.26694382 0.60258363 1.93548612 0.2564177 11.632997 3.50829165 Sbw19 4.82 1.95735206 2.65611448 12.05 0.4694530 0.34377345 0.77332359 1.70554756 0.2554471 15.216664 2.13013843 Sbw20 5.21 1.65121373 2.36798568 11.03 0.5045538 0.26469909 0.80171303 1.94367558 0.3028075 14.167459 1.98194890 Sbw21 3.62 1.74097919 2.34638923 8.75 0.8702510 0.34637698 1.05290076 1.69912562 0.2871947 11.137578 1.14909375 Sbw22 3.84 1.89977198 2.47092037 10.48 1.1300741 0.25367066 1.19982705 1.98547708 0.2631894 13.479693 0.88489766 Sbw23 4.2 1.82435843 2.52204123 7.92 0.5974105 0.3465272 0.8723718 1.69875731 0.2740689 10.348305 1.67389072
- 9. International Journal for Research in Engineering Application & Management (IJREAM) ISSN : 2454-9150 Vol-05, Issue-01, April 2019 93 | IJREAMV05I0149026 DOI : 10.18231/2454-9150.2019.0260 © 2019, IJREAM All Rights Reserved. Table 5: Priorities of Sub watersheds and their ranks Subwaters hed Bifurcatio n ratio Drainage Density Stream Frequenc y Texture Ratio Form Factor Circularity Ratio Elongation Ratio Compactn ess Coefficien t Length of overland flow Drainage Texture Basin Shape Compoun d Paramete r Final Rank Sbw1 13 14 3 7 4 13 4 11 14 7 20 10 5 Sbw2 5 2 1 1 21 10 21 14 2 1 3 7.36363 1 Sbw3 6 13 15 5 15 6 15 18 13 5 9 10.9090 8 Sbw4 9 12 14 16 6 22 6 2 12 16 18 12.0909 13 Sbw5 11 8 6 3 9 16 9 8 8 3 15 8.72727 4 Sbw6 10 17 16 6 8 23 8 1 17 6 16 11.6363 10 Sbw7 1 5 5 2 16 17 16 7 5 2 8 7.63636 2 Sbw8 18 9 11 12 19 4 19 20 9 12 5 12.5454 15 Sbw9 19 6 9 13 5 5 5 19 6 13 19 10.8181 7 Sbw10 16 21 23 22 12 21 12 3 21 23 12 16.9090 22 Sbw11 15 15 12 9 20 15 20 9 15 8 4 12.9090 16 Sbw12 3 10 18 15 10 8 10 16 10 15 14 11.7272 11 Sbw13 14 18 21 14 3 3 3 21 18 14 21 13.6363 20 Sbw14 23 20 22 23 7 2 7 22 20 22 17 16.8181 21 Sbw15 21 1 4 18 17 1 17 23 1 18 7 11.6363 9 Sbw16 7 19 20 4 11 12 11 12 19 4 13 12 12 Sbw17 8 16 13 21 1 7 1 17 16 21 23 13.0909 17 Sbw18 17 4 8 17 2 14 2 10 4 17 22 10.6363 6 Sbw19 4 3 2 8 13 18 13 6 3 9 11 8.18181 3 Sbw20 2 23 17 10 14 11 14 13 23 10 10 13.3636 19 Sbw21 22 22 19 19 22 19 22 5 22 19 2 17.5454 23 Sbw22 20 7 10 11 23 9 23 15 7 11 1 12.4545 14 Sbw23 12 11 7 20 18 20 18 4 11 20 6 13.3636 18 IV. CONCLUSIONS Stream frequency(Ns) for present study is low demonstrating relatively a low runoff. The length of overland flow(lof) for majority of the subwatersheds in the present study is more than 0.25 hence they have longer flowpaths associated with more infiltration and reduced runoff. Higher value of form factor(Rf) indicates wider basin and lower value indicates narrow basin. Drainage density varies from1.65 km/km2 to 2.02 km/km2 indicating all the subwatershed fall under coarse texture. Circularity ratio ranges between 0.15 to 0.42 when it is closer to 1 the basin is more likely to be circular. We can also conclude that in case of non availability of soil maps this type of study could be used in selecting area for soil conservation measure. The priority have been shown in figure 5.
- 10. International Journal for Research in Engineering Application & Management (IJREAM) ISSN : 2454-9150 Vol-05, Issue-01, April 2019 94 | IJREAMV05I0149026 DOI : 10.18231/2454-9150.2019.0260 © 2019, IJREAM All Rights Reserved. Figure 5 Priority Map REFERENCES [1] Agarwal. C.S (1998). Study of drainage pattern through aerial data in Naugarhareao of Varnasi district, U.P.Jour.Indian Soc. Remote Sensing 26:169-175 [2] Biswas S, Sudhakar S, and Desai, V.R. 1999,Prioritistion of sub-watersheds based on morphometric analysis of drainage basin, district Midnapore, West Bengal. Journal of Indian Society of Remotesensing, Vol.27(3) pp 155-166. [3] Clarke, J.I. (1996). Morphometry from Maps. Essays in geomorphology. Elsevier Publications, New York. pp. 235 – 274. [4] HortonR. E.(1945). Erosional Development of streams and their drainage basins, Hydro physical approach to quantitative morphology. Geological Society of American Bulletin. 56: 275-370. [5] Horton,R.E.(1932).Drainage Basin Characteristics. Transfixions of Am.Geophysics.Union, 13:350 [6] Schumn,S.A.(1956).Evolution of drainage systems and slopes in Badland, at Perth Amboy, NewJersey. Geological Society of America,Bulletin.67:597-646. [7] Javed A, Khanday MV, Ahmed R (2009) Prioritization of subwatershed based on morphometric and land use analysis using remote sensing and GIS techniques. Indian Soc Remote Sens 37:261–274 [8] Strahler.A.N(1964) : Quantitative geomorphology of drainage basin sand channel net works, section 4II, in: Handbook of Applied Hydrology, edited by V.T.Chow, Mc GrawHill:439 [9] Vijith, H and Sateesh, R. (2006). GIS based morphometric analysis of two major upland Sub-watershed of Meenachil river in Kerala. Journal of Indian society of Remote Sensing. 34(2): 181-185