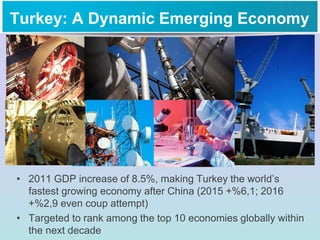
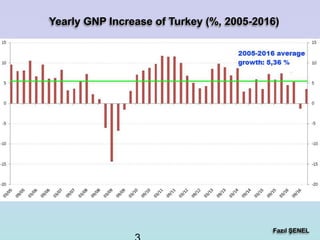
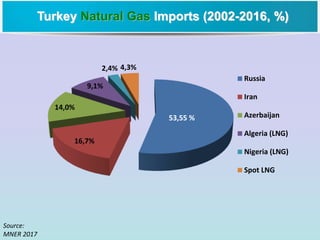
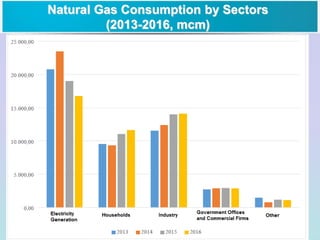
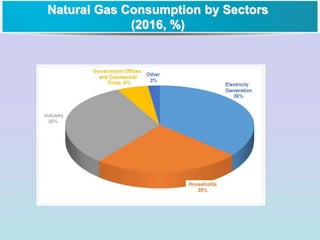
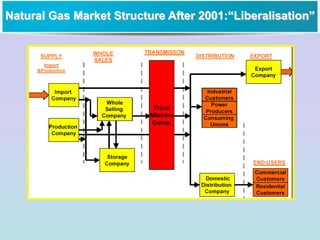
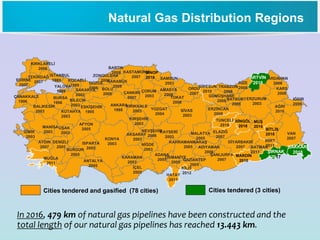
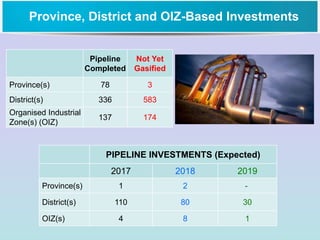
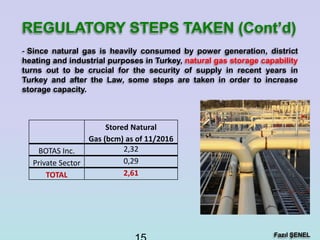
Energy Market Regulatory Authority
Board Member
Milano, May 31, 2017
• 2011 GDP increase of 8.5%, making Turkey the world’s
fastest growing economy after China (2015 +%6,1; 2016
+%2,9 even coup attempt)
• Targeted to rank among the top 10 economies globally within
the next decade
Turkey: A Dynamic Emerging Economy
Fazıl ŞENEL
Yearly GNP Increase of Turkey (%, 2005-2016)
EMRA
• The sole regulator of
the Turkish electricity,
natural gas, LPG and
fuel and lubricants
markets.
• The architect of the
liberalisation and
regulation of the
Turkish energy market.
EMRA
• An independent public entity with
administrative and financial
autonomy established in 2001.
• Functions:
– Issue regulations
– License market participants
– Approve tariffs
– Monitor, supervise and audit
markets and market players
• Governed by a 7-member
board
• $100 million annual
budget drawn from
licensing revenues
• Budget is independent of
any other governmental
institution
Turkey Natural Gas Consumption and
Production (2002-2016)
Source: MNER 2017
Year
Consumption
(bcm)
2002 17,065
2003 21,384
2004 22,505
2005 27,467
2006 31,128
2007 34,600
2008 36,100
2009 34,400
2010 36,900
2011 43,800
2012 45,242
2013 45,270
2014 48,717
2015 47,999
2016 46,146
Average Yearly Consumption Increase:
7,83 %
0
5
10
15
20
25
30
35
40
45
50
2002 2003 2004 2005 2006 2007 2008 2009 2010 2011 2012 2013 2014 2015 2016
Natural Gas Consumpion and Production (bcm)
Consumption Production
Turkey Natural Gas Imports (2002-2016, mcm)
Source:
MNER 2017
Turkey Natural Gas Imports (2002-2016, %)
Source:
MNER 2017
53,55 %
16,7%
14,0%
9,1%
2,4% 4,3%
Russia
Iran
Azerbaijan
Algeria (LNG)
Nigeria (LNG)
Spot LNG
Natural Gas Consumption by Sectors
(2013-2016, mcm)
Natural Gas Consumption by Sectors
(2016, %)
Fazıl ŞENEL
Regulatory Steps Taken For Natural
Gas Sector
- The main legislation of the natural gas market is the Natural Gas
Market Law No.4646, enacted with the objective of liberalising the
natural gas market.
- The dominant gas market player, State-owned company BOTAS, is
required by such law to reduce its market share in the import,
wholesale and distribution fields. In the following years, BOTAS’s
import contracts has been transferred gradually to other market
players through tenders.
- After the Law, however, the current
market share of BOTAS with regard to
imports still represents a high percent
of the natural gas import market, but
BOTAS’s market dominance
continuosly decreases in recent years.
Natural Gas Market Structure After 2001:“Liberalisation”
10th Anniversary
Natural Gas Distribution Regions
Cities tendered and gasified (78 cities) Cities tendered (3 cities)
KIRKLARELİ
2006
İSTANBUL
1989 KOCAELİ
1989YALOVA
1989
BURSA
1996
BİLECİK
2003 ESKİŞEHİR
1995
SAKARYA
2002
BOLU
2008
KARABÜK
2008
ANKARA
1988
KONYA
2003
KIRIKKALE
2003
AKSARAY
2003
KIRŞEHİR
2003
NEVŞEHİR
2008
NİĞDE
2003
ADANA
2005
HATAY
2011
KİLİS
2012
GAZİANTEP
2005
DÜZCE
1996
BARTIN
2009 KASTAMONU
2007
SİNOP
2016
ÇANKIRI
2007
ÇORUM
2003
SAMSUN
2003
AMASYA
2008
ZONGULDAK
2009
TOKAT
2008
SİVAS
2003
YOZGAT
2004
OSMANİYE
2005
MALATYA
2005
ADIYAMAN
2006
DİYARBAKIR
2007
ŞANLIURFA
2007
İÇEL
2005
KAHRAMANMARAŞ
2005
ELAZIĞ
2007
MUŞ
2016
TUNCELİ
2016
BİNGÖL
2016
BATMAN
2011
SİİRT
2011
ŞIRNAK
2017
HAKKARİ
2018
VAN
2007
ERZİNCAN
2008
ERZURUM
2003
KARS
2006
AĞRI
2016
IĞDIR
2009
ARDAHAN
2006
ARTVİN
2018RİZE
2008
BAYBURT
2006
TRABZON
2008
GÜMÜŞHANE
2008
GİRESUN
2010
ORDU
2007
KAYSERİ
2003
BİTLİS
2016
MARDİN
2016
KARAMAN
2003ANTALYA
2005
BURDUR
2005
ISPARTA
2005
AFYON
2005UŞAK
2003
DENİZLİ
2005
MUĞLA
2011
AYDIN
2007
EDİRNE
2007
TEKİRDAĞ
2007
ÇANAKKALE
1996
BALIKESİR
2003
MANİSA
2003İZMİR
2003
KÜTAHYA
2003
In 2016, 479 km of natural gas pipelines have been constructed and the
total length of our natural gas pipelines has reached 13.443 km.
10th Anniversary
Province, District and OIZ-Based Investments
PIPELINE INVESTMENTS (Expected)
2017 2018 2019
Province(s) 1 2 -
District(s) 110 80 30
OIZ(s) 4 8 1
Pipeline
Completed
Not Yet
Gasified
Province(s) 78 3
District(s) 336 583
Organised Industrial
Zone(s) (OIZ)
137 174
Fazıl ŞENEL
REGULATORY STEPS TAKEN (Cont’d)
- Since natural gas is heavily consumed by power generation, district
heating and industrial purposes in Turkey, natural gas storage capability
turns out to be crucial for the security of supply in recent years in
Turkey and after the Law, some steps are taken in order to increase
storage capacity.
Stored Natural
Gas (bcm) as of 11/2016
BOTAS Inc. 2,32
Private Sector 0,29
TOTAL 2,61
K. Marmara-Değirmenköy
16 mSm3/day
Tuzgölü
15 mSm3/day
Storage Exit Points and Capacities
17
2017 2018 2019 2020 2021 2022 2023
K. MARMARA-
DEĞİRMENKÖY
Storage (bcm) 2,84 2,84 2,84 2,84 3,34 3,84 4,6
Injection Capacity (mcm/day) 16 16 16 45 45 45 45
TUZGÖLÜ
Storage (bcm) 0,25 0,55 0,55 0,85 2,2 3,4 5,4
Injection Capacity (mcm/day) 15 30 30 30 60 60 60
TOTAL STORAGE
CAPACITY
Storage (bcm) 3,09 3,39 3,39 3,69 5,54 7,24 10
Injection Capacity (mcm/day) 31 46 46 75 105 105 105
Storage Exit Points and Capacities
MARSA
Gelibolu
0,43 mSm3/day
K.Marmara
Storage
20 (50-75)
mSm3/gün
Değirmenköy
Storage
5 Sm3/day
Tuzgölü
Storage
20 (40)
mSm3/day
TP Akçakoca
0,36 mSm3/gün
Storage and Production Entrance Points
(to transmission system) and Capacities
19
2017 2018 2019 2020 2021 2022 2023
K. MARMARA-
DEĞİRMENKÖY
Storage (bcm) 2,84 2,84 2,84 2,84 3,34 3,84 4,6
Send-out Capacity (mcm/day) 25 25 25 50 75 75 75
TUZGÖLÜ
Storage (bcm) 0,25 0,55 0,55 0,85 2,2 3,4 5,4
Send-Out Capacity (mcm/day) 13 20 20 30 60 60 60
TOTAL
Storage (bcm) 3,09 3,39 3,39 3,69 5,54 7,24 10
Send-out Capacity (mcm/day) 38 45 45 80 135 135 135
Storage Entrance Points (to transmission
system) and Capacities
Trans-Caspian
Trans-Iranian–
Turkmen Gas
via Arab Gas P/L
Egyptian Gas
Iraqi Gas
(ITGEP)
Shah Deniz BTE
Nabucco
ITGI
Arab Gas P/L
Phase-III
Blue
Stream-I
Blue Stream-II
[Medstream]
West Line
Trans-Caspian
Kazakh Gas
ITG
Iranian
Gas
South Pars
Map: Google Map
TAP
Iraqi Gas
(South)
Iraqi Gas
(Akkas)
Medstream
West-Balkan
Corridor (IAP)
Iraq-Turkey
Oil Pipeline
BTC
Samsun
Ceyhan
Turkish
Stream
TANAP
A Modern Day Silk Road
Malkoçlar FMS
WESTERN LINE
51,4 mSm3/day
45,1 mSm3/day
Gürbulak
(Bazargan FMS)
Iran-Turkey
28,6 mSm3/gün
Türkgözü FMS
Baku-Tbilisi-
Erzurum (BTE)
19,1 mSm3/day
Durusu FMS
BLUE STREAM
47,3 mSm3/day
Kıyıköy FMS
TURKISH STREAM
47 mSm3/day
Eskişehir FMS
TANAP
16,4 mSm3/day
Trakya FMS
TANAP
8,2 mSm3/day
PIPELINE ENTRANCE POINTS (i.e. for export)
and CAPACITIES
22
ENTRANCE POINTS 2017 2018 2019 2020 2021 2022 2023
MALKOÇLAR- Western Line 51,4 51,4 51,4 14,7 14,7 14,7 14,7
DURUSU- Blue Stream 48 48 48 48 48 48 48
GÜRBULAK- Iran-Turkey 28,5 28,5 28,5 28,5 28,5 28,5 28,5
TÜRKGÖZÜ-Shahdeniz 19 19 19 19 19 19 19
ESKİŞEHİR-TANAP 0 5,7 11,3 14 16,4 16,4 16,4
TRAKYA-TANAP 0 0 0 0 8,2 8,2 8,2
KIYIKÖY-Turkish Stream 0 0 0 46,9 46,9 46,9 46,9
TOTAL 146,9 152,6 158,2 171,1 181,7 181,7 181,7
PIPELINE ENTRANCE POINTS (for export) and
CAPACITIES
M. Ereğlisi LNG
22 (27-37)
mSm3/day
Aliağa LNG
24,5 (30-39)
mSm3/day
Aliağa FSRU
20 mSm3/day
Dörtyol FSRU
20 Sm3/day
Saros FSRU
20 Sm3/day
LNG Terminal Entrance Points and Capacities
24
ENTRANCE POINTS 2017 2018 2019 2020 2021 2022 2023
M. EREĞLİSİ LNG 22 37 37 37 37 37 37
ALİAĞA LNG 24,5 (39) 30,9 30,9 30,9 39 39 39
ALİAĞA FSRU 20 (20) 14,1 14,1 14,1 20 20 20
SAROS FSRU* 0 20 20 20 20 20 20
DÖRTYOL FSRU* 0 20 20 20 20 20 20
TOTAL 66,5 122 122 122 136 136 136
LNG Entrance Points and Capacities
(mcm/day)
İpsala
(Kipi FMS)
4,578
mSm3/day
Malkoçlar
10,6 + 2,6
mSm3/day
Export Exit Points (from transmission
system) and Capacities
26
Project Name Pipeline Length
Expected Gas Supply
Date
TANAP-Eskişehir Natural
Gas Line
30’’ x 32,3 km December 2017
Demirciler-Adapazarı-Düzce
Natural Gas Loop Line
20’’ x 148 km July 2019
Afyon-Seçköy Natural Gas
Pipeline
40’’ x 276 km December 2020
Other Natural Gas Pipeline Investments
27
Project Name
Additional
Capacity (MW)
Expected Operation
Date
CS HANAK Compressor
Station / Spare Unit
13,4 December 2017
CS DOĞUBEYAZIT
Compressor Station /
Spare Unit
10,5 July 2018
CS SİVAS Compressor
Station / Spare Unit
16 July 2018
CS SUNGURLU
Compressor Station /
Spare Unit
15,3 August 2019
Compressor Station Investments
Entrance Points 2017 2018 2019 2020 2021 2022 2023
MALKOÇLAR- Western Line 51,4 51,4 51,4 14,7 14,7 14,7 14,7
DURUSU- Blue Stream 48 48 48 48 48 48 48
GÜRBULAK- Iran 28,5 28,5 28,5 28,5 28,5 28,5 28,5
TÜRKGÖZÜ-Shahdeniz 19 19 19 19 19 19 19
ESKİŞEHİR-TANAP 0 5,7 11,3 14 16,4 16,4 16,4
TRAKYA-TANAP 0 0 0 0 8,2 8,2 8,2
KIYIKÖY-Turkish Stream 0 0 0 46,9 46,9 46,9 46,9
M. EREĞLİSİ LNG 22 37 37 37 37 37 37
ALİAĞA LNG 24,5 (39) 30,9 30,9 30,9 39 39 39
ALİAĞA FSRU 20 (20) 14,1 14,1 14,1 20 20 20
SAROS FSRU 0 20 20 20 20 20 20
DÖRTYOL FSRU 0 20 20 20 20 20 20
AKÇAKOCA-TP 0,36 0,36 0,36 0,36 0,36 0,36 0,36
GELİBOLU-MARSA 0,42 0,42 0,42 0,42 0,42 0,42 0,42
K. MARMARA – STORAGE 25 25 25 50 75 75 75
TUZGÖLÜ – STORAGE 13 20 20 30 80 80 80
TOPLAM 252,18 320,38 325,98 373,88 473,48 473,48 473,48
28
Entrance Points and Capacities
EMRA

EMRA

  • 1.
    Energy Market RegulatoryAuthority Board Member Milano, May 31, 2017
  • 2.
    • 2011 GDPincrease of 8.5%, making Turkey the world’s fastest growing economy after China (2015 +%6,1; 2016 +%2,9 even coup attempt) • Targeted to rank among the top 10 economies globally within the next decade Turkey: A Dynamic Emerging Economy
  • 3.
    Fazıl ŞENEL Yearly GNPIncrease of Turkey (%, 2005-2016)
  • 4.
    EMRA • The soleregulator of the Turkish electricity, natural gas, LPG and fuel and lubricants markets. • The architect of the liberalisation and regulation of the Turkish energy market.
  • 5.
    EMRA • An independentpublic entity with administrative and financial autonomy established in 2001. • Functions: – Issue regulations – License market participants – Approve tariffs – Monitor, supervise and audit markets and market players • Governed by a 7-member board • $100 million annual budget drawn from licensing revenues • Budget is independent of any other governmental institution
  • 6.
    Turkey Natural GasConsumption and Production (2002-2016) Source: MNER 2017 Year Consumption (bcm) 2002 17,065 2003 21,384 2004 22,505 2005 27,467 2006 31,128 2007 34,600 2008 36,100 2009 34,400 2010 36,900 2011 43,800 2012 45,242 2013 45,270 2014 48,717 2015 47,999 2016 46,146 Average Yearly Consumption Increase: 7,83 % 0 5 10 15 20 25 30 35 40 45 50 2002 2003 2004 2005 2006 2007 2008 2009 2010 2011 2012 2013 2014 2015 2016 Natural Gas Consumpion and Production (bcm) Consumption Production
  • 7.
    Turkey Natural GasImports (2002-2016, mcm) Source: MNER 2017
  • 8.
    Turkey Natural GasImports (2002-2016, %) Source: MNER 2017 53,55 % 16,7% 14,0% 9,1% 2,4% 4,3% Russia Iran Azerbaijan Algeria (LNG) Nigeria (LNG) Spot LNG
  • 9.
    Natural Gas Consumptionby Sectors (2013-2016, mcm)
  • 10.
    Natural Gas Consumptionby Sectors (2016, %)
  • 11.
    Fazıl ŞENEL Regulatory StepsTaken For Natural Gas Sector - The main legislation of the natural gas market is the Natural Gas Market Law No.4646, enacted with the objective of liberalising the natural gas market. - The dominant gas market player, State-owned company BOTAS, is required by such law to reduce its market share in the import, wholesale and distribution fields. In the following years, BOTAS’s import contracts has been transferred gradually to other market players through tenders. - After the Law, however, the current market share of BOTAS with regard to imports still represents a high percent of the natural gas import market, but BOTAS’s market dominance continuosly decreases in recent years.
  • 12.
    Natural Gas MarketStructure After 2001:“Liberalisation”
  • 13.
    10th Anniversary Natural GasDistribution Regions Cities tendered and gasified (78 cities) Cities tendered (3 cities) KIRKLARELİ 2006 İSTANBUL 1989 KOCAELİ 1989YALOVA 1989 BURSA 1996 BİLECİK 2003 ESKİŞEHİR 1995 SAKARYA 2002 BOLU 2008 KARABÜK 2008 ANKARA 1988 KONYA 2003 KIRIKKALE 2003 AKSARAY 2003 KIRŞEHİR 2003 NEVŞEHİR 2008 NİĞDE 2003 ADANA 2005 HATAY 2011 KİLİS 2012 GAZİANTEP 2005 DÜZCE 1996 BARTIN 2009 KASTAMONU 2007 SİNOP 2016 ÇANKIRI 2007 ÇORUM 2003 SAMSUN 2003 AMASYA 2008 ZONGULDAK 2009 TOKAT 2008 SİVAS 2003 YOZGAT 2004 OSMANİYE 2005 MALATYA 2005 ADIYAMAN 2006 DİYARBAKIR 2007 ŞANLIURFA 2007 İÇEL 2005 KAHRAMANMARAŞ 2005 ELAZIĞ 2007 MUŞ 2016 TUNCELİ 2016 BİNGÖL 2016 BATMAN 2011 SİİRT 2011 ŞIRNAK 2017 HAKKARİ 2018 VAN 2007 ERZİNCAN 2008 ERZURUM 2003 KARS 2006 AĞRI 2016 IĞDIR 2009 ARDAHAN 2006 ARTVİN 2018RİZE 2008 BAYBURT 2006 TRABZON 2008 GÜMÜŞHANE 2008 GİRESUN 2010 ORDU 2007 KAYSERİ 2003 BİTLİS 2016 MARDİN 2016 KARAMAN 2003ANTALYA 2005 BURDUR 2005 ISPARTA 2005 AFYON 2005UŞAK 2003 DENİZLİ 2005 MUĞLA 2011 AYDIN 2007 EDİRNE 2007 TEKİRDAĞ 2007 ÇANAKKALE 1996 BALIKESİR 2003 MANİSA 2003İZMİR 2003 KÜTAHYA 2003 In 2016, 479 km of natural gas pipelines have been constructed and the total length of our natural gas pipelines has reached 13.443 km.
  • 14.
    10th Anniversary Province, Districtand OIZ-Based Investments PIPELINE INVESTMENTS (Expected) 2017 2018 2019 Province(s) 1 2 - District(s) 110 80 30 OIZ(s) 4 8 1 Pipeline Completed Not Yet Gasified Province(s) 78 3 District(s) 336 583 Organised Industrial Zone(s) (OIZ) 137 174
  • 15.
    Fazıl ŞENEL REGULATORY STEPSTAKEN (Cont’d) - Since natural gas is heavily consumed by power generation, district heating and industrial purposes in Turkey, natural gas storage capability turns out to be crucial for the security of supply in recent years in Turkey and after the Law, some steps are taken in order to increase storage capacity. Stored Natural Gas (bcm) as of 11/2016 BOTAS Inc. 2,32 Private Sector 0,29 TOTAL 2,61
  • 16.
    K. Marmara-Değirmenköy 16 mSm3/day Tuzgölü 15mSm3/day Storage Exit Points and Capacities
  • 17.
    17 2017 2018 20192020 2021 2022 2023 K. MARMARA- DEĞİRMENKÖY Storage (bcm) 2,84 2,84 2,84 2,84 3,34 3,84 4,6 Injection Capacity (mcm/day) 16 16 16 45 45 45 45 TUZGÖLÜ Storage (bcm) 0,25 0,55 0,55 0,85 2,2 3,4 5,4 Injection Capacity (mcm/day) 15 30 30 30 60 60 60 TOTAL STORAGE CAPACITY Storage (bcm) 3,09 3,39 3,39 3,69 5,54 7,24 10 Injection Capacity (mcm/day) 31 46 46 75 105 105 105 Storage Exit Points and Capacities
  • 18.
    MARSA Gelibolu 0,43 mSm3/day K.Marmara Storage 20 (50-75) mSm3/gün Değirmenköy Storage 5Sm3/day Tuzgölü Storage 20 (40) mSm3/day TP Akçakoca 0,36 mSm3/gün Storage and Production Entrance Points (to transmission system) and Capacities
  • 19.
    19 2017 2018 20192020 2021 2022 2023 K. MARMARA- DEĞİRMENKÖY Storage (bcm) 2,84 2,84 2,84 2,84 3,34 3,84 4,6 Send-out Capacity (mcm/day) 25 25 25 50 75 75 75 TUZGÖLÜ Storage (bcm) 0,25 0,55 0,55 0,85 2,2 3,4 5,4 Send-Out Capacity (mcm/day) 13 20 20 30 60 60 60 TOTAL Storage (bcm) 3,09 3,39 3,39 3,69 5,54 7,24 10 Send-out Capacity (mcm/day) 38 45 45 80 135 135 135 Storage Entrance Points (to transmission system) and Capacities
  • 20.
    Trans-Caspian Trans-Iranian– Turkmen Gas via ArabGas P/L Egyptian Gas Iraqi Gas (ITGEP) Shah Deniz BTE Nabucco ITGI Arab Gas P/L Phase-III Blue Stream-I Blue Stream-II [Medstream] West Line Trans-Caspian Kazakh Gas ITG Iranian Gas South Pars Map: Google Map TAP Iraqi Gas (South) Iraqi Gas (Akkas) Medstream West-Balkan Corridor (IAP) Iraq-Turkey Oil Pipeline BTC Samsun Ceyhan Turkish Stream TANAP A Modern Day Silk Road
  • 21.
    Malkoçlar FMS WESTERN LINE 51,4mSm3/day 45,1 mSm3/day Gürbulak (Bazargan FMS) Iran-Turkey 28,6 mSm3/gün Türkgözü FMS Baku-Tbilisi- Erzurum (BTE) 19,1 mSm3/day Durusu FMS BLUE STREAM 47,3 mSm3/day Kıyıköy FMS TURKISH STREAM 47 mSm3/day Eskişehir FMS TANAP 16,4 mSm3/day Trakya FMS TANAP 8,2 mSm3/day PIPELINE ENTRANCE POINTS (i.e. for export) and CAPACITIES
  • 22.
    22 ENTRANCE POINTS 20172018 2019 2020 2021 2022 2023 MALKOÇLAR- Western Line 51,4 51,4 51,4 14,7 14,7 14,7 14,7 DURUSU- Blue Stream 48 48 48 48 48 48 48 GÜRBULAK- Iran-Turkey 28,5 28,5 28,5 28,5 28,5 28,5 28,5 TÜRKGÖZÜ-Shahdeniz 19 19 19 19 19 19 19 ESKİŞEHİR-TANAP 0 5,7 11,3 14 16,4 16,4 16,4 TRAKYA-TANAP 0 0 0 0 8,2 8,2 8,2 KIYIKÖY-Turkish Stream 0 0 0 46,9 46,9 46,9 46,9 TOTAL 146,9 152,6 158,2 171,1 181,7 181,7 181,7 PIPELINE ENTRANCE POINTS (for export) and CAPACITIES
  • 23.
    M. Ereğlisi LNG 22(27-37) mSm3/day Aliağa LNG 24,5 (30-39) mSm3/day Aliağa FSRU 20 mSm3/day Dörtyol FSRU 20 Sm3/day Saros FSRU 20 Sm3/day LNG Terminal Entrance Points and Capacities
  • 24.
    24 ENTRANCE POINTS 20172018 2019 2020 2021 2022 2023 M. EREĞLİSİ LNG 22 37 37 37 37 37 37 ALİAĞA LNG 24,5 (39) 30,9 30,9 30,9 39 39 39 ALİAĞA FSRU 20 (20) 14,1 14,1 14,1 20 20 20 SAROS FSRU* 0 20 20 20 20 20 20 DÖRTYOL FSRU* 0 20 20 20 20 20 20 TOTAL 66,5 122 122 122 136 136 136 LNG Entrance Points and Capacities (mcm/day)
  • 25.
    İpsala (Kipi FMS) 4,578 mSm3/day Malkoçlar 10,6 +2,6 mSm3/day Export Exit Points (from transmission system) and Capacities
  • 26.
    26 Project Name PipelineLength Expected Gas Supply Date TANAP-Eskişehir Natural Gas Line 30’’ x 32,3 km December 2017 Demirciler-Adapazarı-Düzce Natural Gas Loop Line 20’’ x 148 km July 2019 Afyon-Seçköy Natural Gas Pipeline 40’’ x 276 km December 2020 Other Natural Gas Pipeline Investments
  • 27.
    27 Project Name Additional Capacity (MW) ExpectedOperation Date CS HANAK Compressor Station / Spare Unit 13,4 December 2017 CS DOĞUBEYAZIT Compressor Station / Spare Unit 10,5 July 2018 CS SİVAS Compressor Station / Spare Unit 16 July 2018 CS SUNGURLU Compressor Station / Spare Unit 15,3 August 2019 Compressor Station Investments
  • 28.
    Entrance Points 20172018 2019 2020 2021 2022 2023 MALKOÇLAR- Western Line 51,4 51,4 51,4 14,7 14,7 14,7 14,7 DURUSU- Blue Stream 48 48 48 48 48 48 48 GÜRBULAK- Iran 28,5 28,5 28,5 28,5 28,5 28,5 28,5 TÜRKGÖZÜ-Shahdeniz 19 19 19 19 19 19 19 ESKİŞEHİR-TANAP 0 5,7 11,3 14 16,4 16,4 16,4 TRAKYA-TANAP 0 0 0 0 8,2 8,2 8,2 KIYIKÖY-Turkish Stream 0 0 0 46,9 46,9 46,9 46,9 M. EREĞLİSİ LNG 22 37 37 37 37 37 37 ALİAĞA LNG 24,5 (39) 30,9 30,9 30,9 39 39 39 ALİAĞA FSRU 20 (20) 14,1 14,1 14,1 20 20 20 SAROS FSRU 0 20 20 20 20 20 20 DÖRTYOL FSRU 0 20 20 20 20 20 20 AKÇAKOCA-TP 0,36 0,36 0,36 0,36 0,36 0,36 0,36 GELİBOLU-MARSA 0,42 0,42 0,42 0,42 0,42 0,42 0,42 K. MARMARA – STORAGE 25 25 25 50 75 75 75 TUZGÖLÜ – STORAGE 13 20 20 30 80 80 80 TOPLAM 252,18 320,38 325,98 373,88 473,48 473,48 473,48 28 Entrance Points and Capacities