Lesson 8 measure of variation
•Download as PPTX, PDF•
1 like•125 views

Lesson in Statistics and Probability Grade 11

Recommended
More Related Content
What's hot
What's hot (20)
Similar to Lesson 8 measure of variation
Similar to Lesson 8 measure of variation (20)
More from Maris Ganace
More from Maris Ganace (11)
Recently uploaded
Recently uploaded (20)
Lesson 8 measure of variation
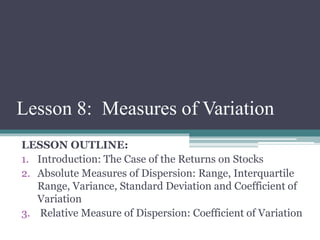
- 1. Lesson 8: Measures of Variation LESSON OUTLINE: 1. Introduction: The Case of the Returns on Stocks 2. Absolute Measures of Dispersion: Range, Interquartile Range, Variance, Standard Deviation and Coefficient of Variation 3. Relative Measure of Dispersion: Coefficient of Variation
- 2. LEARNING OUTCOME(S): At the end of the lesson, the learner is able to: • Calculate some measures of dispersion; • Think of the strengths and limitations of these measures; and • Provide a sound interpretation of these measures.
- 3. A. Introduction: The Case of the Returns on Stocks. Stocks -are shares of ownership in a company. When people buy stocks they become part owners of the company, whether in terms of profits or losses of the company. -the history of performance of a particular stock maybe a useful guide to what may be expected of its performance in the foreseeable future. This is of course, a very big assumption, but we have to assume it anyway.
- 4. The following data representing the rates of return for two stocks, which we will call Stock A and Stock B.
- 5. Rate of Return -is defined as the increase in value of the portfolio (including any dividends or other distributions) during the year divided by its value at the beginning of the year. Example If the parents of Juana dela Cruz invests 50,000 pesos in a stock at the beginning of the year, and the value of the stock goes up to 60,000 pesos, thus having an increase in value of 10,000 pesos, then the rate of return here is 10,000/50,000 = 0.20
- 6. Let us compute some measures of locations that we learned in previous lessons to describe the data given above
- 7. Two types of measures of variability or dispersion 1.Absolute measure of dispersion -provides a measure of variability of observations or values within a data set. Includes the range, interquartile range, variance, and standard deviation. 2. relative measure of dispersion -which is the other type of measure of dispersion is used to compare variability of data sets of different variables or variables measured in different units of measurement.
- 8. B. Absolute Measures of Dispersion: Range, Interquartile Range, Variance, and Standard Deviation Range -is a simple measure of variation defined as the difference between the maximum and minimum values. The range depends on the extremes; it ignores information about what goes in between the smallest (minimum) and largest (maximum) values in a data set. The larger the range, the larger is the dispersion of the data set.
- 10. Interquartile range or IQR -is the difference between the 3rd and the 1st quartiles. Hence, it gives you the spread of the middle 50% of the data set. Like the range, the higher the value of the IQR, the larger is the dispersion of the data set. Based on the computations we did in the previous lesson, the 3rd quartile or Q3 is the 113th observation and is equal to 38 while Q1 or P25 is the 38th observation and is equal to 25. Hence, IQR = 38 – 25 = 13.
- 11. Variance -is a measure of dispersion that accounts for the average squared deviation of each observation from the mean. Since we square the difference of each observation from the mean, the unit of measurement of the variance is the square of the unit used in measuring each observation. -we usually denoted this expression as Standard Deviation -is computed which is the positive square of the variance
- 12. C. Relative Measure of Dispersion: Coefficient of Variation Coefficient of variation (CV) -is used as measure of relative dispersion. It is usually expressed as percentage and is computed as CV = ×100%. CV is a measure of dispersion relative to the mean of the data set. With and having same unit of measurement, CV is unit less or it does not depend on the unit of measurement. Hence, it is used compare the variability across the different data sets.