An evaluation of methods used to sequence pGEM template within core facilities dsrg study
•
1 like•72 views

A horizontal study by ABRF designed to investigate & collate cycle sequencing methods for the pGEM template and subsequent data output on automated sequencing platforms (cf. AB 3700 & AB 3100)
Recommended

Recommended
More Related Content
What's hot
What's hot (20)
Similar to An evaluation of methods used to sequence pGEM template within core facilities dsrg study
Similar to An evaluation of methods used to sequence pGEM template within core facilities dsrg study (20)
More from Laurence Dawkins-Hall
More from Laurence Dawkins-Hall (20)
Recently uploaded
Recently uploaded (20)
An evaluation of methods used to sequence pGEM template within core facilities dsrg study
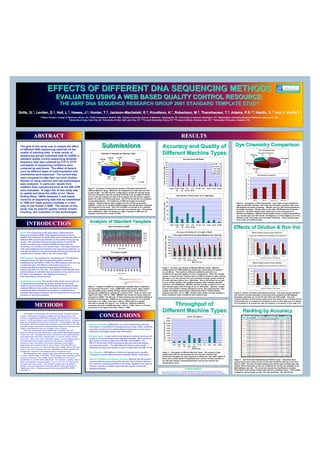
- 1. EFFECTS OF DIFFERENT DNA SEQUENCING METHODS EVALUATED USING A WEB BASED QUALITY CONTROL RESOURCE: THE ABRF DNA SEQUENCE RESEARCH GROUP 2001 STANDARD TEMPLATE STUDY Grills, G.1, Leviten, D.2, Hall, L.3, Hawes, J.4, Hunter, T.5, Jackson-Machelski, E.6, Knudtson, K.7, Robertson, M.8, Thannhauser, T.9, Adams, P.S.10, Hardin, S.11 and J. VanEe12. 1,3Albert Einstein College of Medicine, Bronx, NY; 3ICOS Corporation, Bothell, WA; 4Indiana University School of Medicine, Indianapolis, IN; 5University of Vermont, Burlington, VT; 6Washington University School of Medicine, Saint Louis, MO; 7University of Iowa, Iowa City, IA; 8University of Utah, Salt Lake City, UT; 9,12Cornell University, Ithaca, NY; 10Trudeau Institute, Saranac Lake, NY; 11University of Houston, Houston, TX. EFFECTS OF DIFFERENT DNA SEQUENCING METHODSEFFECTS OF DIFFERENT DNA SEQUENCING METHODS EVALUATED USING A WEB BASED QUALITY CONTROL RESOURCE:EVALUATED USING A WEB BASED QUALITY CONTROL RESOURCE: THE ABRF DNA SEQUENCE RESEARCH GROUP 2001 STANDARD TEMPLATE STUDYTHE ABRF DNA SEQUENCE RESEARCH GROUP 2001 STANDARD TEMPLATE STUDY Grills, G.Grills, G.11, Leviten, D., Leviten, D.22, Hall, L., Hall, L.33, Hawes, J., Hawes, J.44, Hunter, T., Hunter, T.55, Jackson-Machelski, E., Jackson-Machelski, E.66, Knudtson, K., Knudtson, K.77, Robertson, M., Robertson, M.88, Thannhauser, T., Thannhauser, T.99, Adams, P.S., Adams, P.S.1010, Hardin, S., Hardin, S.1111 and J. VanEeand J. VanEe1212.. 1,3Albert Einstein College of Medicine, Bronx, NY; 3ICOS Corporation, Bothell, WA; 4Indiana University School of Medicine, Indianapolis, IN; 5University of Vermont, Burlington, VT; 6Washington University School of Medicine, Saint Louis, MO; 7University of Iowa, Iowa City, IA; 8University of Utah, Salt Lake City, UT; 9,12Cornell University, Ithaca, NY; 10Trudeau Institute, Saranac Lake, NY; 11University of Houston, Houston, TX. Goals:Goals: The overall goal of the Association of Biomolecular Resource Facilities (ABRF) DNA Sequence Research Group (DSRG) 2001 Standard Template Study was to analyze the effect of different DNA sequencing methods on the quality of sequencing results. We requested sequencing laboratories to submit the results of sequencing a standard pGEM template with any chemistry, run condition and machine type. The study examined both well established and relatively new sequencing methods. To evaluate the effects of new technologies, this study examined data collected from January 1998 to the end of April 2001. NES Database:NES Database: This analysis is a continuation of "The Standard Template Study: The Never Ending Story (NES)" that was established by the DSRG in 1998. The NES database web site was created last year. The NES is a web based resource of sequencing data that permits anonymous submission of sequencing data over the web. The database automatically does phred analysis of submitted data and allows on line queries of all the data in the database. The database is located at http://nes.biotech.cornell.edu/nes. Applications of results:Applications of results: The results of this study may be used to: (1) anonymously evaluate the quality of sequencing results relative to that achieved in other laboratories; (2) systematically evaluate different instruments, chemistries and protocols when considering either equipment purchases or modifications to standard operating procedures; and (3) determine the causes and solutions to technical problems. The goal of this study was to analyze the effect of different DNA sequencing methods on the quality of resulting data. A wide variety of sequencing groups submitted data for pGEM, a standard quality control sequencing template. Sequence data was collected by FTP or HTTP and details of sequencing conditions were collected by web forms. The effect of factors such as different types of instrumentation and chemistries were examined. The current data were compared to data from our prior studies. Results of using common and new technologies were analyzed. In particular, results from capillary array sequencers such as the ABI 3700 were evaluated. A major aim of this study was to update and show the utility of our “Never Ending Story” (NES) database, a web based resource of sequencing data that we established in 1998 and made publicly available in a new easy to use format in 2000. The results of this study may be used for quality control, trouble shooting, and evaluation of new technologies. DNA Sequencing Research GroupDNA Sequencing Research Group ABSTRACTABSTRACT INTRODUCTIONINTRODUCTION RESULTSRESULTS Analysis of Standard TemplateAnalysis of Standard Template Figure 2. Analysis of pGEM as a Sequencing Template: Base Composition and Secondary Structure. (Top) pGEM-3Zf(+) base content. Base content was calculated using a sliding, 20-base window starting at the M13(-21) priming site. pGEM has an average GC content of 54%. There is a 55% T-rich region from base +1070 to +1080. (Middle) Free energy ΔG values along the sequence of pGEM. The value for 10 base windows was calculated starting at the M13(-21) priming site. pGEM has an average ΔG value of –2.7 kcal/mole from base +1 to +1040. From base +1040 to +1080, there is a marked decrease in average ΔG value to –15.1 kcal/mole. (Bottom) Inhibitory secondary structure of pGEM from base +1040 to +1080. There is a 32 base palindrome In the region from base +1040 to +1080,. 0 10 20 30 40 50 60 70 80 90 100 PercentofTotal (per20bases) 20 100 180 260 340 420 500 580 660 740 820 900 980 1060 Base Number Base Composition of pGEM T A C G -18.0 -16.0 -14.0 -12.0 -10.0 -8.0 -6.0 -4.0 -2.0 0.0 2.0 Gvalue(kcal/mole) 20 100 180 260 340 420 500 580 660 740 820 900 980 1060 Base Number ΔG Analysis of pGEM 1030 5’TCTTGATCCGGCAAACAAACCACCGCTG ||| ||||||||||| G 3’ GTTTGTTTTTTTGGTGGCGAT / 1080 Participation in this study was solicited through electronic bulletin boards. Participants submitted unedited chromatogram files of the results of sequencing pGEM-3Zf(+) template with the M13(-21) forward primer. LICOR participants used the M13(-40) forward primer. Sequence data was submitted anonymously via the web. Chromatogram files and information about the sequencing conditions were collected on the NES web site at http://nes.biotech.cornell.edu/nes. Data from instrument and reagent manufacturers was not included in this analysis. The base composition of the pGEM-3Zf(+) template from the M13(-21) priming site was determined using SeqEd (Applied Biosystems, Foster City, CA). Potential secondary structures of the pGEM template were determined with eOST software (Mei, G. and S.H. Hardin, Nucleic Acids Res., 28(7), E22), which identifies regions of self-complementarity and determines free energy values for such regions. Submitted sequences were compared to the known sequence using SeqEd. Alignments were trimmed at the 5' end to base +1 from the M13(-21) priming site. A script (Li Li, Albert Einstein Coll. of Med., Bronx, NY) was used to count the numbers of errors. Substitutions (both miscalls and ambiguities), insertions and deletions were considered errors. Chromatograms were analyzed with phred software (Ewing, B. and P. Green, Genome Res., 8,186-194). Phred assigns base calls and quality values to each peak. The quality values correspond to the inverse probability of a correct base assignment. For example, a quality value of Q=20 corresponds to approximately 1 error in 102, or a 1% chance that the base call is not correct. The number of base calls with specific quality values was determined with qrep (Brent Ewing, University of Washington, WA). Statistical analysis was done with SPSS (SPSS, Chicago, IL). METHODSMETHODS CONCLUSIONSCONCLUSIONS Throughput ofThroughput of Different Machine TypesDifferent Machine Types Figure 4. Throughput of Different Machine Types. The number of high quality bases that can be produced per hour by each machine type. Instrument throughput for each sequence is defined as: (the total number of bases with a phred quality of Q≥20)(maximum number of lanes possible to run with that machine configuration)/(lanes used by the machine per sequence)(run time). Hourly Throughput 0 2,000 4,000 6,000 8,000 10,000 12,000 14,000 16,000 18,000 20,000 373A 373S- 36 373S- 48 377- 36-4X 377- 36-2X 377-48 310 3100 3700 LICOR Machine Type #bases/hrwithQ>=20(mean±SEM) Dye Chemistry ComparisonDye Chemistry Comparison Figure 5. Comparison of Dye Chemistries. (Top) Types of dye chemistries used by submitted samples. 98% used dye terminator chemistry. 68% used ABI BigDyes terminator chemistry. dRhods refers to ABI Dichlororhodamine terminator chemistry. Rhods refers to the older ABI Rhodamine terminator chemistry. All Rhod samples were created prior to the introduction of dRhods and BigDyes. (Bottom) Phred quality results of sequencing pGEM on one machine type, the ABI 377-48, with BigDyes v1 (n=83), BigDyes v2 (n=18), dRhods (n=19), and rhods (n=9) terminator chemistry. These samples came from a total of 34 different labs. Dye Chemistries Used ABI BigDyes v1 44% ABI BigDyes v2 24% ABI dRhods 9% ABI Rhods 16% DyePrimer 2% Amersham ET 5% Dye Chemistry Comparison 450 500 550 600 650 700 750 Rhods dRhods BigDyes-v1 BigDyes-v2 NumberofBaseswithQ>=20(Mean±SEM) Accuracy and Quality ofAccuracy and Quality of Different Machine TypesDifferent Machine Types Figure 3. Accuracy and Quality of Different Machine Types. Machine configurations are differentiated by model type, well-to-read and speed of run conditions. The results for different chemistries and other run conditions are grouped together for each configuration. (Top) The average number of errors for each machine type for different length of reads, starting with base +1 to +40, and then the non-cumulative average number of errors for every 200 base interval up to +840 bases. Errors are defined as any type of error in base calling in the unedited sequence data, including miscalls, insertions, and ambiguities. (Middle) The total average number of errors for each machine type in the full range of +41 to +840 bases. (Bottom) Length of read: total number of bases detected by phred. Accurate basecalls: total number of unedited correct bases called by the ABI or LICOR analysis software from base +41 to +1600. Quality: total number of bases assigned a phred confidence value of Q≥20 for each machine type. Accuracy Every 200 Bases 0 20 40 60 80 100 120 140 160 180 200 373A 373S- 36 373S- 48 377- 36-4X 377- 36-2X 377-48 310 3100 3700 LICOR Machine Type NumberofErrors(Mean±SEM) 1-40 41-241 241-441 441-641 641-841 Total Number of Errors from +41 to +840 Bases 0 50 100 150 200 250 300 373A 373S- 36 373S- 48 377- 36-4X 377- 36-2X 377-48 310 3100 3700 LICOR Machine Type NumberofErrors(Mean±SEM) Accuracy and Quality for Full Length of Read 0 200 400 600 800 1000 1200 1400 373A 373S- 36 373S- 48 377- 36-4X 377- 36-2X 377-48 310 3100 3700 LICOR Machine Type NumberofBases(Mean±SEM) Total Length of Read Accurate Basecalls Bases with Quality>20 Effects of Dilution & Rxn Vol.Effects of Dilution & Rxn Vol. Figure 6. Effects of Dilution and Reaction Volume. The most common dilutions and reaction volumes submitted to this study were analyzed for ABI BigDyes terminator chemistry run on the 377-48 (n=81) and 3700 (n=68). The most common dilutions of this enzyme premix were: full volume (8 µl of enzyme premix in 20 µl total rxn), 1/2 volume (4 µl of premix in 20 µl or 10 µl total rxn), 1/4 volume (2 µl of premix in 10 µl total rxn), and 1/8 volume (1 µl of premix in 10 µl total rxn). Effects of Dilution and Rxn Volume: ABI 377-48 400 500 600 700 800 900 1000 1100 1200 1300 2 in 10 ul 4 in 10 ul 4 in 20 ul 8 in 20 ul Amount of Premix in Total Volume NumberofBases(Mean+SEM) Total Length of Read Accurate Basecalls Bases with Quality Q>20 Effects of Dilution and Rxn Volume: ABI 3700 400 500 600 700 800 900 1000 1 in 5 ul 2 in 10 ul 3 in 10 ul 4 in 20 ul Amount of Premix in Total Volume NumberofBases(Mean+SEM) Total Length of Read Accurate Basecalls Bases with Quality Q>20 Ranking by AccuracyRanking by Accuracy Figure 7. Top Three Lab Submissions per Machine Type. Sequences were ranked first by the number of errors from base 41-840 and then by errors from base 41-1640. The most accurate sequence per lab for each machine type was ranked. More information on the run conditions for all files are available on the NES database web site. File names are anonymous identification numbers. Phred Q≥20: total number of base calls with this confidence value. LCR: longest continuous correct length of read. DT: Dye terminator. DP: Dye Primer. ERRORS CONDITIONS TYPE FILE NAME PHRED Q>20 LCR 1- 40 41- 241 241- 441 441- 641 641- 841 41- 841 841- 1041 41- 1640 CHEM DYE ENZYME 5677XA 887 965 2 0 0 0 0 0 2 229 DT BigDyes ABI TaqFS 377-48 0309BD 839 951 2 0 0 0 0 0 5 486 DT BigDyes v2 ABI TaqFS 8650C 849 937 7 0 0 0 0 0 2 512 DT BigDyes v2 ABI TaqFS 5677TNE 601 710 17 0 0 0 7 7 89 696 DT BigDyes v1 ABI TaqFS 377-36-2X 4844BNE_2 576 711 14 0 0 0 10 10 189 799 DT BigDyes v1 ABI TaqFS 2401ACI 564 537 11 0 0 1 11 12 44 648 DT BigDyes v2 ABI TaqFS 1942RNE 636 668 5 0 0 0 14 14 156 770 DT dRhods ABI TaqFS 377-36-4X 7076HNE 549 611 0 0 0 3 45 48 179 827 DT BigDyes v1 ABI TaqFS 1185BNE 434 490 8 1 0 5 41 47 200 847 DT Amersham Amersham TS 1 0607ADA 774 787 4 0 0 0 1 1 90 691 DT BigDyes v2 ABI TaqFS 3700 5677FG 657 799 15 0 0 0 2 2 174 776 DT BigDyes v2 ABI TaqFS 0044CBS 687 701 1 0 0 0 4 4 200 804 DT BigDyes v1 ABI TaqFS 3100N 700 804 2 1 0 0 0 1 113 714 DT BigDyes v2 ABI TaqFS 3100 8556CSD 679 717 2 1 0 0 3 4 144 748 DT BigDyes v2 ABI TaqFS 3807DLB 664 695 17 3 0 0 4 7 177 784 DT BigDyes v2 ABI TaqFS 3372ANE 459 395 6 2 0 13 44 59 200 859 DT Amersham Amersham TS 1 310 1076E 341 325 6 0 7 52 169 228 200 1028 DT BigDyes v1 ABI TaqFS 1277ANE 314 270 4 2 3 119 200 324 200 1124 DT Rhods ABI TaqFS 9923D 704 806 9 0 0 0 0 0 158 758 DT BigDyes v1 ABI TaqFS 373S-48 6736B 706 688 0 0 0 0 5 5 96 701 DT BigDyes v2 ABI TaqFS 1205ANE 659 749 5 0 0 0 5 5 175 780 DT BigDyes v1 ABI TaqFS 7249FSNE 515 804 0 0 0 0 13 13 200 813 DT Rhods ABI TaqFS 373S-36 3189ONE 524 622 3 0 0 2 20 22 100 722 DT BigDyes v1 ABI TaqFS 2759A 538 543 0 0 0 5 17 22 64 579 DT Amersham ET Amersham TS 2 5677ENE 316 310 12 0 2 23 81 106 116 822 DT Rhods ABI TaqFS 373A 5546E 424 486 0 0 0 25 108 133 200 933 DT BigDyes v1 ABI TaqFS 2001A 391 431 17 0 0 30 119 149 200 949 DT dRhods ABI TaqFS 5949ANE 1096 942 15 0 0 0 0 0 1 431 DP NIR 800 TS RPN2438 LI-COR 3708A 464 700 26 0 0 0 3 3 65 668 DP LI-COR Amersham TS 2 8028A 524 327 25 2 0 8 9 19 19 570 DP LI-COR SequiTherm SubmissionsSubmissions Figure 1. Summary of Submissions: Number of Samples Submitted for Different Machine Types. Machines are designated by model type and well- to-read length. The ABI machine configurations include the slab-gel based 373A, the 373-stretch with 36 cm plates (373S-36) or 48 cm plates (373S-48), the 377 with 36 cm plates (377-36) or 48 cm plates (377-48) and the capillary based 310, 3100, and 3700 instruments. The 377-36 4X and 2X run conditions are grouped together. 310 capillaries of different lengths are grouped together. Different well-to-read conditions for the LI-COR are grouped together. A total of 474 unedited pGEM samples from 96 labs were submitted and analyzed for this study. Each lab submitted an average of 5±1 samples. 33% of labs submitted samples for more than one machine type. 210 samples were submitted in 1998, 116 samples in 1999, 5 samples in 2000 and 143 samples in the first four months of 2001. Number of Samples per Machine Type 377-36 27% 377-48 28% 3100 4% 3700 17% 373A 7% 373S-36 7% 373S-48 8% LI-COR 1% 310 1% n = 474n = 474 Standard Template:Standard Template: pGEM-3Zf(+) is an ideal sequencing substrate from base +1 of the M13(-21) priming site up to base +1040. Inhibitory secondary structure may substantially decrease the success rate of obtaining read lengths longer than 1040 bases. Machine Types:Machine Types: Longer well-to-read distance improves accuracy and quality on all machine types with standard template. Most machines give similar accuracy at less than 400 base read lengths. The ABI 377-48 and the LICOR instruments give the best read lengths, accuracy and quality . The ABI 3700 and 3100 can give overall sequence accuracy and quality as good or better than the ABI 377-36. Dye Chemistry:Dye Chemistry: ABI BigDyes v2 show an improvement in quality compared to results with previously available ABI dye chemistries. Effects of Dilutions and Reaction Volumes:Effects of Dilutions and Reaction Volumes: BigDyes dye terminators maintain both accuracy and quality with the most common dilutions and reaction volumes submitted to this study. BigDyes with reduced reaction volumes or dilutions gave the best results overall with standard template. Invaluable assistance provided by:Invaluable assistance provided by: Li Li, Elsa Boschen, Nguyen Tran, Dominga Arias (Albert Einstein College of Medicine); Gangwu Mei (University of Houston); Tom Stelick, Tatyana Pyntikova, Jennifer Griswold and Bill Enslow (Cornell University); Steve Goff, Maureen Milnamow, Alan Morgan (Novartis); James Bonfield (MRC-LMB); and Brent Ewing (University of Washington). ACKNOWLEDGMENTSACKNOWLEDGMENTS