Lab talk 020710 comparing bac r_rel 1 with e coli rrel 1 for use in fret assay
•Download as PPT, PDF•
0 likes•71 views

Comparing activity of baculovirus and E Coli expressed rREL 1 fractions in context of HT FRET assay for screening compound libraries to identify REL1 antagonist hits
![ Achim established some basic parameters, i.e.Achim established some basic parameters, i.e.
a) Optimal combination of fluorophores with Ref. to REL 1
b) Optimal Fluorophore concentrations
c) Optimal ratios of Fluorophores with bridge
d) Efficacy of Baculovirus REL 1 with respect to above set up
My contribution thus far:My contribution thus far:
e) Compared activities of E Coli expressed R1-A2 with aforementioned Bac
prep
f) Looked at potential stabilising effect of 0.1 % Triton X-100
g) Investigated sensitivity of E Coli R1-A2 (in context of assay) to various
conc. of DMSO
h) Looked at effect of Ligation time on signal magnitude
i) Currently investigating [ATP] on signal output](data:image/gif;base64,R0lGODlhAQABAIAAAAAAAP///yH5BAEAAAAALAAAAAABAAEAAAIBRAA7)
Recommended
Recommended
More Related Content
Similar to Lab talk 020710 comparing bac r_rel 1 with e coli rrel 1 for use in fret assay
Similar to Lab talk 020710 comparing bac r_rel 1 with e coli rrel 1 for use in fret assay (20)
More from Laurence Dawkins-Hall
More from Laurence Dawkins-Hall (20)
Recently uploaded
Recently uploaded (20)
Lab talk 020710 comparing bac r_rel 1 with e coli rrel 1 for use in fret assay
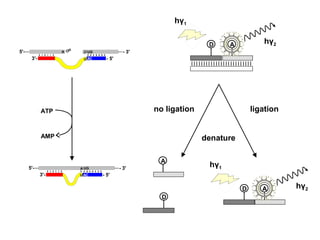
- 1. 5'- 3'- ... ...- 3' - 5' OH p UG AC A U 5'- 3'- ... ...- 3' - 5' A UG ACU ATP AMP | | | | | | | | | | | | | | | | | | | | | | | | | D A hγ2 hγ1 denature no ligation ligation D A D A hγ2 hγ1
- 2. Achim established some basic parameters, i.e.Achim established some basic parameters, i.e. a) Optimal combination of fluorophores with Ref. to REL 1 b) Optimal Fluorophore concentrations c) Optimal ratios of Fluorophores with bridge d) Efficacy of Baculovirus REL 1 with respect to above set up My contribution thus far:My contribution thus far: e) Compared activities of E Coli expressed R1-A2 with aforementioned Bac prep f) Looked at potential stabilising effect of 0.1 % Triton X-100 g) Investigated sensitivity of E Coli R1-A2 (in context of assay) to various conc. of DMSO h) Looked at effect of Ligation time on signal magnitude i) Currently investigating [ATP] on signal output
- 4. not denatured 26565 40518 28776 34868 0 5000 10000 15000 20000 25000 30000 35000 40000 45000 - BacTbREL1 + BacTbREL1 AFU 5'#2 / 3'#1 5'#2 / 3'#2 F) BacTbREL1: FRET 3’ #1 vs. FRET 3’ #2 denatured 2308 37962 1820 26477 0 5000 10000 15000 20000 25000 30000 35000 40000 - BacTbREL1 + BacTbREL1 AFU 5'#2 / 3'#1 5'#2 / 3'#2 96-well plates, 100 ul, 100 nM FRET oligos, 1x gRNA bridge 1 ul BacTbREL1 prep 8/8/03, adenylylation buffer, 40 uM ATP, 60’ incubation Denatured 2’ at 95C in presence of 20x gDNAcomp Excitation 490 nm, emission 670 nm
- 5. Denature & anneal 10uM 5’ # 2 + 3’ #1 + gRNA #1 @ 72o C 2 min followed by Slow cooling (0.1o C/sec) to 20o C ( in presence of 40uM ATP + 5mM MgCl2 ) Subsequently ligate single labelled species for 30 min to 1 hour @ 27o C using (100ng) of E Coli R1-A2 (#001_6_x) in presence of 0.1% Triton X-100 + 1% DMSO & 10 x adenylation buffer + 40uM ATP Terminate reactions by adding EDTA + gDNA (complementary to g R#1) & heating @ 95o C for 2 min Quantify FRET emission @ 670nM using Micro plate reader
- 6. Testname: FRET1 ACHIM Date: 11/06/10 Time: 14:33:52 ID1: LH_FRET_#001D_110610 ID2: ID3: No. of Channels / Multichromatics: 1 No. of Cycles: 1 Channel / Multichromatic: 1 Cycle: 1 1 2 3 4 5 6 7 8 9 10 11 12 A 5669 5292 5200 5218 5248 5324 5155 5206 5065 4980 4863 5026 B 5457 20960 20225 14854 58106 56331 59128 12115 13822 15417 4860 5114 C 5363 5433 5302 5218 5322 8758 5171 5099 5069 4924 5014 5021 D 5318 12095 11852 11916 56714 38568 58234 65535 5086 5033 5050 5000 # 002 E 5329 5350 5223 5154 5313 5212 5113 5068 5077 4982 5062 4977 F 5337 5236 5192 5136 5160 5102 5140 5127 4989 5035 4964 4950 G 5250 5232 5214 5018 5217 5161 5139 5079 5082 4934 5021 5040 H 5420 5141 5216 5172 5140 5110 5212 5141 5077 5074 5073 5095 # 001 # 002 = FRET Master Mix with Denaturation = FRET Master Mix without Denaturation = No REL 1 control = FRET Master mix without Annealing/Denaturation = No FRET Oligo controls = FRET Oligo's without REL1 Enzyme mix control # 001 # 002 Mean Noise SD Mean Noise SD Bac R1 18679.7 5392.9 13286.8 3333.4 11954.3 5392.9 6561.5 126.0 E Coli R1 57855.0 5392.9 52462.1 1415.3 51172.0 5392.9 45779.1 10941.8 No R1 13784.7 5392.9 8391.8 1651.3 Denaturation No Denaturation Specific MeanSpecific Mean Gain = 48 (set to well B6) # 001 = Baculovirus R1-A2 (Prep #1_080802) 0.5ul (~500ng/ul) = 1:5 E Coli R1-A2 (Prep #001_6_2_160610) 0.5ul (~500ng/ul)
- 7. Comparsion of Baculovirus REL 1 (prep #1_080802) with E Coli R1-A2 ( #001_6 prep 2 ):222.5ng per reaction 8391.8 52462.1 13286.8 0 10000 20000 30000 40000 50000 60000 Bac R1 E Coli R1 No R1 FRET +/- REL 1 SpecificFRET Bac R1 E Coli R1 No R1
- 8. Calibration of BAC REL 1 Preps # 1- 4 (1:1) & E Coli (BL21-DE3) Preps '# 001-080410-1 & 6' (1:5) 1ul 1ul 1ul 1ul 1ul 1ul 0.5ul 0.5ul 0.5ul 0.5ul 0.5ul 0.5ul 0.25ul 0.25ul 0.25ul 0.25ul 0.25ul 0.25ul 0.25ul 0.25ul 0.00E+00 5.00E+07 1.00E+08 1.50E+08 2.00E+08 2.50E+08 3.00E+08 3.50E+08 #1 #2 #3 #4 # 001_1(1:5) # 001_6(1:5) # 001_1(1:5)- 18hr # 001_6(1:5)- 18hr SpecificSignal(counts) BAC Preps E Coli Preps Activity of BAC derived REL 1 and E Coli formulations comparable Indeed, activities derived from BAC preps are associated with 20ul aliquots, whereas E Coli activities are associated with 15ul aliquots, making actual comparisons closer then depicted Both preps are utilised are utilised @ ~0.5mg/ml (total protein) E ColiE Coli L1-A2 preps ~ 2.5mg/mlL1-A2 preps ~ 2.5mg/ml 1:5 diln. ~ 0.5mg/ml1:5 diln. ~ 0.5mg/ml BAC preps ~0.5mg/mlBAC preps ~0.5mg/ml
- 10. 222.5ng 22.25ng 0 min 1 min 5 min 10 min 20 min 40 min 60 min 90 min 120 min 120 5.8% 90 5.7% 60 5.1% 40 2.5% 20 5.5% 10 6.6% 5 3.8% 1 -2.2% 0 0.0% -20 0 20 40 60 80 100 120 %Relativeactivity REL 1 mass Ligation time 0 min 1 min 5 min 10 min 20 min 40 min 60 min 90 min 120 min rLigation in the context of 222.5ng of # 001_6_3/4 results in regular appreciation with time rUsing 22.25ng ligation (~5%), approximates to ligation achieved with 222.5ng of REL 1 at any given time point
- 11. 222.5ng 22.25ng 0 min 1 min 5 min 10 min 20 min 40 min 60 min 90 min 120 min 120 5.8% 90 5.7% 60 5.1% 40 2.5% 20 5.5% 10 6.6% 5 3.8% 1 -2.2% 0 -20 0 20 40 60 80 100 120 %activity(relativetoT120) REL 1 mass Ligation time 0 min 1 min 5 min 10 min 20 min 40 min 60 min 90 min 120 min rLigation in the context of 222.5ng of # 001_6_3/4 results in regular appreciation with time rUsing 22.25ng appreciation of ligated product with time but more inconsistently than 222.5ng rThis explains why, although ligation with 22.25ng relative to 222.5ng, culminates in about 5% (1/20) activity, there is much variance between time points
- 12. FRET Emission versus Ligation time: The effect of 0.1% Triton X-100 on resultant signal: #006-1 prep 3/4 0.0 10000.0 20000.0 30000.0 40000.0 50000.0 60000.0 70000.0 0 min 1 min 5 min 10 min 20 min 40 min 60 min 90 min 120 min Ligation time SpecificFluorescence 111.25ng #001_6 + 0.1% Triton X-100 111.25ng #001_6; No TX-100 No Enzyme control 111.25ng #001_6 + 0.1 % TX-100 + 1ug/ul BSA
- 13. 111.25ng +0.1% TX-100111.25ng +0.1% TX-100 222.5ng. No TX-100222.5ng. No TX-100 111.25ng. No TX-100111.25ng. No TX-100 22.5ng. No TX-10022.5ng. No TX-100 No Enzyme Control_#003 No Enzyme Control_#004 FRET Emission versus Ligation time: The effect of REL 1 mass +/- 0.1% Triton X-100 on resultant signal 0.0E+00 1.0E+04 2.0E+04 3.0E+04 4.0E+04 5.0E+04 6.0E+04 7.0E+04 0 min 1 min 5 min 10 min 20 min 40 min 60 min 90 min 120 min Ligation time SpecificFluorescence 111.25ng #001_6 + 0.1% Triton X-100 111.25ng #001_6; No TX-100 No Enzyme control 111.25ng #001_6 + 0.1 % TX-100 + 1ug/ul BSA 222.5ng #001_6 22.5ng #001_6 No Enzyme control_#003 # 003 ~ 50,000 AFU~ 50,000 AFU
- 14. The effect of DMSO on FRET Ligation: #001- 6_5/2 Preparation (100ng per reaction) 0.0 10000.0 20000.0 30000.0 40000.0 50000.0 60000.0 70000.0 0% 0.20% 0.40% 0.60% 0.80% 1.00% 2.00% 5.00% 10.00% No REL 1 % DMSO in ligation mix (ligation time = 30 min) SpecificFluorescence 0% 0.20% 0.40% 0.60% 0.80% 1.00% 2.00% 5.00% 10.00% No REL 1
- 15. The effect of DMSO on FRET Ligation: #001- 6_5/2 Preparation (100ng per reaction) 0.0 20.0 40.0 60.0 80.0 100.0 120.0 140.0 0.00% 0.20% 0.40% 0.60% 0.80% 1.00% 2.00% 5.00% 10.00% % DMSO in ligation mix (ligation time = 30 min) SpecificSignal(%of'no'DMSO)
- 16. The Effect of ATP concentration on FRET Emission: 100ng #001-6 preparation 6/7 0.0 2000.0 4000.0 6000.0 8000.0 10000.0 12000.0 14000.0 16000.0 18000.0 20uM 25uM 30uM 45uM 70uM 120uM 270uM 520uM 1020uM 2070uM 5020uM ATP Concentration during (30 min) ligation SpecificFluorescence ATP Ligation Titrant Signal values comparatively low compared with previous batches of #001_6 This batch of diluted enzyme was made by thawing out #001_6 stock from -80o C, diluting with HEPES glycerol buffer then snap freezing #001_6 before returning to -80o C
- 18. Testname: CY5 1 ACHIM Date: 01/07/10 Time: 19:38:15 ID1: LH_FRET_#006E_010710 ID2: ID3: No. of Channels / Multichromatics: 1 No. of Cycles: 1 Channel / Multichromatic: 1 Cycle: 1 1827 14677 14685 14299 13873 14303 15152 1714 1616 1611 1566 1610 1698 12891 14003 13291 13694 12760 13958 1640 1595 1612 1594 1631 1692 12816 13406 14041 12720 14144 13749 1639 1607 1577 1608 1618 1645 11568 14126 14484 12865 13640 12772 1695 13251 16850 16724 1602 1635 12490 14342 13167 14098 14206 13737 1641 12920 16000 16931 1596 1676 14052 14250 14013 1657 1649 1632 1621 12048 15087 16478 1573 1620 12330 13745 13166 12646 13005 12745 1609 1635 1602 1588 1596 1672 13502 13811 14021 13370 12878 12739 1606 1626 1619 1572 1561
- 19. Testname: FAM 1 ACHIM Date: 01/07/10 Time: 19:44:31 ID1: LH_FRET_#006F_010710 ID2: ID3: No. of Channels / Multichromatics: 1 No. of Cycles: 1 Channel / Multichromatic: 1 Cycle: 1 29900 65535 65535 65535 65535 65535 65535 27640 26656 25680 24924 26070 28070 64775 65405 65131 64250 64266 64342 26488 25814 25368 24913 26122 27111 64599 64049 65433 60890 65123 64221 26444 25758 25400 25822 25957 27182 58807 65220 65535 63238 64271 62509 26386 61735 65535 56886 25721 26802 61726 65535 63953 65427 65535 65535 26230 61850 64929 57202 25938 26866 65284 65517 65535 26673 26395 26530 26058 57661 63552 54728 25294 25978 64673 65535 65535 65318 65506 65525 25729 25835 25647 25259 25063 26363 65535 65535 65535 65535 65535 65526 25556 25869 25313 25471 25184
- 20. What remains to be done (not a complete list): Test recombinant TbREL1 produced in E. coli Determine catalytic parameters of REL1: Km, kcat, Vmax… Determine whether essential requirements for an assay compatible with HTS are met: enzyme stability, linearity oflinearity of assay, DMSO sensitivity, reproducibility (Z’)…assay, DMSO sensitivity, reproducibility (Z’)… Can we replace heat denaturation with chemical denaturation? More long term: use assay to screen libraries, characterize REL1 in more detail (substrate requirements, mutational analysis…)
- 21. Peak #1Peak #1 Peak #2Peak #2Mid peakMid peak Peak #1Peak #1 Peak #2Peak #2 ● ● ● ● 50KD 40KD 30KD 20KD Post Elution Flow through 44µgµg 1.71.7µgµg 3.53.5µgµg