2. Background
Predictive and mechanistic models are powerful tools to
understand biological processes at the core of systems
biology. Building models requires a list of molecular
components and their interactions. This list can be as-
sembled from prior knowledge and/or inferred, or re-
verse engineered, from dedicated experimental data
[1-3]. This can be done using a simple causal formalism
or, if enough mechanistic detail is available, by writing
down the corresponding biochemical reactions. In both
cases, once a reasonably well-characterized set of com-
ponents and interactions is determined, these can be
converted into a mathematical model. A common and
natural way to model biochemical reactions is to derive
a dynamical system, typically in the form of ordinary dif-
ferential equations. These equations include associated
parameters that quantify the underlying physicochemical
processes such as protein binding and enzyme activity.
The value of these parameters is often not available or
even measurable, and needs to be estimated from experi-
mental data [4-6]. An accurate estimation of the param-
eters is fundamental to quantitatively understand a
system and provide reliable predictions [7,8].
In a real-life scenario of limited resources, the key ques-
tion is how to design experiments that are most useful for
parameter characterization [9], a decision process involv-
ing many variables. This problem falls in the category of
budgeted learning formalized in the field of machine
learning [10]. The first question raised is related to the ex-
perimental conditions that should be considered. When
possible, data is collected upon application of perturba-
tions to the network such as stimulation with extracellular
ligands, chemical inhibition or gene over-expression.
Moreover, data can be collected at different times after
perturbation to provide information on the temporal evo-
lution of the system. It is hence necessary to determine
the identity and number of perturbations and whether to
generate data from individual or combined perturbations.
The next decision is related to the choice among a battery
of technologies available to perform the measurements.
These normally entail a trade-off between coverage, cost,
and precision. For example, one can track over time the
levels of a few proteins in single cells using GFP (Green
Fluorescence Protein) tags and movies [11-18], or measure
thousands of proteins in a few time-points with mass
spectrometry [19]. How to choose among all these options
is not obvious and, despite the critical importance of these
questions, the problem of parameter estimation and itera-
tive experimental design remains one of the hardest chal-
lenges in systems biology [4-6,9,20,21].
To explore this fundamental problem in a rational and
unbiased fashion, we first set up the parameter estimation
challenge, where we tried to reproduce the common set-
ting in which an experimental laboratory uses instruments,
expertise and an allocated budget (e.g. from a grant) to
apply various experimental techniques to investigate a bio-
logical model system. To mimic this scenario, we built the
model of a regulatory network for 9 genes based on differ-
ential equations describing the underlying molecular biol-
ogy, including transcription and translation. We chose a
model configuration that can generate non-trivial dynamic
behavior. We then generated data with this model that in-
cluded experimental noise and asked participants to find
the model’s parameters. Each participant was given a
budget of ‘credits’ that could be used to buy different ex-
periments that reflected trade-offs between coverage, cost
and resolution. We provided participants only the model
structure and challenged them to estimate the hidden par-
ameter values. Given that the true values of the hidden pa-
rameters were known, we could precisely assess the
performance of the methods used by the 12 different
teams that participated in the challenge. Remarkably, des-
pite the complexity of the network and the limited data re-
sources, some teams obtained highly accurate parameter
values.
Besides the question of the algorithmic/experimental
strategy used to infer the kinetic parameters of a model,
we also addressed how well new connections in a net-
work could be inferred. This is also a relevant question,
as many canonical pathways are only approximations to
the system under study. We therefore ran a second chal-
lenge, the network topology inference challenge, where
participants were given an incomplete topology with 11
genes and asked to find 3 missing links in the model.
This challenge was only partially solved, suggesting that
inferring topology is a much harder challenge than par-
ameter estimation. Finally, we observed that aggregating
the participants’ parameter predictions and network top-
ology submissions provided potentially better solutions
than individual participants.
We complemented the analysis of the submissions by
analyzing the participants’ algorithmic strategies and
credit usage for data acquisition. We concluded that
using fluorescent data from protein time courses is a key
component of parameter estimation strategies, and that
in both challenges aggregation created solutions that
fared as well or better than the best performing ap-
proaches. We chose an in silico challenge framework in
order to have a well-defined gold standard for evaluating
submissions, but we believe the setup of this work emu-
lates the experimental design choices faced by real la-
boratories, and thus the insights gained here provide
insights for real experimental design when trying to de-
termine the parameters of a gene regulatory network.
Results
In both the network topology and parameter inference
challenges, participants were asked to develop and/or
Meyer et al. BMC Systems Biology 2014, 8:13 Page 2 of 18
http://www.biomedcentral.com/1752-0509/8/13
3. apply optimization methods, including the selection of
the most informative in silico experiments, to accurately
estimate parameters and predict outcomes of perturba-
tions from a model of a gene regulatory network. This
challenge was divided in two parts. The first is param-
eter inference, which was similar to the parameter esti-
mation challenge proposed in DREAM6, as explained
here below. The second challenge is network topology
and was unique to DREAM7.
A realistic model of a gene regulatory network
In model 1 for the parameter inference challenge, partic-
ipants were provided with the complete structure of the
model (including expressions for the kinetic rate laws)
for a gene regulatory network composed of 9 genes and
modeled with differential equations. For each gene, both
protein and mRNA are explicitly modeled and therefore
the model contains 18 continuous variables. The complete
model is available in the Additional file 1 (see Model &
Submissions).
The regulation of each gene was inspired from pro-
karyotes and modeled as follows: each gene can have,
upstream of the protein coding region, an activator
binding site, an inhibitory binding site, a promoter,
and a ribosomal binding site (Figure 1A shows an ex-
ample). Transcription rates were considered to be
non-linear Hill-type functions of the regulatory inputs –
activatory or inhibitory. A basal constant rate of tran-
scription is assumed when a gene has no regulatory
input. The transcription rate for a given gene is propor-
tional to the promoter strength of the corresponding
promoter and the translation rate is proportional to the
ribosomal binding site’s strength. We assumed that
transcription factors bind to operator sites independ-
ently and this is reflected in the transcription rate being
expressed in a multiplicative form (e.g. as4 * rs2 in
Figure 1A).
For each regulatory process, activation or repression,
two parameters have to be estimated: the dissociation
constant Kd and the Hill coefficient h. In model 1, for
each protein production process, there are two parame-
ters to be estimated: the promoter strength and the ribo-
somal binding site strength (see Figure 1A). The unit of
time is normalized with the inverse of the mRNA deg-
radation rate, and therefore time is non-dimensional: it
is measured in units of the mRNA half-life (see Figure 2A
for mRNA dynamics). All mRNA and protein degrad-
ation rates are constants in model 1 with a fixed value
of 1 for mRNA, which is known by the participants. The
protein degradation value is unknown and must be esti-
mated from the data as part of the challenge. Therefore
the total number of parameters to estimate in model 1
is 45: 18 from the regulation of 9 proteins (9 promoter
and 9 ribosomal binding strength parameters), 26 from
13 regulation processes (13 Kd, and 13 Hill parameters;
see Table 1) and the protein degradation rate. The com-
plete network is depicted in Figure 1B. The partici-
pants were required to provide the values for the 45
parameters of model 1 as well as the time courses of
proteins p3, p5, and p8 under perturbed conditions
defined below.
Although the basic structure for both challenges is
similar, the network topology challenge, referred to as
model 2 hereafter, was simplified as compared to model
1 from the parameter inference challenge. In model 2, an
incomplete structure of the regulatory interaction net-
work topology was provided, with 3 missing regulatory
links (see Additional file 2: Figure S2A). The gene regu-
latory network was composed of 11 genes where tran-
scription was ignored and therefore only proteins were
explicitly modeled (11 relevant variables). In contrast to
model 1, the values of all protein degradation rate con-
stants are not identical. In model 2, for each protein pro-
duction process only the promoter strength has to be
estimated and the protein production rate for a given
gene is assumed to be proportional to the promoter
strength of the corresponding promoter. Therefore,
given that there are 16 regulatory interactions among
the genes, the total number of parameters to estimate is
61: 3 for each regulatory interaction (16 synthesis rates,
16 Kd, and 16 Hill parameters), 11 degradation rates,
and 2 basal transcriptional rates for genes 5 and 11 that
are not regulated by any other gene (see Table 1). Finally,
participants were asked to provide the three missing
links in the gene network (r9, r10 and r12 in Additional
file 2: Figure S2A), as well as their associated parameters
(Kd and h).
A credit system mimicking a limited experimental budget
The participants are given a virtual budget of ‘credits’ to
buy data from experiments (produced in silico). These
experiments are used to estimate parameters of the gene
regulatory networks in order to predict the dynamics
under a perturbed condition in model 1 or to determine
the missing links in model 2. The models were initially
sketched out using TinkerCell [22] and simulated and
tuned using Jarnac [23]. Perturbations that provided the
data sets used for the parameter estimation were gener-
ated using Jarnac. We ran a first parameter estimation
challenge (very similar problem to model 1) in DREAM6
(2011) with 3 models of 6, 7 and 9 genes. In DREAM6
we found compatibility issues when using different
solvers. Therefore, in DREAM7 we ran these simulations
with COPASI [24], Jarnac, Matlab [http://www.mathworks.
com], SBML simulator [http://www.ra.cs.uni-tuebingen.de/
software/SBMLsimulator/index.html] and Roadrunner
[https://code.google.com/p/roadrunnerlib/] to ensure that
different tools, which potentially have different underlying
Meyer et al. BMC Systems Biology 2014, 8:13 Page 3 of 18
http://www.biomedcentral.com/1752-0509/8/13
5. integrator routines, would provide the same results. The
available perturbations and their associated costs are:
i. gene deletion, that produces the elimination of both
mRNA and protein for the gene for 800 credits;
ii. siRNA-mediated knockdown, that increases the
mRNA degradation rate 10-fold for 350 credits;
iii. a decrease of RBS (ribosomal binding site) activity
that leads to a 10-fold decrease in translation rate
for 450 credits.
Upon each of these types of perturbation, the teams
could purchase data collected with different technolo-
gies, reflecting the relative ease or difficulty of acquiring
(See figure on previous page.)
Figure 1 Model and gene regulatory network of the parameter estimation challenge. A. Example of a case of regulation of the transcription of
coding sequence g4 by proteins p1 and p4, respectively activator and repressor, through the activator (as4, green box) and repressor (rs2, red box) sites.
The rate of production of g4 is given by the transcription dependent on the promoter pro4. The rate of production of p4 is given by the translation
dependent on the ribosomal binding site rbs4. B. Gene network from model 1 of the Parameter Prediction challenge consisting of 9 genes whose 45
parameters and the prediction of response to perturbations were requested from challenge participants.
0
5
10
15
20
25
30
0 5 10
12
J=1
Participants
Score
0
0.1
0.2
0.3
0.4
0.5
0.6
0.7
0.8
0.9
1
v13_Kd
rbs4
rbs8
rbs5
rbs6
rbs3
v2_h
Correlationcoefficient
Model1 parameters
Protein
degradation
B
D
A
C
time
Figure 2 Scores and correlation between parameter and protein prediction distances for model 1. A. Graph representing the dynamics of
the mRNAs from the 9 genes for model 1 network. Dots are the data with noise, lines represent the data without noise and shades the associated
noise model B. Overall scores from the participants calculated from the p-values as indicated by the formula. P-values were obtained from the two
different metrics used for challenge scoring described in Additional file 3: Figure S1. C. The participant distances defined for scoring the submitted
predictions for the parameters and the protein perturbation predictions are plotted respectively in the y-axis Dparam and x-axis Dprot. Each team is
represented by its rank number in the final scoring except for the best performer Orangeballs. The R2
coefficient for a linear fit in log-scale is 0.23; the
red line is a visual reference for a perfect fit. D. For each of the 45 parameters in the model, the vector of parameter values submitted by the 12
participants is correlated (R2
) to the unique vector of Dprot values, the protein perturbation prediction distance values. The graph shows the
parameters ordered by increasing correlation value, with from left to right, pro5_strength, v10_Kd, pro3_strength, v9_Kd, v4_h, v8_Kd, v8_h, v1_Kd,
v11_h, v1_h, pro7_strength, v4_Kd, v12_Kd, pro8_strength, rbs9_strength, v10_h, pro2_strength, v9_h, pro1_strength, v12_h, v5_h, pro4_strength,
v3_h, v7_h, rbs7_strength, v3_Kd, rbs2_strength, pro9_strength, v6_h, rbs1_strength, v7_Kd, pro6_strength, v6_Kd, v11_Kd, v2_Kd, v5_Kd, v13_h,
p_degradation_rate, v2_h, rbs3_strength, rbs6_strength, rbs5_strength, rbs8_strength, rbs4_strength, v13_Kd.
Meyer et al. BMC Systems Biology 2014, 8:13 Page 5 of 18
http://www.biomedcentral.com/1752-0509/8/13
6. this type of data in reality. Specifically, participants could
buy time course data for:
i. protein abundance for 2 proteins of their choice at
the highest resolution (every time unit) using
fluorescence protein fusion for 400 credits;
ii. mRNA (for all genes) measured with a microarray,
at either low resolution (every 4 time units) or high
resolution (every 2 time units), at 500 and 1000
credits, respectively. Microarrays were only available
in challenge 1, since the model of challenge 2 does
not include mRNA;
iii. protein abundance for all proteins measured via
mass spectrometry, also at high and low resolution
for 500 and 1000 credits, respectively. This was
available only in challenge 2, as an alternative to the
microarrays of challenge 1.
Specific parameter values, namely the binding affinity
(Kd) and Hill coefficient (h), obtained from a gel-shift ex-
periment, were also available for 1600 credits for a given
transcription factor.
Finally, in both data modalities a noisy measure-
ment is simulated by adding some noise to the deter-
ministic value of each variable. More precisely, if v is
the simulated value, we report as the measured value:
vnoisy = v + 0.1 × g1 + 0.2 × g2 × v, where g1 and g2 are
Gaussian random variables with standard deviations of 1.
That is, for small v the standard deviation of vnoisy is close
to 0.1, while when v is large, vnoisy amounts to measuring
v with a standard error close to 20% of the true value.
Note that if the value after noise addition is smaller than
0, the value of vnoisy is clipped at 0.
Challenge results
The network topology and parameter inference challenge
is composed of two parts corresponding to the two sub-
challenges. The scoring of participants’ submissions
reflects this two-tiered structure and is composed of two
different scores (see Methods for a detailed description).
The first score determines the ranking of teams in the
parameter inference challenge by combining (i) the dis-
tance between the simulated and predicted protein con-
centration values and (ii) the distance between estimated
and known parameters (model 1). The second score
ranks the network topology challenge submissions based
on the predictions for 3 missing links in the regulatory
gene network (model 2).
In order to solve the challenge, participants were
allowed to spend credits to procure data generated in
silico. One could have designed a multi-optimization
task where participants would have to balance their per-
formance with budget expense. However, there is no
standard or obvious way of deciding the optimal balance
between these two terms. Thus, reflecting the common
situation of an experimental laboratory that has been
awarded a research grant with a budget for experiments
to be spent in a certain amount of time, scoring in this
challenge considered only their predictions. It did not
take into account the amount of credits spent, and par-
ticipants were encouraged to spend the whole budget.
As the questions posed in models 1 and 2 are differ-
ent, identifying topology in one case and identifying pa-
rameters in the other, we decided to separate the two
challenges and select a winner for each one. Figure 2B
and Table 2 indicate that team orangeballs is the clear
winner of the parameter estimation challenge with an
overall score of 27.40 (see Additional file 3: Figure S1 for
p-values). Table 3 shows that the winner of the network
inference challenge is team crux with an overall score of
1.83 (see Additional file 3: Figure S2B for p-values).
Parameter inference results
An intriguing result of the parameter inference challenge
is that although the best performing team orangeballs
achieved the least error in both submitted parameters
and protein predictions, these two metrics did not
always correlate (see Table 2). The 10th
overall ranked
team was second in parameter estimation but last in
protein prediction. Conversely, the second overall ranked
team was next to last in parameter estimation but second
in protein prediction (Figure 2C). Although, as indicated
by an R2
= 0.23 for the correlation of parameter distance
D1
param
to protein prediction distance D1
prot
(Figure 2C), it
is expected that some parameters do not influence the
outcome of certain proteins, the discrepancy for the 2nd
and 10th
overall ranked teams was puzzling. After contact-
ing the 10th
team we learned that their optimization ob-
jective was centered on the parameters and not on protein
prediction. This underscores how the choice of scoring
metric is not a trivial question and can dramatically influ-
ence the results [5]. Conversely, the 2nd
ranked team
Table 1 Model parameters summary
Parameter Model 1 Model 2
Promoter strength 9 X
rbs strength 9 X
Protien synthesis X 16
Basals X 2
Degradation rate 1 11
kd 13 16
Hill coefficient 13 16
Total 45 61
Parameters involved in the parameter estimation challenge and the network
topology challenge. The nature of each parameter is indicated on the first
column, and the number of parameters in Model 1 for the parameter
estimation challenge and Model 2 for the network topology challenge are listed
in the second and the third column, respectively.
Meyer et al. BMC Systems Biology 2014, 8:13 Page 6 of 18
http://www.biomedcentral.com/1752-0509/8/13
7. focused on the prediction of the protein values, and
grouped together parameters that they found to be non-
identifiable. Combinations of such non-identifiable param-
eters, such as Kd and h for a regulation reaction, were the
quantities important to be able to correctly predict per-
turbed values for p3, p5 and p8; thus, parameters far from
the gold standard would still lead to good predictions of
protein perturbation, as long as the implied combined
quantities were close to the model solution. It is possible
that different parameter values could lead to similar dy-
namical behavior and, as the 2nd
ranked team did, repro-
ducing the original dynamical system behaviors might be
more relevant than parameter estimation.
To further investigate this possibility, we analyzed the
dependence of the protein perturbation predictions on
each individual parameter, and calculated for each one
of the 45 parameters the correlation of the vector of par-
ticipants’ submitted parameter values to their protein
prediction distance, D1
prot
. D1
prot
was most dependent on
the values of parameters directly involved in p3, p5 and p8
production such as, Kd for r13 (R2
= 0.88), rbs4 (R2
= 0 .66),
rbs8 (R2
= 0.61), rbs5 (R2
= 0.59), rbs3 (R2
= 0 .45)
(Figure 2D). Only protein degradation (R2
= 0 .35) is a
global parameter. The strong dependency of p3, p5, p8
prediction levels on only a few parameters may explain
the low correlation between D1
prot
and D1
param
.
Aggregation of participants’ results
For model 1, most participants’ time-course predictions of
proteins p3, p5 and p8 are close to the solution (Figure 3A
blue lines) but, as seen in other DREAM challenges
[25,26], aggregated participant submissions are robust, as
Table 2 Scores and features of parameter inference challenge
Model 1 Parameter
distance
Dparam
P-value for
parameter
predictions
Protein
distance
Dprot
P-value
for protein
time course
predictions
Score Bayesian Decompose
network"
Selection of data Sampling
Orangeballs 0.0229 3.25E-03 0.002438361 1.21E - 25 27.4 no yes Game Tree Sequential local
search
2 0.8404 1.00E + 00 0.016023721 3.39E-18 17.5 no no Manual based on
parameter uncertainty
Global method
3 0.1592 6.00E-01 0.035404398 4.45E-15 14.6 yes no Manual LH
4 0.0899 1.88E-01 0.047495432 6.28E-14 13.9 no yes Manual LM + Particle Swarm
5 0.1683 6.45E-01 0.09791128 4.01E-11 10.6 yes no Train + Sim UKF
6 0.0453 1.37E-02 0.198785197 1.93E-08 9.6 no no A=Criterion Local (LM)
7 0.1702 6.45E-01 0.362463945 2.90E-06 5.7 no yes Sensitivity analysis Hybrid (Local + Global)
8 0.8128 1.00E + 00 0.356429217 2.53E-06 5.6 yes no Estimation of improved
uncertainty
Global (MH)
9 0.3766 9.99E-01 0.817972877 1.34E-03 2.9 yes yes MI ABC-SMC
10 0.0699 9.83E-02 19.32326868 1.00E + 00 1.0 no yes Minimize variance
based on FI
Multistart local search
11 0.1883 7.29E-01 3.222767988 6.90E-01 0.3 no no Train + Sim LH + DE
12 5.0278 1.00E + 00 14.77443631 1.00E + 00 0.0 no no Manual Local method
Table for Model 1 of the parameter inference challenge contains anonymized teams (except for best performer) ordered by Score rank. Next to each team is listed
its parameter distance and associated p-value, protein distance and associated p-value and the score. The last four columns indicate the features of the fitting
strategies used by the participants. Abbreviations used for the features: ABC-SMC, Approximate Bayesian Computation with Sequential Monte Carlo; DE, Differential
Evolution; FI, Fisher Information; LH, Latin Hypercube; LM, Levenberg-Marquardt; MH, Metropolis Hastings; MI, Maximize Mutual Information between parameters
and output of experiments; Train + Sim, iterative steps of training on data and simulation to find most informative experiments; Rank rank experiments in top 10%
of the A-Criterion (trace of the covariance matrix) according to price; UKF, Unscented Kalman Filtering.
Table 3 Scores and features of network topology challenge
Model 2 Network score p-value Score Link addition
crux 12 1.49E-02 1.83 Manual
2 9 5.60E-02 1.25 Manual
3 8 1.07E-01 0.97 Manual first + algorithm
4 8 1.07E-01 0.97 Manual('logic reasoning')
5 8 1.07E-01 0.97 Manual
6 7 2.10E-01 0.68 Algorithm(Grenits)
7 6 3.83E-01 0.42 Manual
8 5 6.01E-01 0.22 Manual
9 4 8.01E-01 0.10 Did not participate
10 4 8.01E-01 0.10 Did not participate
11 3 9.86E-01 0.01 Manual
12 2 1.00E + 00 0 Algorithm GP-DREAM
Table for Model 2 of the Network topology Challenge contains anonymized
teams (except for best performer) ordered by Score rank. Next to each team is
listed their network score snetwork
, associated p-value and the final score Score.
The last column indicates the features of the link addition strategies used by
the participants.
Meyer et al. BMC Systems Biology 2014, 8:13 Page 7 of 18
http://www.biomedcentral.com/1752-0509/8/13
8. A
B
C D
Figure 3 Scores of aggregated participant results. A. Protein concentrations of participants’ predictions (in blue) and the solution (green) are
plotted against time for proteins p3, p5 and p8 under the perturbed conditions considered for scoring. B. Participant submissions are aggregated by
averaging each protein concentration for individual time points, starting from the 2 best performing teams until all 12 teams are included. Each
aggregated result is plotted in blue and the solution is plotted in green. C. Log scale distance to the solution of parameter predictions is plotted for
participant teams ordered by rank (blue line) and geometric means of parameter predictions from teams ordered by number of aggregated teams
following parameter distance rank (green line) or inverse rank order (red line). D. Log-scale distance to the solution of proteins p3, p5 and p8 under
perturbed conditions is plotted for participant teams ordered by rank (blue line) and aggregated teams. Aggregations were computed for the predictions
of the teams, ordered by number of aggregated teams ranging from 1 to 12, following prediction distance rank (green line) or inverse order (red line).
Meyer et al. BMC Systems Biology 2014, 8:13 Page 8 of 18
http://www.biomedcentral.com/1752-0509/8/13
9. the prediction is close to the gold standard and ‘buffers’
outliers (Figure 3B blue lines). Predictions were aggregated
by averaging each protein concentration for individual
time-points starting from the best performing team,
followed by averaging the first and second best performing
teams, and so on until all 12 teams were included.
This phenomenon also occurs when aggregating the
participants’ submitted parameters by geometric mean
using the same procedure as above. D1
param
for this ag-
gregation by geometric mean shows that for up to eight
aggregated teams, the aggregated team submission is
closer to the solution when compared to D1
param
for the
best individual team submission (Figure 3C blue line
and green line). However, performance of teams aggre-
gated from worst to best (that is, the worst performing
team, followed by the worst and second worst perform-
ing teams and so on until all 12 teams are included)
fares overall poorer than individual teams (Figure 3C red
line). In a real situation, without the gold standard, one
would not know which participants fare better; in such a
case performance of randomly aggregated predictions
would fall between these two extreme cases of aggrega-
tion. Importantly, aggregating parameters of all teams
fares as well as the third best performing team, and
therefore it is a better strategy to aggregate results from
multiple teams than choose a single given method.
Results are mitigated when one considers D1
prot
as a
measure of the effectiveness of the aggregation of solu-
tions. Indeed, choosing as a solution the aggregation of
all teams brings a D1
prot
that is worse than eight of the
teams (Figure 3C blue line and last point in green line).
This is due to the fact that participants obtained very
good predictions for the protein measurements: the win-
ner orangeballs obtained a relative p-value of 1.21. 10-25
,
compared to 3.35. 10-3
for parameter estimation results
(see Additional file 3: Figure S1). In practical terms, the
aggregated prediction of all teams as shown by Figure 3B
is still a very good prediction for the perturbations
effect.
In model 2, to find the participants’ consensus 3 missing
links, we counted how often links were submitted by par-
ticipants and chose the 3 most popular ones (Figure 4C).
Although this strategy limits the possibility of obtain-
ing higher scores, as most participants submitted links
that controlled only one gene, the score of this con-
sensus submission matches the best performing team
crux (Figure 4B & C).
Analysis of participants’ strategies and experimental
credit usage
The various types of data and perturbations were used
differently by teams for each of the challenges. Available
data types were slightly different between the challenges,
since mass spectrometry data was not available for
challenge 1 and microarray data was not available for
challenge 2. Of the 13 different possible combinations of
experiments, the most demanded one was the measure-
ment via fluorescent microscopy of time-courses of two
proteins (Figure 5A). This experiment, which was also
the cheapest one, was requested in 68% of all the teams’
inquiries and also for the best performing team orange-
balls. The most demanded type within the fluorescent
experiments was wildtype (33%). The low-resolution
wildtype microarray was the least demanded, as it was
given as initial data to the participants. In 15% of the so-
lution strategies, teams used credits to purchase the
Michaelis constant and Hill coefficient parameters via
gel-shift experiments.
For the network inference challenge, credits were
mostly spent on mass-spectrometry, although fluores-
cent microscopy of wildtype time-courses came in a
strong second (see Figure 5C). In contrast to the param-
eter estimation challenge, no team directly bought pa-
rameters via a gel-shift experiment. Alternative strategies
can also be seen on the paths followed by the partici-
pants when purchasing experimental data (Figure 5B
and D for models 1 and 2, respectively). In brief, winning
strategies for model 1 acquired microarray data to have
precise measurements on genes and then mainly used
fluorescent time-course experiments to refine parameter
values. For model 2, wild-type fluorescence data was used
to cheaply find disagreements between data and model
and then mass spectroscopy experiments with perturba-
tions were used to test for potential missing links.
These differences indicate alternative strategies for the
solution of both challenges (see details in Tables 2 and 3).
Briefly, 5 out of 12 teams used a Bayesian framework, and
4 used some strategy based on decomposing the network
into smaller sub-networks for further analysis. The sam-
pling of the parameter space was performed with a variety
of methods: local, often using multi-start strategies to
avoid getting stuck in local minima; global; or hybrid. The
key question for model 1 was how to choose new inform-
ative experiments. To address it, most teams used in silico
perturbations to infer which experiments would be more
informative. They defined this using different metrics,
such as Fisher information, mutual information, etc. Par-
ticularly innovative was the strategy of the winning team
orangeballs based on a game tree, as it could easily be
adapted to bigger networks. For challenge 2, asking which
experiment was the most informative had to be combined
with a strategy to explore the network topology to find
missing links. Few teams used algorithms for network in-
ference, while most teams, including the winner, used
heuristics based on manual inspection of the network and
intuition. As an illustration of the different approaches,
the best performers for each challenge describe in detail
their strategies in the following sections.
Meyer et al. BMC Systems Biology 2014, 8:13 Page 9 of 18
http://www.biomedcentral.com/1752-0509/8/13
10. Winning strategy for the parameter estimation challenge
(from team orangeballs)
The basic idea of our approach was to compute a
maximum-likelihood fit of the model parameters given
observed data purchased from in silico experiments.
Computing the likelihood function is straightforward be-
cause once the model parameters have been specified,
we have all the equations needed to simulate time
courses and calculate likelihoods based on the specified
noise model. Choosing an optimal sequence of data pur-
chases is challenging, however: because of the limited
budget, it is critical to select experiments most likely to
be informative even when the model behavior is initially
largely unknown.
We began our analysis of each model by buying time
courses of all proteins under wildtype conditions. These
experiments were by far the cheapest and allowed us to
start making initial guesses at parameter values. For ex-
ample, the protein degradation rate can be estimated
from the time course of a non-regulated protein (e.g., p6
in Figure 1B), the RBS values can be read off from
steady-state values of [protein]/[mRNA], and in cases
where we have a guess that regulatory coefficient values
are close to 1 (as they often turned out to be), promoter
0
0.2
0.4
0.6
0.8
1
1.2
1.4
1.6
1.8
2
0 5 10Participants
Score
Consensus Network
Solution score
5 - 5 - 6
11 + 7 + 11
7 - 1
Solution
r9
r10
r12
11 - 1
7 + 11
7 - 1
11 - 8
11 - 11
11 - 7
8
6
4
3
2
2
Participants
links
Consensus
Network
#Times
submitted
11
7 1
Consensus
Network
Solution
11
7 1
A B
C D
Figure 4 Dynamics and scores of the network topology challenge. A. Time courses of the proteins from the 11 proteins in the model 2
network. Dots are the data with noise, lines represent the data without noise and shades the associated noise model. B. Ordered scores from the
participants as well as the score of the consensus solution defined as the 3 most submitted links. Scores were calculated from the p-values as
indicated in Methods, Additional file 2: Figure S2 and Additional file 1. C. The 3 links r9, r10, r12 composing the solution to the Network Inference
challenge are shown in their numeric (top left) and diagram (bottom left) notations. The list of submitted participant links is shown (right) in its
numeric notation as well as the number of times such links were submitted. The links colored in blue indicate the consensus network composed
of the 3 most submitted links whose score is indicated in (B). D. Diagrams of consensus network of links (blue) and solution (black). Dashed arrow
indicates an indirect regulation.
Meyer et al. BMC Systems Biology 2014, 8:13 Page 10 of 18
http://www.biomedcentral.com/1752-0509/8/13
11. strength values can be found from steady-state mRNA
concentrations. Observation of the dynamics of protein
and mRNA time courses also sometimes allows estima-
tion of dissociation constants.
Having initial guesses of the parameters, we then viewed
the problem of choosing successive data purchases as a
game tree of possible sequences of experiments, with the
goal being to identify paths most likely to reduce the un-
certainty as much as possible at minimum cost. Given that
the optimal sequences change as data is purchased (re-
vealing information about the model parameters), we gen-
erally tried to find experiments to perform early on that (i)
A B
C D
Totalnumberofexperiments
Totalnumberofexperiments
Figure 5 Analysis of experimental credit usage in challenges A. Histogram indicating the number of times credits were spent on an
experiment for the parameter estimation challenge. The nature of the experiments is indicated on the horizontal axis. B. Histogram indicating the
number of times credits were spent on an experiment for the network topology challenge. C. Diagram indicating the sequence of experiments
performed in the parameter estimation challenge. Each box represents a different experiment and the arrows indicate the sequence followed.
Dark arrows represent the most used paths with numbers indicating usage, and grey arrows indicate a single usage. The path of the winning
team is shown with red arrows and the order of the experiments is indicated via roman numerals. D. Diagram indicating the sequence of
experiments performed in the network topology challenge. Each box represents a different experiment and the arrows indicate the sequence
followed as in (C).
Meyer et al. BMC Systems Biology 2014, 8:13 Page 11 of 18
http://www.biomedcentral.com/1752-0509/8/13
12. were likely to be necessary regardless of the actual param-
eter values, or (ii) would provide information distinguish-
ing the most disparate possibilities (e.g., in some cases it
was impossible to tell initially whether a regulator was
performing full activation or zero activation).
Because of the combinatorial complexity of possible
data purchase paths, however, it was critical to apply
heuristics to estimate the utility of purchases and to
limit the search space. Given the heuristic nature of the
search and the relatively small size of the networks, we
found it most practical to map out plausible purchase
paths on paper rather than codifying our game tree
search scheme. We now describe a few key heuristics we
developed that we found most valuable.
Steady-state values provide the cleanest
measurements of parameters because having a
multiplicity of measurements of the same steady-
state value allows for averaging out noise. Moreover,
combining different steady-state values enables
direct inference of activation and repression
parameters (kd and h coefficients). Indeed, at steady-
state, the following relations hold:
mRNA degradation rateð Þ Ã mRNA½ Š
¼ pro strengthð Þ Ã regulatory termsð Þ
and
protein degradationð Þ Ã protein½ Š ¼ rbs strengthð Þ Ã mRNA½ Š
Combining these equations,
regulatory termsð Þ
¼ mRNA degradation rateð Þ Ã protein degradation rateð Þ
à protein½ Š= pro strengthð Þ Ã rbs strengthð Þð Þ
Considering for the moment the case of a single
repressor, there are two unknowns, Kd and h, and
the left side has the form
1
1 þ regulatory protein½ Š
Kd
h
Different steady-states under experimental perturbations
yield values of the right side corresponding to different
values of the regulatory protein concentration, and
taking ratios of these values isolates the effect of the
regulation. It follows that 3 steady-state measurements
are theoretically enough to determine Kd and h. In
light of noise, however, it is very important that the
steady states cover a range of concentrations of the
regulatory protein that includes or comes near
the value of Kd.
For the purpose of obtaining new steady-state
measurements at minimal cost, a trade-off has to be
considered between protein measurements (which
get 2 new steady states) and mRNA measurements
(which get values for all genes, but at much lower
resolution). Additionally, a given perturbation
typically only produces new steady states for a small
number of genes because the effect of the perturbation
is often mitigated downstream (by saturation of an
activator or repressor). We found that 2-protein
measurements generally seemed to be most cost-
effective with a few exceptions.
Most protein and mRNA time courses simply
converge to steady-state behavior, but in cases with
interesting dynamics, the time trace information is
highly informative and can allow inference of
parameters with fewer perturbations; this is
important to keep in mind to reduce costs.
For some regulations, the only option is to measure
Kd and h directly using (expensive) gel-shift
experiments. These problematic cases arise when it
is difficult to keep the protein concentration at the
scale of Kd for a reasonable amount of time; most
often this happens when Kd is very small and the
regulating protein increases quickly in concentration.
Another case is if K is much larger than any observed
concentrations of the regulatory protein.
These heuristics collectively allowed us to drastically
limit the number of candidate experiments to consider
at each purchasing step, typically just to one or two pos-
sible experiments directed at investigating each unknown
parameter. Because the scoring function was based on
total squared relative error, prioritizing the least con-
strained parameters was clearly advantageous and further
reduced the search space. Additionally, whenever we were
able to identify components of a model that functioned
approximately independently, we applied a divide-and-
conquer approach to analyze each component in isolation –
again limiting the combinatorial explosion of search paths –
and then aggregated the results,
As a final note, after finding potential perturbations to
run using these heuristics, we were able to test whether
the experiments were likely to achieve their objectives
by simply simulating the effects of the perturbations and
checking whether different values of the parameters led
to noticeably different time traces. We found this simple
check to be very useful in helping decide which data to
buy.
Winning strategy for the network inference challenge
(from team crux)
From the point of view of statistical methodology, inferring
missing links in a gene regulatory network model based on
experimental data constitutes a model discrimination issue.
Meyer et al. BMC Systems Biology 2014, 8:13 Page 12 of 18
http://www.biomedcentral.com/1752-0509/8/13
13. We applied the classical maximum likelihood methods to
address this benchmark challenge.
For the given error model which can be described by a
probability distribution ρ and a presumed network struc-
ture M, the likelihood is a product
L θð Þ ¼
Y
i
ρ yi M; θj Þð
over all data points yi interpreted as a function of the pa-
rameters θ. Evaluating the likelihood L requires the nu-
merical integration of the ODEs which we performed
using the CVODES algorithm of the SUNDIALS pack-
age [27]. Estimating the parameters by the maximum
likelihood method requires numerical optimization of
the likelihood. For this purpose, the trust-region method
(MATLAB, R2011a, The Mathworks Inc., Natick, MA)
was applied. Since gradient-based optimization critically
relies on the accuracy of the first derivatives and finite
difference approximations are known to be inappropriate
for ODEs [28], the first derivatives were calculated by
solving the so-called sensitivity equations [27]. The
Hessian is approximated as a product of the Jacobian to
obtain second derivative information [29].
Since the model is nonlinear with respect to the pa-
rameters, the likelihood landscape can exhibit local
minima. Therefore, optimization was repeated using
multiple initial guesses. For this purpose, we used Latin
hypercube sampling to efficiently explore the parameter
space [30].
To assess the model’s ability to explain the data, we
used the least-squares goodness of fit statistic.
χ2
¼
X
i
yi−xið Þ2
σ2
where x denotes the concentrations predicted by the
model. Moreover, likelihood ratios have been utilized to
statistically test whether extending the model by add-
itional parameters significantly improves the fit. Since in
the challenge the measurement errors were given as nor-
mally distributed, log-likelihood ratios are in fact pro-
portional to differences of χ2
.
The profile likelihood [31] was used to assess param-
eter identifiability. Informative experimental conditions
were found by exploring the model predictions within
the parameter confidence intervals, i.e. by simulating the
model for all parameter vectors obtained within the pro-
file likelihood calculation [31]. In general, perturbations
and observations which are informative for estimating
parameters are characterized by large variations of the
model predictions which are reduced if the respective
conditions are evaluated experimentally [32]. In the case
of several potential model structures, this procedure can
be repeated for each model to identify experimental
setups where candidate models yield qualitatively differ-
ent predictions.
Initially, we performed less costly protein measure-
ments for the wildtype setting to have a minimal amount
of experimental information enabling the application of
the tools introduced above. In this stage, we already
gained confidence that the data required an extension of
the model allowing for oscillations. Introducing a negative
feedback on protein p1 mostly improved our outcome.
In the next stage, we favored mass spectrometry ex-
periments since they provide comprehensive information
of all regulators and targets. Having a complete data set
for a perturbation setting is advantageous to minimize
the risk of erroneously proposing links. Moreover, we
preferred high-resolution data to obtain as much infor-
mation as possible about the dynamics. We noticed that
missing links with a Hill-type kinetic are only identifi-
able if the concentrations of the regulator cover the
range around the respective Michaelis constant Kd.
Therefore, we primarily concentrated on perturbations
where we expected largely different concentration ranges
of potential regulators.
Additional file 4: Table S1 provides a summary of our it-
erative experimental planning decisions. We could cor-
rectly identify the regulatory effects of p7 and p11, we
found p1 as negatively and p11 as positively regulated tar-
gets and could thereby reach 12 points in the assessment
discussed in Section 2.3.1. We could not find the link from
p5 on the common promoter of the genes of p5 and p6.
However, after the organizers provided the true parame-
ters to the participants, we recognized that this link is dif-
ficult to detect due to the fact that for almost all
perturbations the concentration of p5 is clearly above the
Michaelis constant Kd = 17.9 of this missing link.
Discussion
In order to evaluate how well mechanistic models could
be built upon inferred biological networks, we tested the
accuracy of model parameter predictions and missing
link identification. Surprisingly, with a limited amount of
data, participants were able to reliably predict the value
of the parameters and temporal evolution of 3 proteins
under perturbed conditions in the parameter inference
challenge. Participants did not fare so well in the network
topology challenge; although 2 of the 3 links involved
were identified (Figure 4), none of the teams found more
than one correct link.
Aggregation of participant results
DREAM results for a diverse set of challenges have recur-
rently demonstrated the “wisdom of crowds” phenome-
non, where aggregation of participants’ results has proven
to give robust and top performing results [3,25,26]. The
network topology and parameter estimation challenge is
Meyer et al. BMC Systems Biology 2014, 8:13 Page 13 of 18
http://www.biomedcentral.com/1752-0509/8/13
14. very different in nature from other DREAM challenges,
not only because it is the first one to address the dynamics
of a bio-molecular network using a given biochemical
(mechanistic) model, but also because it uses a credit sys-
tem for participants to obtain in silico experimental data
in an iterative manner.
In spite of these original features, we have been able to
obtain, as in other DREAM challenges, a robust and high-
performing set of predictions based on the geometric
mean for the parameters and arithmetic mean for the pro-
tein predictions (Figure 3C, D). Geometric mean proved
an adequate approach to address the issue that parameter
values predicted by different teams could vary several or-
ders of magnitude. Notably, this aggregation method re-
sulted in several solutions with a reduced distance to the
parameter values (Figure 3D). It is not clear whether the
success of aggregating results is partially due to more data
sets being used, since each participant had access to po-
tentially different experimental data. Note, however, that
this is not equivalent to a single participant using the
combination of the data used by all participants.
For the network topology challenge, although only crux
had statistically significant results, the consensus 3 miss-
ing links obtained by majority voting to select the most
submitted links had a top performing score (Figure 4B, C).
Interestingly, only one of the three consensus links is cor-
rect (r12 Figure 4B), but the two others correctly implicate
genes 1, 7 and 11, although the direction and nature of
the regulatory link is incorrect. This proves how difficult it
is to differentiate between regulatory diagrams based
solely on limited experimental data and perturbations
(Figure 4D).
Participants’ methods and credit usage
The strategies for data acquisition were different for the
parameter inference and the network topology challenges.
As shown in the histograms of Figure 5, participants in
the first challenge used most of their credits to collect
fluorescent data from time-courses of two proteins. In
the second challenge participants equally used mass-
spectroscopy experiments and fluorescent protein time-
courses. The interpretation of such diverging strategies
can be illustrated from the sequence of data acquisitions
of the best performing teams (Figure 5B, D). For the first
challenge, orangeballs acquired microarray data to have
precise measurements on genes and then mainly used
fluorescent time-course-experiments to refine parameter
values. On the second challenge, crux first used credits
on wildtype fluorescence data, to cheaply obtain a set-
ting with qualitative disagreement between data and
model, and then used mass spectroscopy experiments
with perturbations to test for potential missing links.
Also, Table 2 suggests that best performing teams mostly
took a manual approach for credit usage; automatic
methods relying only on a numerical criterion seem not
to perform as well for these mechanistic models.
Conclusions
Our results show that from a defined gene network
model it is possible to accurately determine the kinetic
parameters of a gene regulatory circuit, given simple
fluorescent-based experimental data and an adequate in-
ference strategy. More generally, our results suggest that
state-of-the-art parameter estimation and experimental
design methods can in principle determine accurate pa-
rameters of biochemical models of gene regulation, but
the task is considerably more difficult or maybe impos-
sible to unequivocally solve if the knowledge of the top-
ology is not precise, as often is the case.
As they stand, this study and the underlying data and
models are a useful resource for those interested in devel-
oping parameter inference methods and to benchmark
them against state-of-the-art methods. This strategy could
be extended and tested on larger, genome size gene net-
works using whole-cell models [33], or alternatively,
laboratory-produced data on synthetic circuits could be
used instead of in silico data. Expanding these methods
may allow precise determination of kinetic reaction pa-
rameters in cases where direct experimental measure-
ments do not exist or are difficult to obtain.
Methods
Scoring the parameter estimation challenge
Distance between simulated and predicted values
For model 1, participants were requested to predict three
protein time courses from t0 = 0 to t = 20 seconds with a
sampling Δt = 0.5, for a total of N = 41 data points. We de-
note ti the time at data point i. The predicted and simu-
lated levels of protein k are denoted pk
pred
and pk
sim
(t) with
k = 3, 5, 8 as the proteins required to be predicted are p3, p5,
and p8 (see Figure 1B). These predictions were required for
an experiment where the network is perturbed simultan-
eously with a 10-fold decrease of r9kd, a 2-fold increase in
rbs3 strength and a 10-fold increase of rbs5 strength. These
proteins and perturbed states were chosen so that predic-
tions could not be trivially inferred from purchased data.
Because the initial conditions are given, the real challen-
ging predictions take place after some time has elapsed
from t0. We considered that time to be 10 intervals of
time and thus evaluated the predictions from the 11th
time
point onwards. Accordingly, the squared distance between
predicted and measured protein abundances for the model
we used is:
D1
prot
¼
1
3 N−11ð Þ
X3
k¼1
XN
i¼11
pk
pred
tið Þ−pk
sim
tið Þ
À Á2
σ2
b þ σ2
s pk
sim tið Þð Þ2À Á
Note that the squared difference terms are normalized
with the variance, and the variance follows the noise
Meyer et al. BMC Systems Biology 2014, 8:13 Page 14 of 18
http://www.biomedcentral.com/1752-0509/8/13
15. model that was implemented in the data provided (with
σb = 0.1 and σs = 0.2). The quantity σ2
s represents a
baseline, signal-independent, measurement noise, and σ2
s
represents a signal-dependent measurement noise.
Finally, the difference is divided by (3 * (N-11)) the
number of terms being added, to obtain a mean distance
value. The distance Dprot
1 was computed for each team.
To statistically evaluate the performance of the teams,
a relative null hypothesis was created from this distance,
based on the predictions of all the participants. For each
protein, we chose at random one of the 12 participant’s
predictions for the first time point pk
pred
(ti), then at ran-
dom one of the 12 predictions for the next time point,
and so on. We therefore obtained a value of Dprot
1 that
would correspond to one possible random choice of pre-
dictions amongst all the participants. Repeating this
process a large number of times, we generated a distri-
bution of squared distances, from which a p-value can
be estimated for Dprot
1 . That p-value will be denoted as
pprot
1 (see Additional file 3: Figure S1A).
Distance between estimated and known parameters
As degradation rates are equal for all proteins, only one
degradation parameter has to be determined and thus
model 1 has Np = 45 parameters to be considered for
scoring.
Let us denote as vi
pred
and vi
real
the predicted and ac-
tual parameter values used in the simulations, where i
runs between 1 and Np. The mismatch between esti-
mated and true parameters will be assessed on the log-
scale. In this way, a mismatch by a factor of x has the
same penalty independent of the parameter’s nominal
value and the ratio is also independent of physical unit
changes. Therefore the “distance” between predicted and
real parameters is calculated as follows:
Dparam
1 ¼
1
Np
XNp
i¼1
log
vpred
i
vreal
i
!!2
Similar to the case of the distance between simulated
and predicted protein abundances, a relative null hy-
pothesis is created from the distance between estimated
and known parameters based on the predictions of all
the participants. For each parameter, we chose at ran-
dom one of the 12 participant’s predictions for the par-
ameter. We therefore obtained a value of D that would
correspond to one possible random choice of predictions
amongst all the participants. By doing the same process
a large number of times, we generated a distribution of
distances between known and estimated parameters,
from which a p-value can be estimated for D1
param
. That
p-value will be denoted as p1
param
(see Additional file 3:
Figure S1B).
For each team the overall score Score1 combining both
parameters and protein values is defined as
Score1 ¼ − log p1
prot
⋅p1
param
ð Þ
Scoring the network topology inference challenge
Distance between the estimated and true network
For model 2 we requested the prediction of 3 missing links
of the network as shown in Additional file 2: Figure S2A.
Protein dynamics are different from Model 1 and in par-
ticular include oscillatory behavior (Figure 4A). In order to
facilitate the task of the participants, the possible universe
of links was reduced by a rule stating that (i) genes could
only establish a maximum of two regulating links and (ii)
a link could regulate up to two genes in the same operon.
Hence, six gene interactions had to be indicated by the
participants composed of three links regulating up to two
genes and also defining whether the gene regulation is ac-
tivating (+) or repressing (−).
For each of the three predicted links i = 1,2,3, we de-
fined a score si
link
that gives a value between 0 and 6 de-
pending on how well the link is captured: a perfect
prediction of the link is rewarded with 6 points, while
correctly predicting only the starting gene, the end gene,
or the sign of the effect, is given a lower score. Specific-
ally, the score is computed as
si
link
¼ Li þ Ni;
Where Li = 6 if one connection has all its elements cor-
rectly predicted (that is, the source gene, the sign of the
connection, and the destination gene are all correct). For
the special case that a link regulates an operon composed
of two genes and both connections are correct, reflecting
the correct prediction of two connections, a doubled
number of points Li = 12 was awarded. Otherwise, Li = 0
if some element of the connection is not fully correct. If Li
= 6 or 12 then Ni = 0 and the scoring for that link is
complete, with a final score si
link
of 6 or 12, respectively. In
case a link is not correctly predicted (Li = 0), Ni adds to
the score a value (less than 6) indicating how good the
prediction is. Each gene interaction is positive or negative
and composed of a source and a destination gene. Then,
Ni is increased by 1 for each correctly predicted gene, and
by 2 if the destination gene and the nature of the regula-
tion (i.e. +/−) are correct. Correct (+/−) predictions with-
out the correct associated genes are given no points. Some
examples of these scores are provided in the non-
exhaustive Additional file 5: Table S2.
The scores for the predictions of the three missing
links are added in a global score
snetwork
¼ s1
link
þ s2
link
þ s3
link
Meyer et al. BMC Systems Biology 2014, 8:13 Page 15 of 18
http://www.biomedcentral.com/1752-0509/8/13
16. A null model is calculated by generating a distribution
of scores from a large number of surrogate gene net-
works obtained by randomly adding 3 links that follow
the connection rules indicated in the challenge descrip-
tion. For each participant, a p2
netw
p-value associated with
the score under the null hypothesis is calculated (see
Additional file 2: Figure S2B), and then the final score
Score2 for this challenge is computed as
Score2 ¼ −log p2
netw
ð Þ
Dialogue for reverse engineering assessment and
methods 6 (DREAM6) 7 parameter estimation
consortium
We indicate D6 or D7 if teams participated only in
DREAM6 or DREAM7
team ALF D6
Alberto de la Fuente, Andrea Pinna, Nicola Soranzo.
CRS4 Bioinformatica c/o Parco Tecnologico della Sardegna,
Edificio 3 Loc. Piscina Manna 09010 Pula ITALY
team amis2011
Adel Mezine : 1 Artemis Llamosi : 1 3 (current ad-
dress : Université Paris Diderot, Sorbonne Paris Cité,
MSC, UMR 7057 CNRS, 75013, Paris, France) Véronique
Letort : 2 Arnaud Fouchet : 1 Michele Sebag : 3 Florence
d’Alché-Buc : 1 3
1 : IBISC EA 4526, Université d’Evry Val d’Essonne,
23 Bd de France, 91000, Evry, France,
2 : Ecole Centrale Paris, Laboratory of Applied Math-
ematics and Systems (MAS), F92295 Châtenay Malabry,
France,
3 : INRIA Saclay, LRI umr CNRS 8623, Université
Paris Sud, Orsay, France.
team BadgerNets D6
Devesh Bhimsaria, Parameswaran Ramanathan, Aseem
Ansari, Parmesh Ramanathan
Dept. of Electrical Computer Engineering Tel: (608)
2630557 University of Wisconsin, Madison Fax: (608)
2621267 Madison, WI 537061691
Team BIOMETRIS D7
Laura Astola, Jaap Molenaar, Maarten de Gee, Hans
Stigter, Dijk van Aalt-Ja, Simon van Mourik, Johannes
Kruisselbrink
Wageningen University Plant Sciences Subdivision
Mathematical and Statistical Methods, PO box 100
6700 AC Wageningen, Netherlands
team BioProcessEngi D6
Julio Banga, Eva Balsa Canto, Alejandro F Villaverde,
Oana Chis, y David Henriques.Bioprocess Engineering
Group Institute for Marine Research (IIMCSIC), R/
Eduardo Cabello, 6. Vigo 36208, Galiza, Spain
team COSBI D6
Paola Lecca
The Microsoft Research – University of Trento Centre
for Computational and Systems Biology. Piazza Manifattura
138068 Rovereto, Italy
current affiliation is Centre for Integrative Biology Uni-
versity of Trento Via delle Regole, 101,38123 Mattarello
(TN), Italy Email: paola.lecca@unitn.it
team Crux
Clemens Kreutz, Andreas Raue, Bernhard Steiert, Jens
Timmer
Freiburg Institute for Advanced Studies (FRIAS), Uni-
versity of Freiburg, Albertstr. 19, 79104 Freiburg, Germany
Institute of Bioinformatics and Systems Biology,
Helmholtz Center Munich, Ingolstaedter Landstr. 1, 85764
Neuherberg, Germany
Physics Department, University of Freiburg, Hermann
Herder Str. 3, 79104 Freiburg, Germany
team ForeC_in_HS D7
Julian Brandl, Thomas Draebing, Priyata Kalra, Ching
Chiek Koh, Jameson Poon, Dr. Sven Sahle, Dr. Frank
Bergmann, Dr. Kathrin Huebner, Prof. Dr. Ursula Kummer.
University of Heidelberg, Seminarstraße 2, 69117
Heidelberg, Germany
team GIANO6 D6
Gianna Toffolo, Federica Eduati and Barbara Di
Camillo
University of Padova Department of Information En-
gineering Via Gradenigo 6B 35131 Padova, ITALY
team ipk_sys D6
Syed Murtuza Baker, Kai Schallau, Hart Poskar, Bjorn
Junker, Swetlana Friedel. Data Inspection group and Sys-
tems Biology Group, Leibniz Institute of Plant Genetics
and Crop Plant Research.
team KroneckerGen D6
David R Hagen [1,2] and Bruce Tidor [1-3] drhagen@
mit.edu
1) Department of Biological Engineering, Massachusetts
Institute of Technology, Cambridge, MA, USA
2) Computer Science and Artificial Intelligence Labora-
tory, Massachusetts Institute of Technology, Cambridge,
MA, USA
3) Department of Computer Science and Electrical
Engineering, Massachusetts Institute of Technology,
Cambridge, MA, USA
Meyer et al. BMC Systems Biology 2014, 8:13 Page 16 of 18
http://www.biomedcentral.com/1752-0509/8/13
17. team 2pac
Cihan Oguz, Tyson Lab,
Departments of Biological Sciences Virginia Polytechnic
Institute State University Blacksburg, VA 24061 USA
team LBM D6
Michael Mekkonen, MIT
Lu Chen, WUSTL School of Medicine
Vipul Periwal, LBM, NIDDK, NIH
team ntu D7
Ching Chang1, Juo Yu Lee1, MeiJu May Chen2, YuYu
Lin3 and ChienYu Chen1,2
1 Department of BioIndustrial Mechatronics Engineer-
ing, National Taiwan University, Taipei, Taiwan;
2 Genome and Systems Biology Degree Program, Na-
tional Taiwan University and Academia Sinica, Taipei,
Taiwan;
3 Graduate Institute of Biomedical Electronics and Bio-
informatics, National Taiwan University, Taipei, Taiwan
team orangeballs
Po-Ru Loh, George Tucker, Mark Lipson, Bonnie
Berger
Department of Mathematics, MIT, Cambridge
Massachusetts
team Reinhardt
Christian Lajaunie, Edouard Pauwels, Jean Philippe
Vert
Centre for Computational Biology, Mines ParisTech,
Fontainebleau, F77300 France Institut Curie, Paris,
F75248, France U900, INSERM, Paris, F75248, France
team TBP D7
Orianne Mazemondet, Friedemann Uschner Katja
Tummler, Max Floettmann, Sebastian Thieme, Abel
Vertesy, Marvin Schultz, Till Scharp, Thomas Spiesser,
Marcus Krantz, Ulrike Mänzner, Magdalena Rother,
Matthias Reis, Katharina Albers, Wolfgang Giese and
Edda Klipp from Theoretical Biophysics Humboldt Uni-
versität zu Berlin
team thetasigmabeta
Juliane Liepe, Siobhan MacMahon, Paul Kirk, Sarah
Filippi, Christopher Barnes, Thomas Thorne, Michael
P.H. Stumpf Centre for Integrative Systems Biology and
Bioinformatics, Imperial College London London SW7
2AZ UK
team ZiBIOSS D6
Zhike Zi, BIOSS Centre for Biological Signalling Stud-
ies, University of Freiburg, Schaenzlestr. 18 s, 79104,
Freiburg, Germany
Additional files
Additional file 1: Supplementary material files– Models and
Submissions – model and data for challenge are provided as
supplementary material as well as participants’ submissions. Models
are provided in MATLAB and Systems Biology Markup Language (SBML
format) and the submissions name reflects the rank except for the best
performing teams. They are also available at the DREAM site (http://www.
the-dream-project.org/challenges/network-topology-and-parameter-
inference-challenge).
Additional file 2: Figure S2. Network topology challenge gene
network and scores A. Gene network for model 2 of 11 genes and 45
parameters where links r9, r10, r12 were missing and whose identity
challenge participants had to determine. B. A score is calculated based
on the 3 different links predicted and a p-value is calculated based on
the distribution of randomly generated links used as a null-hypothesis
(see main text).
Additional file 3: Figure S1. Score calculation of the Parameter
Estimation Challenge. A. A distance as shown by the equation is
calculated based on the 45 parameters predicted values and a p-value is
calculated when compared to a distribution of randomly generated rela-
tive null-hypothesis. B. A distance as shown by the equation is calculated
based on the predicted protein concentration value for p3, p5 and p8
and a p-value is calculated when compared to a distribution of randomly
generated relative null-hypothesis.
Additional file 4: Table S1. Summary of the experimental design
considerations of team crux for the network inference challenge. The
second column denotes the chosen experimental conditions in the
notation used during the challenge. The arguments underlying their
decisions are denoted by abbreviations. Wild-type measurements provide
data for substantially fewer credits (argument “WT”). Such measurements
have been chosen initially to obtain a setting with a reasonable set of
identifiable parameters. Data with high resolution over time (argument
“High-Res”) provides more detailed information about the dynamics and
was therefore expected to be more efficient for distinguishing potentially
missing links with similar qualitative effects. Using a measurement tech-
nique providing data for all compounds (argument “All”) is advantageous
to obtain a comprehensive overview of the effect of a perturbation. The
argument abbreviated by “Range” indicates the fact that missing links are
only identifiable, if the concentration range of the regulator is not far
from the respective Michaelis constant Kd. Therefore we performed per-
turbations affecting the concentration range of potential regulators in a
desired direction. Finally, we had to take into account the remaining
credits indicated by the argument “Budget”.
Additional file 5: Table S2. Table used to score the submitted links for
network topology challenge A link is defined by a source and a
destination gene, and a source gene may or may not have two
destination genes. Each row on the table represents a possible link
submission. Ni represents the number of points given for the submitted
link, where i stands for incorrect and c a correct prediction of the source
and destination gene. Note that correct (+/−) predictions without the
correct gene give no points.
Competing interests
The authors declare that they have no competing interests.
Authors’ contributions
DC, GS, HS, JRS, KHK, PM, TC designed the challenge, DC generated the data,
TC EB PM did the scoring of the challenge, PM JRS TC wrote the manuscript.
All authors read and approved the final manuscript.
Acknowledgments
We acknowledge the financial aid received from the EU through project
“BioPreDyn” (ECFP7-KBBE-2011-5 Grant number 289434). HS, KK and DC
acknowledge support from the National Institute of General Medical Science
of the National Institutes of Health under award number R01GM081070 NSF
support (0827592) in Theoretical Biology (MCB) and NSF support (1158573)
EF. Thanks to Michael Menden for useful comments on the manuscript and
the analysis. PL and GT acknowledge support from Defense NDSEG graduate
Meyer et al. BMC Systems Biology 2014, 8:13 Page 17 of 18
http://www.biomedcentral.com/1752-0509/8/13
18. fellowships. PL and ML acknowledge support from NSF graduate fellowships.
AR, BS, CK are funded by German Federal Ministry of Education and Research
[Virtual Liver (Grant No. 0315766) and LungSys II (Grant No. 0316042G)].
Author details
1
T.J. Watson Research Center, Yorktown Heights, New York, USA. 2
European
Molecular Biology Laboratory, European Bioinformatics Institute, Cambridge,
UK. 3
Autodesk Research, San Francisco, CA, USA. 4
Department of
Bioengineering, University of Washington, William H. Foege Building, Box
355061, Seattle, WA 98195-5061, USA. 5
Department of Mathematics, MIT,
Cambridge, Massachusetts, USA. 6
BIOSS Centre for Biological Signalling
Studies, University of Freiburg, Schänzlestr. 18, 79104 Freiburg, Germany.
7
Merrimack Pharmaceuticals One Kendall Square, Suite B7201, Cambridge,
MA 02139, USA. 8
Physics Department, University of Freiburg,
Hermann-Herder Str.3, 79104 Freiburg, Germany.
Received: 17 September 2013 Accepted: 23 December 2013
Published: 7 February 2014
References
1. De Smet R, Marchal K: Advantages and limitations of current network
inference methods. Nat Rev Microbiol 2010, 8(10):717–29.
2. Marbach D, et al: Revealing strengths and weaknesses of methods for
gene network inference. Proc Natl Acad Sci U S A 2010, 107(14):6286–91.
3. Prill RJ, et al: Crowdsourcing network inference: the DREAM predictive
signaling network challenge. Sci Signal 2011, 4(189):mr7.
4. Banga JR: Optimization in computational systems biology. BMC Syst Biol
2008, 2:47.
5. Fernandez Slezak D, et al: When the optimal is not the best: parameter
estimation in complex biological models. PLoS One 2010, 5(10):e13283.
6. Sun J, Garibaldi JM, Hodgman C: Parameter Estimation Using Meta-Heuristics
in Systems Biology: A Comprehensive Review. IEEE/ACM Trans Comput Biol
Bioinform; 2011.
7. Ashyraliyev M, Jaeger J, Blom JG: Parameter estimation and
determinability analysis applied to Drosophila gap gene circuits.
BMC Syst Biol 2008, 2:83.
8. van Riel NA: Dynamic modelling and analysis of biochemical networks:
mechanism-based models and model-based experiments. Brief Bioinform
2006, 7(4):364–74.
9. Kreutz C, Timmer J: Systems biology: experimental design. FEBS J 2009,
276(4):923–42.
10. Kun Deng YZ, Chris B, Stephen S, Julie M: New algorithms for budgeted
learning. Mach Learn 2013, 90:59–90.
11. Danino T, et al: A synchronized quorum of genetic clocks. Nature 2010,
463(7279):326–30.
12. Elowitz MB, et al: Stochastic gene expression in a single cell. Science 2002,
297(5584):1183–6.
13. Locke JC, et al: Stochastic pulse regulation in bacterial stress response.
Science 2011, 334(6054):366–9.
14. Meyer P, Dworkin J: Applications of fluorescence microscopy to single
bacterial cells. Res Microbiol 2007, 158(3):187–94.
15. Moon TS, et al: Genetic programs constructed from layered logic gates in
single cells. Nature 2012, 491(7423):249–53.
16. Muzzey D, van Oudenaarden A: Quantitative time-lapse fluorescence
microscopy in single cells. Annu Rev Cell Dev Biol 2009, 25:301–27.
17. Suel G: Use of fluorescence microscopy to analyze genetic circuit
dynamics. Methods Enzymol 2011, 497:275–93.
18. Suel GM, et al: An excitable gene regulatory circuit induces transient
cellular differentiation. Nature 2006, 440(7083):545–50.
19. Sabido E, Selevsek N, Aebersold R: Mass spectrometry-based proteomics
for systems biology. Curr Opin Biotechnol 2012, 23(4):591–7.
20. Eydgahi H, et al: Properties of cell death models calibrated and
compared using Bayesian approaches. Mol Syst Biol 2013, 9:644.
21. Liepe J, et al: Maximizing the information content of experiments in
systems biology. PLoS Comput Biol 2013, 9(1):e1002888.
22. Chandran D, Bergmann FT, Sauro HM: TinkerCell: modular CAD tool for
synthetic biology. J Biol Eng 2009, 3:19.
23. Sauro HS, Rohwer J, Snoep M, Hofmeyr JL: JARNAC: a system for
interactive metabolic analysis. In Animating the Cellular Map In Proceedings
of the 9th International BioThermoKinetics Meeting. Stellenbosch University
Press; 2000:221–228.
24. Drummond DA, Wilke CO: Mistranslation-induced protein misfolding as a
dominant constraint on coding-sequence. Evolution 2008, 134(2):341–352.
25. Marbach D, et al: Wisdom of crowds for robust gene network inference.
Nat Methods 2012, 9(8):796–804.
26. Prill RJ, et al: Towards a rigorous assessment of systems biology models:
the DREAM3 challenges. PLoS One 2010, 5(2):e9202.
27. Hindmarsh AC, et al: SUNDIALS: Suite of nonlinear and differential/
algebraic equation solvers. ACM Trans Math Softw 2005, 31:363–396.
28. Lohmann TBH, Schlöder J: Numerical methods for parameter estimation
and optimal experimental design in chemical reaction system. Ind Eng
Chem Res 1992, 31:54–57.
29. Press WFB, Saul S, Vetterling W: Numerical recipes. Cambridge University
Press; 1992.
30. McKay MD, Beckman RJC: W. J., A comparison of three methods for
selecting values of input variables in the analysis of output from a
computer CodeTechnometrics. Am Stat Assoc Am Soc Qual 1979, 21:239–245.
31. Raue A, Becker V, Klingmüller UT: Identifiability and observability analysis
for experimental design in Non-linear dynamical models. Chaos 2010,
20(4):45105.
32. Steiert B, et al: Experimental design for parameter estimation of gene
regulatory networks. PLoS One 2012, 7(7):e40052.
33. Karr JR, et al: A whole-cell computational model predicts phenotype from
genotype. Cell 2012, 150(2):389–401.
doi:10.1186/1752-0509-8-13
Cite this article as: Meyer et al.: Network topology and parameter
estimation: from experimental design methods to gene regulatory
network kinetics using a community based approach. BMC Systems
Biology 2014 8:13.
Submit your next manuscript to BioMed Central
and take full advantage of:
• Convenient online submission
• Thorough peer review
• No space constraints or color figure charges
• Immediate publication on acceptance
• Inclusion in PubMed, CAS, Scopus and Google Scholar
• Research which is freely available for redistribution
Submit your manuscript at
www.biomedcentral.com/submit
Meyer et al. BMC Systems Biology 2014, 8:13 Page 18 of 18
http://www.biomedcentral.com/1752-0509/8/13
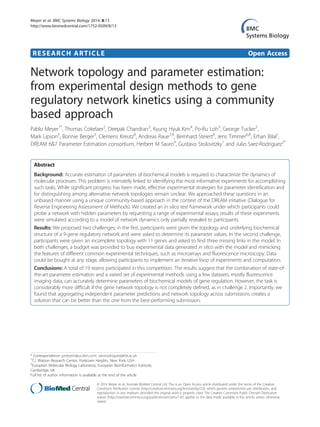
![Background
Predictive and mechanistic models are powerful tools to
understand biological processes at the core of systems
biology. Building models requires a list of molecular
components and their interactions. This list can be as-
sembled from prior knowledge and/or inferred, or re-
verse engineered, from dedicated experimental data
[1-3]. This can be done using a simple causal formalism
or, if enough mechanistic detail is available, by writing
down the corresponding biochemical reactions. In both
cases, once a reasonably well-characterized set of com-
ponents and interactions is determined, these can be
converted into a mathematical model. A common and
natural way to model biochemical reactions is to derive
a dynamical system, typically in the form of ordinary dif-
ferential equations. These equations include associated
parameters that quantify the underlying physicochemical
processes such as protein binding and enzyme activity.
The value of these parameters is often not available or
even measurable, and needs to be estimated from experi-
mental data [4-6]. An accurate estimation of the param-
eters is fundamental to quantitatively understand a
system and provide reliable predictions [7,8].
In a real-life scenario of limited resources, the key ques-
tion is how to design experiments that are most useful for
parameter characterization [9], a decision process involv-
ing many variables. This problem falls in the category of
budgeted learning formalized in the field of machine
learning [10]. The first question raised is related to the ex-
perimental conditions that should be considered. When
possible, data is collected upon application of perturba-
tions to the network such as stimulation with extracellular
ligands, chemical inhibition or gene over-expression.
Moreover, data can be collected at different times after
perturbation to provide information on the temporal evo-
lution of the system. It is hence necessary to determine
the identity and number of perturbations and whether to
generate data from individual or combined perturbations.
The next decision is related to the choice among a battery
of technologies available to perform the measurements.
These normally entail a trade-off between coverage, cost,
and precision. For example, one can track over time the
levels of a few proteins in single cells using GFP (Green
Fluorescence Protein) tags and movies [11-18], or measure
thousands of proteins in a few time-points with mass
spectrometry [19]. How to choose among all these options
is not obvious and, despite the critical importance of these
questions, the problem of parameter estimation and itera-
tive experimental design remains one of the hardest chal-
lenges in systems biology [4-6,9,20,21].
To explore this fundamental problem in a rational and
unbiased fashion, we first set up the parameter estimation
challenge, where we tried to reproduce the common set-
ting in which an experimental laboratory uses instruments,
expertise and an allocated budget (e.g. from a grant) to
apply various experimental techniques to investigate a bio-
logical model system. To mimic this scenario, we built the
model of a regulatory network for 9 genes based on differ-
ential equations describing the underlying molecular biol-
ogy, including transcription and translation. We chose a
model configuration that can generate non-trivial dynamic
behavior. We then generated data with this model that in-
cluded experimental noise and asked participants to find
the model’s parameters. Each participant was given a
budget of ‘credits’ that could be used to buy different ex-
periments that reflected trade-offs between coverage, cost
and resolution. We provided participants only the model
structure and challenged them to estimate the hidden par-
ameter values. Given that the true values of the hidden pa-
rameters were known, we could precisely assess the
performance of the methods used by the 12 different
teams that participated in the challenge. Remarkably, des-
pite the complexity of the network and the limited data re-
sources, some teams obtained highly accurate parameter
values.
Besides the question of the algorithmic/experimental
strategy used to infer the kinetic parameters of a model,
we also addressed how well new connections in a net-
work could be inferred. This is also a relevant question,
as many canonical pathways are only approximations to
the system under study. We therefore ran a second chal-
lenge, the network topology inference challenge, where
participants were given an incomplete topology with 11
genes and asked to find 3 missing links in the model.
This challenge was only partially solved, suggesting that
inferring topology is a much harder challenge than par-
ameter estimation. Finally, we observed that aggregating
the participants’ parameter predictions and network top-
ology submissions provided potentially better solutions
than individual participants.
We complemented the analysis of the submissions by
analyzing the participants’ algorithmic strategies and
credit usage for data acquisition. We concluded that
using fluorescent data from protein time courses is a key
component of parameter estimation strategies, and that
in both challenges aggregation created solutions that
fared as well or better than the best performing ap-
proaches. We chose an in silico challenge framework in
order to have a well-defined gold standard for evaluating
submissions, but we believe the setup of this work emu-
lates the experimental design choices faced by real la-
boratories, and thus the insights gained here provide
insights for real experimental design when trying to de-
termine the parameters of a gene regulatory network.
Results
In both the network topology and parameter inference
challenges, participants were asked to develop and/or
Meyer et al. BMC Systems Biology 2014, 8:13 Page 2 of 18
http://www.biomedcentral.com/1752-0509/8/13](data:image/gif;base64,R0lGODlhAQABAIAAAAAAAP///yH5BAEAAAAALAAAAAABAAEAAAIBRAA7)