Workforce Management For Call Center Powerpoint Presentation Slides
Senior Management Service Desk Report Sample
1. Senior Management Report – January 2015 Page 1
EUS Service Desk
*Several formatting errors have been introduced due to the need to
redact PII data and cleanse this report for use as a general sample of my
work.
A monthly review of the activities, metrics and value provided by the EUS Service
Desk to XXXXX
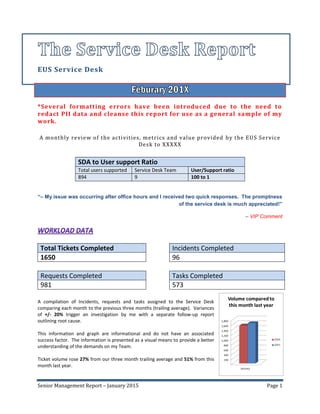
SDA to User support Ratio
Total users supported Service Desk Team User/Support ratio
894 9 100 to 1
“– My issue was occurring after office hours and I received two quick responses. The promptness
of the service desk is much appreciated!”
– VIP Comment
Total Tickets Completed
1650
Incidents Completed
96
Requests Completed
981
Tasks Completed
573
A compilation of Incidents, requests and tasks assigned to the Service Desk
comparing each month to the previous three months (trailing average). Variances
of +/- 20% trigger an investigation by me with a separate follow-up report
outlining root cause.
This information and graph are informational and do not have an associated
success factor. The information is presented as a visual means to provide a better
understanding of the demands on my Team.
Ticket volume rose 27% from our three month trailing average and 51% from this
month last year.
2. Senior Management Report – January 2015 Page 2
Why such a dramatic increase? One factor involves how we report data in 201X. In past years we have used
“Report Date” to pull monthly data so that anything with a report date for the month being reported on will be
included in the report. The issue with this is that if we report on the number of tickets closed in that month, it will
only show those tickets reported that month that were closed, not the tickets from last month that were closed,
nor the tickets that were opened this month but not closed during the month. The tickets that were opened one
month and closed another were never represented in any report as part of our actual workload. In 201X that
resulted in 1,233 tickets that were never reported, a staggering 10% of our total volume.
The work of the HRT (Hardware Resource Technicians) Team also added a considerable sum to the ticket load as
they have been refreshing hardware at an accelerated pace. The preliminary work needed to clean up the asset
data for the Remedy Asset module has also added new tickets in January.
Remedy breaks up the work into three classes, Incidents, Requests and Tasks.
The percentage of each of these classes to the whole speaks to how IT is progressing in various areas. It can be
seen in the above graph that while Incidents trend downwards, Requests and Tasks are on an upward climb. This
shows that we are maturing in our use of the Remedy Ticketing product and are properly grouping tickets
proactively and according to the needs of the business. No longer do we fill out multiple tickets to process a
transfer or move, but one ticket with multiple tasks, eliminating the human error and giving other teams more
time to complete the scheduled work.
The steady decline in incidents (unplanned reductions in an IT service) continued this month with a sharp
reduction of 40% from our trailing average. This trend could be the result of better training of the Service Desk in
proper categorization of tickets as well as a more stable infrastructure.
The Week in Work
We collect the data on daily and weekly workload in order to better
staff and plan for project related activities such as inventory and new
service transitions. This month shows the first major change seen in
quite some time as Friday (our typically lightest day) rose 80% (114
tickets) over our trailing average. Again, there is no success factor
with this data, but it does factor into our planning. General consensus
is that this report has given us a confidence factor not seen in the past
and has allowed us to schedule so many more project related tasks to
Friday that we flooded the timeslot and will now need to back off,
spreading work more evenly over the week.
3. Senior Management Report – January 2015 Page 3
Work Days this period
20
Man-Hours Available
1440
Resolved Tickets per Man-Hour
1.32
Productivity lost
13% (PTO)
For our team a 10% loss in productivity in a given month represents one FTE. This loss is built into our planning
and is expected as part of the generous leave policy at the XXXXX. The data presented here is a reminder that, by
design our team is always producing at the reduced level of a team with one less member and all estimates for
staffing and scheduling must consider this.
The Service Desk work force (previously diversity) changed due to the onboarding of an SDA working out of the
XXXX office. This hire successfully completed the contract to hire term with excellent results and is an outstanding
addition to my team.
With a 6% return rate and 66 unique results, the
Service Desk received very positive responses.
Even so, we missed all targets by 3%.
January saw the first efforts of the Service Desks
Survey Response Team. This team has one
function; QA of all survey scores below the median.
This month we investigated the following.
(14907) Reports an “unresolved” printer issue that
continually deletes his printer mapping. Follow up
needed.
(14911) When she approached an SDA she was
told “I don’t do walk ups” as the SDA walked away.
Counseling session held with SDA, apologies
provided.
4. Senior Management Report – January 2015 Page 4
All increases are in line with the increased ticket load for the month. The 57% increase in Service Desk Initiated
tickets adds weight to the finding of the investigation on overall volume reported earlier in this document.
Email Support
Weekends and Holidays removed for clarity.
The service impact of the email load is often overlooked, but plays as large a part as our telephonic duties, carrying
its own associated SLA’s.
5. Senior Management Report – January 2015 Page 5
Of the two largest catagories; Hardware and Software,
this month will focus on Software related requests,
representing 38% of the total.
The Software requests are further broken down into
several catagories with Client representing the largest
total of 161 tickets.
The Client category contains the COTS (Comercial Off The Shelve) titles
in use at the XXXXX. In January the top COTS products reported to
Remedy were Microsoft Office Outlook (58 tickets) and XXXX Client
(34). I was unable to find any useful information to allow error
correction or trending going forward, but did identifiy ways to correct some issues in the category structure that will allow us to
get more granular in the future, giving us a better insight into the types of issues being reported without hours of data mining.
Laptop related tickets
The computer category is largely due the efforts of the HRT Team and our ongoing refresh efforts with 79 of the total being
Latitude E4310 refreshes. The total eradication of all Dells from normal enterprise usage by April 1st is our goal.
6. Senior Management Report – January 2015 Page 6
VTC Setups jumped from an average of 20 to 47 in January a 141% increase, with Meeting Services overall showing a 96%
increase in requests.
A comprehensive process improvement report focused on Meeting Services involving multiple teams and months of work was
submitted for review in this month.
SLA Priority Data on Incidents Reported
Severity 1
Critical
Severity 2
High
Severity 3
Medium
Severity 4
Low
Total
Count 0 0 63 37 100
Avg. Resolve Time (HRs) 0 0 64 28 50
SLA Success - - 83% 79% 82%
Code Condition SLA Completion Target / Conditions
Severity 1 Critical 4 hours / Must relate to a direct board member to apply
Severity 2 High 8 hours / Enterprise-wide system outage
Severity 3 Medium 36 hours / Department outage or upgrade
Severity 4 Low 40 hours / Work-around available / no work stoppage
Every Incident has two Service Level Measurements, Response Time and Resolution Time. Each Severity level has unique
success factors that match the severity of the incident for each of the two measurements. The data above is a simplification of
January-15
Starting
Count Completed Remaining
%
Complete Target Target Met?
Mobile Device Replacement 4 year Refresh Cycle 25 13 12 52% Completion of this phase No
Mobile Device Replacement Project Phase II 240 3 237 1% Have not started N/A
Monitor Replacement Phase II (DEI) 47 0 47 0% On Hold for Nirav N/A
Laptop Refresh 4 year Refresh Cycle 283 53 230 19% 25 per week (3/16/15) No
Universal Docking Station Deployment 30 0 30 0% On Hold for Build fix N/A
iPad Deployment On hold for Nirav N/A
TOTAL DEVICES 625 69 556 11%
7. Senior Management Report – January 2015 Page 7
our general success against these two targets. A misconfiguration in Remedy has also been identified that negatively effects
our SLA ratings. Once this configuration has been corrected, it is expected that our SLA targets will go up.
8. Senior Management Report – January 2015 Page 8
Larry Davis | Service Desk Manager, End User Services |
Information Technology