Solution Manual for Financial Accounting, 11th Edition by Robert Libby, Patri...
Keynote technicals daily report for 151211
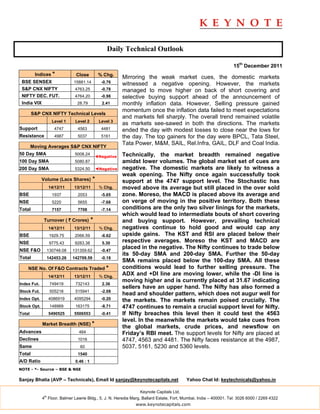
1. Daily Technical Outlook
15th December 2011
Indices * Close % Chg.
Mirroring the weak market cues, the domestic markets
BSE SENSEX 15881.14 -0.76 witnessed a negative opening. However, the markets
S&P CNX NIFTY 4763.25 -0.78 managed to move higher on back of short covering and
NIFTY DEC. FUT. 4764.20 -0.98 selective buying support ahead of the announcement of
India VIX 28.79 2.41 monthly inflation data. However, Selling pressure gained
momentum once the inflation data failed to meet expectations
S&P CNX NIFTY Technical Levels
and markets fell sharply. The overall trend remained volatile
Level 1 Level 2 Level 3
as markets see-sawed in both the directions. The markets
Support 4747 4563 4481 ended the day with modest losses to close near the lows for
Resistance 4987 5037 5161 the day. The top gainers for the day were BPCL, Tata Steel,
Tata Power, M&M, SAIL, Rel.Infra, GAIL, DLF and Coal India.
Moving Averages S&P CNX NIFTY
50 Day SMA 5008.24 Technically, the market breadth remained negative
◄Negative
100 Day SMA 5080.87 amidst lower volumes. The global market set of cues are
200 Day SMA 5324.50 ◄Negative negative. The domestic markets are likely to witness a
weak opening. The Nifty once again successfully took
Volume (Lacs Shares) * support at the 4747 support level. The Stochastic has
14/12/11 13/12/11 % Chg. moved above its average but still placed in the over sold
BSE 1937 2053 -5.65 zone. Moreso, the MACD is placed above its average and
NSE 5220 5655 -7.68 on verge of moving in the positive territory. Both these
Total 7157 7708 -7.14 conditions are the only two silver linings for the markets,
which would lead to intermediate bouts of short covering
Turnover ( ` Crores) * and buying support. However, prevailing technical
14/12/11 13/12/11 % Chg. negatives continue to hold good and would cap any
BSE 1929.75 2066.59 -6.62 upside gains. The KST and RSI are placed below their
NSE 9775.43 9283.38 5.30 respective averages. Moreso the KST and MACD are
NSE F&O 130748.08 131359.62 -0.47
placed in the negative. The Nifty continues to trade below
its 50-day SMA and 200-day SMA. Further the 50-day
Total 142453.26 142709.59 -0.18
SMA remains placed below the 100-day SMA. All these
NSE No. Of F&O Contracts Traded * conditions would lead to further selling pressure. The
14/12/11 13/12/11 % Chg.
ADX and +DI line are moving lower, while the -DI line is
moving higher and is currently placed at 31.67 indicating
Index Fut. 749419 732143 2.36
sellers have an upper hand. The Nifty has also formed a
Stock Fut. 505218 515941 -2.08
head and shoulder pattern, which does not augur well for
Index Opt. 4086919 4095294 -0.20 the markets. The markets remain poised crucially. The
Stock Opt. 148969 163175 -8.71 4747 continues to remain a crucial support level for Nifty.
Total 5490525 5506553 -0.41 If Nifty breaches this level then it could test the 4563
level. In the meanwhile the markets would take cues from
Market Breadth (NSE) *
the global markets, crude prices, and newsflow on
Advances 464 Friday’s RBI meet. The support levels for Nifty are placed at
Declines 1016 4747, 4563 and 4481. The Nifty faces resistance at the 4987,
Same 60 5037, 5161, 5230 and 5360 levels.
Total 1540
A/D Ratio 0.46 : 1
NOTE - *- Source – BSE & NSE
Sanjay Bhatia (AVP – Technicals), Email Id sanjay@keynotecapitals.net Yahoo Chat Id: keytechnicals@yahoo.in
Keynote Capitals Ltd.
th
4 Floor, Balmer Lawrie Bldg., 5, J. N. Heredia Marg, Ballard Estate, Fort, Mumbai, India – 400001. Tel: 3026 6000 / 2269 4322
www.keynotecapitals.com
2. Short Term Trading Ideas Based On Technical Analysis (5 - 7 Days)
Stop
Initiation Stop Loss Target
Stock Close Action Price Loss * (%) Target (%) Remarks
TGT of 35.25
Achieved
given Sell @
39.50 on
Balrampur Chini 37.55 Sell Below 37.00 39.25 6.08 32.00 13.51 14/12/11
Chambal Fert. 79.05 Sell Below 78.50 80.55 2.61 74.00 5.73
DLF 200.80 Sell Below 199.00 210.00 5.53 175.00 12.06
* Stop Losses are to be considered strictly on Closing basis.
Intra-day Resistance Intra-day Support
Indices Close Pivot Point R1 R2 R3 S1 S2 S3
BSE SENSEX 15881 15957 16058 16235 16513 15780 15678 15400
S&P CNX NIFTY 4763 4784 4818 4874 4963 4729 4695 4606
NIFTY DEC. FUT. 4764 4788 4824 4885 4982 4728 4691 4594
Keynote Capitals Ltd.
th
4 Floor, Balmer Lawrie Bldg., 5, J. N. Heredia Marg, Ballard Estate, Fort, Mumbai, India – 400001. Tel: 3026 6000 / 2269 4322
www.keynotecapitals.com
3. Disclaimer
This document is not for public distribution and has been furnished to you solely for your information and must not be reproduced or
redistributed to any other person. Persons into whose possession this document may come are required to observe these restrictions.
This material is for the personal information of the authorized recipient, and we are not soliciting any action based upon it. This report
is not to be construed as an offer to sell or the solicitation of an offer to buy any security in any jurisdiction where such an offer or
solicitation would be illegal. It is for the general information of clients of Keynote Capitals Ltd. It does not constitute a personal
recommendation or take into account the particular investment objectives, financial situations, or needs of individual clients.
We have reviewed the report, and in so far as it includes current or historical information, it is believed to be reliable though its
accuracy or completeness cannot be guaranteed. Neither Keynote Capitals Ltd., nor any person connected with it, accepts any liability
arising from the use of this document. The recipients of this material should rely on their own investigations and take their own
professional advice. Price and value of the investments referred to in this material may go up or down. Past performance is not a guide
for future performance. Certain transactions -including those involving futures, options and other derivatives as well as non-investment
grade securities - involve substantial risk and are not suitable for all investors. Reports based on technical analysis centers on studying
charts of a stock’s price movement and trading volume, as opposed to focusing on a company’s fundamentals and as such, may not
match with a report on a company’s fundamentals.
Opinions expressed are our current opinions as of the date appearing on this material only. While we endeavor to update on a
reasonable basis the information discussed in this material, there may be regulatory, compliance, or other reasons that prevent us
from doing so. Prospective investors and others are cautioned that any forward-looking statements are not predictions and may be
subject to change without notice. Our proprietary trading and investment businesses may make investment decisions that are
inconsistent with the recommendations expressed herein.
We and our affiliates, officers, directors, and employees world wide may: (a) from time to time, have long or short positions in, and buy
or sell the securities thereof, of company (ies) mentioned herein or (b) be engaged in any other transaction involving such securities
and earn brokerage or other compensation or act as a market maker in the financial instruments of the company (ies) discussed herein
or act as advisor or lender / borrower to such company (ies) or have other potential conflict of interest with respect to any
recommendation and related information and opinions.
The analyst for this report certifies that all of the views expressed in this report accurately reflect his or her personal views about the
subject company or companies and its or their securities, and no part of his or her compensation was, is or will be, directly or indirectly
related to specific recommendations or views expressed in this report.
No part of this material may be duplicated in any form and/or redistributed without Keynote Capitals Ltd’s., prior written consent.
Keynote Capitals Ltd.
th
4 Floor, Balmer Lawrie Bldg., 5, J. N. Heredia Marg, Ballard Estate, Fort, Mumbai, India – 400001. Tel: 3026 6000 / 2269 4322
www.keynotecapitals.com