
Recommended
Recommended
More Related Content
What's hot
What's hot (18)
Similar to Rebgv stats-pkg-december-2018
Similar to Rebgv stats-pkg-december-2018 (20)
More from Kathryn Huang
More from Kathryn Huang (14)
Recently uploaded
Recently uploaded (20)
Rebgv stats-pkg-december-2018
- 1. News Release FOR IMMEDIATE RELEASE: Metro Vancouver home sales decline below historical averages in 2018 VANCOUVER, BC – January 3, 2019 –Metro Vancouver* home sales in 2018 were the lowest annual total in the region since 2000. The Real Estate Board of Greater Vancouver (REBGV) reports that sales of detached, attached and apartment properties reached 24,619 on the Multiple Listing Service® (MLS®) in 2018, a 31.6 per cent decrease from the 35,993 sales recorded in 2017, and a 38.4 per cent decrease compared to the 39,943 residential sales in 2016. Last year’s sales total was 25 per cent below the region’s 10-year sales average. “This past year has been a transition period for the Metro Vancouver housing market away from the sellers’ market conditions we experienced in previous years,” Phil Moore, REBGV president said. “High home prices, rising interest rates and new mortgage requirements and taxes all contributed to the market conditions we saw in 2018.” Home listings in Metro Vancouver reached 53,614 in 2018. This is a 1.9 per cent decrease compared to 54,655 homes listed in 2017 and a 6.9 per cent decrease compared to the 57,596 homes listed in 2016. “The supply of homes for sale will be an important indicator to follow in 2019. We’ve had record building activity in recent years and many projects will complete soon. This will provide additional housing options for home buyers across the region,” Moore said. The MLS® HPI composite benchmark price for all residential homes in Metro Vancouver ends the year at $1,032,400. This is a 2.7 per cent decrease compared to December 2017. “As the total supply of homes for sale began to accumulate in the spring, we began to see downward pressure on prices across all home types throughout the latter half of the year,” Moore said. The benchmark price of detached homes in the region declined 7.8 per cent over the last 12 months and 7.3 per cent since June 2018. Apartment homes increased 0.6 per cent over the last 12 months and have declined 6.4 per cent since June 2018. The benchmark price for townhomes in Metro Vancouver have increased 1.3 per cent since December 2017 and have decreased 5.3 per cent over the last six months.
- 2. December summary REBGV reports that residential home sales in the region totalled 1,072 in December 2018, a 46.8 per cent decrease from the 2,016 sales recorded in December 2017, and a 33.3 per cent decrease from November 2018 when 1,608 homes sold. Last month’s sales were 43.3 per cent below the 10-year December sales average. There were 1,407 detached, attached and apartment homes newly listed for sale on the MLS® in Metro Vancouver in December 2018. This represents a 25.6 per cent decrease compared to the 1,891 homes listed in December 2017 and a 59.3 per cent decrease compared to November 2018 when 3,461 homes were listed. The total number of homes currently listed for sale on the MLS® system in Metro Vancouver is 10,275, a 47.7 per cent increase compared to December 2017 (6,958) and a 16.5 per cent decrease compared to November 2018 (12,307). For all property types, the sales-to-active listings ratio for December 2018 is 10.4 per cent. By property type, the ratio is 7.1 per cent for detached homes, 12 per cent for townhomes, and 14.2 per cent for apartments. Generally, analysts say that downward pressure on home prices occurs when the ratio dips below the 12 per cent mark for a sustained period, while home prices often experience upward pressure when it surpasses 20 per cent over several months. Sales of detached homes in December 2018 reached 348, a 43.6 per cent decrease from the 617 detached sales recorded in December 2017. The benchmark price for a detached home is $1,479,000. This represents a 7.8 per cent decrease from December 2017 and a 1.4 per cent decrease compared to November 2018. Sales of apartment homes reached 535 in December 2018, a 34 per cent decrease compared to the 1,028 sales in December 2017. The benchmark price of an apartment home is $664,100. This represents a 0.6 per cent increase from December 2017 and a 0.6 per cent decrease compared to November 2018. Attached home sales in December 2018 totalled 189, a 49.1 per cent decrease compared to the 371 sales in December 2017. The benchmark price of an attached home is $809,700. This represents a 1.3 per cent increase from December 2017 and a 1.1 per cent decrease compared to November 2018. -30- *Editor’s Note: Areas covered by the Real Estate Board of Greater Vancouver include: Whistler, Sunshine Coast, Squamish, West Vancouver, North Vancouver, Vancouver, Burnaby, New Westminster, Richmond, Port Moody, Port Coquitlam, Coquitlam, Pitt Meadows, Maple Ridge, and South Delta. The Real Estate Board of Greater Vancouver is an association representing more than 14,000 REALTORS® and their companies. The Board provides a variety of member services, including the Multiple Listing Service®. For
- 3. more information on real estate, statistics, and buying or selling a home, contact a local REALTOR® or visit www.rebgv.org. For more information please contact: Craig Munn Manager, Communication Real Estate Board of Greater Vancouver 604.730.3146 cmunn@rebgv.org
- 4. Property Type Area Benchmark Price Price Index 1 Month Change % 3 Month Change % 6 Month Change % 1 Year Change % 3 Year Change % 5 Year Change % 10 Year Change % Residential / Composite Lower Mainland $969,700 266.2 -0.9% -3.4% -6.3% -0.9% 40.2% 73.1% 100.9% Greater Vancouver $1,032,400 267.3 -0.9% -3.6% -6.5% -2.7% 33.3% 68.0% 102.5% Bowen Island $1,001,800 217.2 2.0% 2.8% -3.0% 5.0% 56.0% 78.9% 79.1% Burnaby East $968,800 268.7 -1.0% -3.7% -7.8% -2.1% 35.9% 67.4% 104.0% Burnaby North $890,500 268.9 -1.9% -4.1% -5.9% -1.6% 40.7% 71.4% 103.6% Burnaby South $992,700 280.4 -1.1% -3.0% -7.3% -1.6% 40.9% 72.4% 109.7% Coquitlam $920,700 273.1 -0.8% -4.1% -6.5% -0.5% 42.3% 81.2% 108.8% Ladner $851,100 238.9 0.5% -3.4% -2.5% -2.8% 21.1% 60.8% 81.1% Maple Ridge $767,500 244.4 -0.1% -2.9% -5.7% 2.2% 59.6% 85.7% 90.5% New Westminster $678,700 298.2 -1.3% -2.0% -4.9% 4.2% 59.3% 86.4% 117.3% North Vancouver $1,035,700 236.1 -1.5% -4.4% -7.4% -3.7% 26.1% 60.5% 89.2% Pitt Meadows $762,500 277.2 0.3% -2.5% -5.4% 4.8% 65.5% 93.6% 114.1% Port Coquitlam $750,800 257.0 -1.3% -2.8% -7.7% -0.7% 46.6% 77.4% 92.8% Port Moody $921,800 254.8 -2.1% -3.8% -7.3% -0.2% 41.9% 80.3% 94.2% Richmond $989,900 285.2 -0.1% -4.0% -5.3% -2.8% 34.1% 70.0% 109.9% Squamish $750,300 235.5 -2.3% -4.0% -8.7% -2.4% 52.0% 93.8% 79.1% Sunshine Coast $620,500 217.4 1.5% 2.8% -1.6% 6.4% 57.5% 82.2% 73.2% Tsawwassen $966,400 242.7 -0.7% -4.9% -4.1% -4.4% 21.0% 65.3% 91.3% Vancouver East $1,039,200 304.3 -1.6% -5.1% -6.5% -4.6% 28.8% 67.9% 120.2% Vancouver West $1,272,900 268.4 -0.6% -2.7% -7.2% -5.8% 21.8% 57.4% 105.4% West Vancouver $2,287,300 245.9 -3.0% -4.6% -10.0% -12.2% 6.4% 41.3% 104.7% Whistler $897,200 194.3 -2.2% -5.1% -9.2% -0.8% 57.7% 96.3% 46.3% Single Family Detached Lower Mainland $1,251,800 265.7 -1.3% -3.3% -6.6% -5.3% 26.5% 64.9% 105.5% Greater Vancouver $1,479,000 272.3 -1.4% -4.0% -7.3% -7.8% 18.2% 59.1% 109.8% Bowen Island $1,001,800 217.2 2.0% 2.8% -3.0% 5.0% 56.0% 78.9% 79.1% Burnaby East $1,156,000 258.5 -4.3% -7.4% -13.8% -10.6% 15.5% 57.2% 105.0% Burnaby North $1,448,900 280.2 -1.4% -3.3% -5.8% -8.2% 15.5% 59.0% 116.4% Burnaby South $1,569,800 300.5 -2.6% -1.2% -8.3% -6.6% 20.8% 63.8% 129.4% Coquitlam $1,214,300 269.5 -1.3% -5.5% -7.5% -5.3% 26.2% 69.6% 105.3% Ladner $964,500 232.5 1.6% -4.2% -3.4% -6.3% 11.2% 57.0% 79.3% Maple Ridge $824,200 234.8 -0.7% -4.7% -6.4% -0.3% 50.8% 79.9% 89.5% New Westminster $1,057,900 263.9 -2.9% -5.3% -11.1% -8.7% 20.6% 61.1% 104.1% North Vancouver $1,542,200 241.2 -1.7% -4.8% -8.4% -8.2% 15.5% 60.8% 95.9% Pitt Meadows $912,000 257.0 1.9% -1.7% -4.7% 2.0% 50.5% 82.1% 108.4% Port Coquitlam $947,000 252.5 -3.2% -3.8% -8.1% -4.9% 27.3% 68.4% 96.5% Port Moody $1,485,300 274.3 -0.9% -1.3% -4.3% -1.1% 32.8% 72.5% 107.5% Richmond $1,593,000 308.6 -0.9% -4.2% -6.7% -9.2% 18.1% 62.7% 122.8% Squamish $975,600 246.6 0.0% -1.0% -7.1% -4.6% 51.0% 98.2% 96.2% Sunshine Coast $613,700 215.0 1.3% 2.2% -2.3% 5.8% 56.5% 81.3% 71.2% Tsawwassen $1,192,200 256.7 -0.5% -5.9% -4.5% -7.0% 16.7% 70.0% 109.7% Vancouver East $1,447,300 319.9 -1.6% -3.7% -6.1% -7.2% 18.3% 67.0% 143.3% Vancouver West $3,135,400 321.9 -2.2% -3.7% -7.6% -11.8% 8.6% 49.0% 135.5% West Vancouver $2,674,700 252.5 -2.3% -3.7% -9.2% -13.5% 2.6% 37.8% 111.7% Whistler $1,699,500 217.1 -0.1% -2.5% -4.8% -3.5% 48.7% 85.4% 67.8% HOW TO READ THE TABLE: • Benchmark Price: Estimated sale price of a benchmark property. Benchmarks represent a typical property within each market. • Price Index: Index numbers estimate the percentage change in price on typical and constant quality properties over time. All figures are based on past sales. • x Month/Year Change %: Percentage change of index over a period of x month(s)/year(s) * In January 2005, the indexes are set to 100. Townhome properties are similar to Attached properties, a category that was used in the previous MLSLink HPI, but do not included duplexes. The above info is deemed reliable, but is not guaranteed. All dollar amounts in CDN. December 2018* * MLS®, Multiple Listing Service®, and all related graphics are trademarks of The Canadian Real Estate Association 1 of 15
- 5. Property Type Area Benchmark Price Price Index 1 Month Change % 3 Month Change % 6 Month Change % 1 Year Change % 3 Year Change % 5 Year Change % 10 Year Change % December 2018* Townhouse Lower Mainland $685,700 247.3 -0.7% -3.1% -5.1% 2.1% 50.2% 73.1% 86.1% Greater Vancouver $809,700 257.7 -1.1% -3.3% -5.3% 1.3% 43.6% 70.9% 93.6% Burnaby East $696,300 257.2 1.7% -3.1% -2.9% 5.6% 59.6% 68.5% 88.6% Burnaby North $724,400 270.4 -2.5% -5.8% -6.8% -0.5% 45.7% 67.6% 95.9% Burnaby South $790,800 272.4 -0.9% -3.9% -7.7% 3.3% 51.9% 71.4% 104.7% Coquitlam $667,900 245.1 -0.4% -2.7% -6.2% 0.7% 43.8% 71.8% 87.8% Ladner $760,500 265.2 -1.2% -3.3% -2.2% -2.1% 40.1% 69.0% 98.5% Maple Ridge $552,300 256.4 0.4% -1.2% -3.8% 4.7% 72.1% 92.8% 88.1% New Westminster $714,200 282.4 0.1% -2.1% -1.3% 3.0% 52.6% 77.3% 116.9% North Vancouver $994,300 241.6 -2.0% -2.7% -5.3% 1.2% 34.0% 68.4% 95.6% Pitt Meadows $636,200 275.3 -2.2% -3.2% -4.2% 8.2% 68.4% 97.1% 106.8% Port Coquitlam $633,700 239.9 -0.8% -4.0% -7.9% 0.4% 49.1% 67.9% 82.9% Port Moody $661,000 223.4 -1.9% -2.2% -3.6% 5.1% 31.3% 63.7% 69.8% Richmond $819,800 269.4 -2.4% -4.9% -4.1% 1.5% 40.5% 66.6% 98.8% Squamish $666,300 227.2 -2.7% -8.3% -7.8% 0.4% 51.8% 88.5% 68.8% Tsawwassen $748,800 278.9 1.3% -2.8% -2.3% -0.8% 45.1% 74.4% 108.8% Vancouver East $850,000 279.0 2.3% -2.7% -8.0% -3.3% 29.9% 61.6% 102.5% Vancouver West $1,236,500 273.1 -0.9% 0.6% -5.1% -0.5% 34.1% 69.7% 112.9% Whistler $882,000 220.6 -2.8% -7.7% -6.9% 3.0% 59.5% 98.7% 63.9% Apartment Lower Mainland $650,300 274.8 -0.6% -3.6% -6.5% 2.6% 58.0% 84.3% 101.3% Greater Vancouver $664,100 266.5 -0.6% -3.4% -6.4% 0.6% 50.1% 77.2% 99.6% Burnaby East $770,300 295.5 1.0% 0.3% -4.0% 1.9% 60.2% 76.0% 113.8% Burnaby North $619,100 264.3 -2.1% -4.0% -5.6% 2.6% 67.3% 84.7% 100.4% Burnaby South $685,700 275.3 -0.6% -3.4% -7.0% 0.1% 54.9% 79.7% 103.8% Coquitlam $519,000 284.8 -0.6% -3.5% -6.0% 3.2% 66.7% 100.3% 118.2% Ladner $461,900 218.9 -0.2% -1.8% -1.9% 5.8% 36.6% 56.1% 58.7% Maple Ridge $360,800 257.6 0.5% -0.9% -6.8% 5.0% 73.6% 90.3% 89.1% New Westminster $544,100 308.3 -1.1% -1.3% -4.0% 7.4% 75.6% 94.1% 119.3% North Vancouver $567,300 227.6 -1.2% -4.8% -7.3% -0.3% 41.0% 58.4% 79.5% Pitt Meadows $503,000 296.6 0.2% -3.2% -7.6% 2.8% 78.1% 100.4% 117.8% Port Coquitlam $451,200 269.8 -0.1% -1.4% -7.8% 2.2% 70.1% 93.0% 90.9% Port Moody $627,300 261.4 -2.9% -5.9% -10.3% -0.9% 61.6% 100.0% 100.9% Richmond $668,500 279.1 1.5% -3.2% -4.5% 2.5% 60.2% 85.2% 108.3% Squamish $455,900 219.6 -4.0% -5.5% -14.0% -1.9% 53.4% 106.2% 61.4% Tsawwassen $492,300 207.6 -1.1% -1.8% -2.5% 6.5% 43.3% 59.2% 50.5% Vancouver East $538,000 296.8 -2.4% -6.5% -6.3% -1.4% 47.7% 74.2% 101.8% Vancouver West $783,700 254.3 0.2% -2.5% -7.0% -2.9% 32.9% 65.6% 97.0% West Vancouver $1,140,900 231.1 -5.5% -6.0% -11.3% -2.6% 41.3% 69.8% 89.3% Whistler $496,900 162.9 -2.9% -4.6% -14.3% -2.1% 73.7% 136.1% 22.4% HOW TO READ THE TABLE: • Benchmark Price: Estimated sale price of a benchmark property. Benchmarks represent a typical property within each market. • Price Index: Index numbers estimate the percentage change in price on typical and constant quality properties over time. All figures are based on past sales. • x Month/Year Change %: Percentage change of index over a period of x month(s)/year(s) In January 2005, the indexes are set to 100. * Townhome properties are similar to attached properties, a category that was used in the previous MLSLink HPI, but do not included duplexes. Lower Mainland includes areas serviced by both Real Estate Board of Greater Vancouver & Fraser Valley Real Estate Board. The above info is deemed reliable, but is not guaranteed. All dollar amounts in CDN. * MLS®, Multiple Listing Service®, and all related graphics are trademarks of The Canadian Real Estate Association 2 of 15
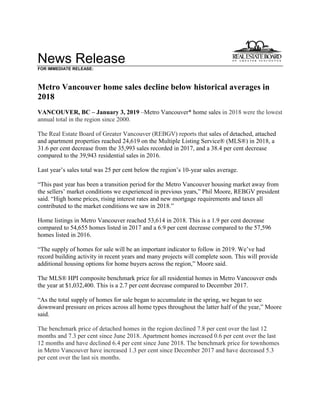
- 6. C:DATAMonthEndHpiexporthi_resgv-hpi2.tifGreaterVancouver 5YearTrend 60 110 160 210 260 310 Dec 2013 Feb 2014 Apr 2014 Jun 2014 Aug 2014 Oct 2014 Dec 2014 Feb 2015 Apr 2015 Jun 2015 Aug 2015 Oct 2015 Dec 2015 Feb 2016 Apr 2016 Jun 2016 Aug 2016 Oct 2016 Dec 2016 Feb 2017 Apr 2017 Jun 2017 Aug 2017 Oct 2017 Dec 2017 Feb 2018 Apr 2018 Jun 2018 Aug 2018 Oct 2018 Dec 2018 Price Index ResidentialDetachedTownhouseApartment Jan2005HPI=100
- 9. Listing & Sales Activity Summary Listings Sales 1 2 3 Col. 2 & 3 5 6 7 Col. 6 & 7 9 10 Col. 9 & 10 Dec Nov Dec Percentage Dec Nov Dec Percentage Oct 2017 - Oct 2018 - Percentage 2017 2018 2018 Variance 2017 2018 2018 Variance Dec 2017 Dec 2018 Variance BURNABY % % % DETACHED 78 86 50 -41.9 44 34 30 -11.8 208 109 -47.6 ATTACHED 41 63 38 -39.7 45 29 12 -58.6 162 73 -54.9 APARTMENTS 112 240 111 -53.8 145 104 76 -26.9 548 283 -48.4 COQUITLAM DETACHED 59 108 51 -52.8 50 52 27 -48.1 218 124 -43.1 ATTACHED 20 51 15 -70.6 32 27 20 -25.9 116 75 -35.3 APARTMENTS 82 101 52 -48.5 79 55 42 -23.6 301 159 -47.2 DELTA DETACHED 18 49 16 -67.3 26 22 19 -13.6 109 68 -37.6 ATTACHED 5 18 5 -72.2 8 8 8 0.0 26 23 -11.5 APARTMENTS 6 14 5 -64.3 5 9 8 -11.1 24 29 20.8 MAPLE RIDGE/PITT MEADOWS DETACHED 53 126 51 -59.5 82 63 51 -19.0 316 199 -37.0 ATTACHED 31 52 18 -65.4 40 38 9 -76.3 131 93 -29.0 APARTMENTS 72 58 17 -70.7 40 29 23 -20.7 143 95 -33.6 NORTH VANCOUVER DETACHED 47 100 33 -67.0 70 40 41 2.5 227 149 -34.4 ATTACHED 20 65 6 -90.8 21 24 24 0.0 100 74 -26.0 APARTMENTS 54 122 39 -68.0 78 75 34 -54.7 338 188 -44.4 NEW WESTMINSTER DETACHED 26 31 16 -48.4 17 19 13 -31.6 66 46 -30.3 ATTACHED 15 25 6 -76.0 14 5 6 20.0 40 14 -65.0 APARTMENTS 54 106 24 -77.4 85 63 39 -38.1 329 173 -47.4 PORT MOODY/BELCARRA DETACHED 5 20 6 -70.0 10 12 6 -50.0 50 29 -42.0 ATTACHED 16 15 3 -80.0 15 6 10 66.7 48 27 -43.8 APARTMENTS 13 32 7 -78.1 11 15 13 -13.3 86 42 -51.2 PORT COQUITLAM DETACHED 20 40 17 -57.5 20 21 18 -14.3 78 56 -28.2 ATTACHED 11 37 5 -86.5 17 13 15 15.4 62 49 -21.0 APARTMENTS 31 40 18 -55.0 32 33 18 -45.5 141 88 -37.6 RICHMOND DETACHED 100 150 70 -53.3 67 51 29 -43.1 232 139 -40.1 ATTACHED 66 110 41 -62.7 77 41 28 -31.7 278 116 -58.3 APARTMENTS 132 192 90 -53.1 141 85 64 -24.7 534 273 -48.9 SUNSHINE COAST DETACHED 40 53 28 -47.2 49 30 14 -53.3 164 93 -43.3 ATTACHED 3 2 10 400.0 5 4 4 0.0 24 13 -45.8 APARTMENTS 6 6 10 66.7 6 3 3 0.0 24 10 -58.3 SQUAMISH DETACHED 14 26 0 -100.0 14 12 7 -41.7 57 34 -40.4 ATTACHED 6 19 10 -47.4 18 8 4 -50.0 58 24 -58.6 APARTMENTS 5 16 8 -50.0 11 11 3 -72.7 41 20 -51.2 VANCOUVER EAST DETACHED 88 148 61 -58.8 88 57 42 -26.3 288 179 -37.8 ATTACHED 24 64 22 -65.6 33 31 18 -41.9 124 84 -32.3 APARTMENTS 93 169 48 -71.6 116 90 53 -41.1 436 262 -39.9 VANCOUVER WEST DETACHED 72 134 71 -47.0 36 61 33 -45.9 227 160 -29.5 ATTACHED 23 62 14 -77.4 26 29 18 -37.9 122 93 -23.8 APARTMENTS 229 498 174 -65.1 251 207 139 -32.9 1023 614 -40.0 WHISTLER/PEMBERTON DETACHED 20 21 19 -9.5 13 10 2 -80.0 46 29 -37.0 ATTACHED 11 18 23 27.8 19 17 8 -52.9 61 47 -23.0 APARTMENTS 20 37 31 -16.2 18 27 10 -63.0 69 65 -5.8 WEST VANCOUVER/HOWE SOUND DETACHED 35 98 47 -52.0 30 25 15 -40.0 96 76 -20.8 ATTACHED 3 8 7 -12.5 1 1 5 400.0 15 9 -40.0 APARTMENTS 10 29 9 -69.0 10 4 10 150.0 31 29 -6.5 GRAND TOTALS DETACHED 675 1190 536 -55.0 616 509 347 -31.8 2382 1490 -37.4 ATTACHED 295 609 223 -63.4 371 281 189 -32.7 1367 814 -40.5 APARTMENTS 919 1660 643 -61.3 1028 810 535 -34.0 4068 2330 -42.7