July 2015 rebgv stats package mike stewart
•
0 likes•3,270 views

http://www.mikestewart.ca/real-estate-board-of-greater-vancouver-rebgv-monthly-sales-statistics

Recommended
Recommended
More Related Content
What's hot
What's hot (20)
Similar to July 2015 rebgv stats package mike stewart
Similar to July 2015 rebgv stats package mike stewart (20)
More from Mike Stewart
More from Mike Stewart (10)
Recently uploaded
Recently uploaded (20)
July 2015 rebgv stats package mike stewart
- 1. News ReleaseFOR IMMEDIATE RELEASE: Summer heat doesn’t slow home buyer activity VANCOUVER, B.C. – August 5, 2015 – Metro Vancouver home sales were more than a third above the 10-year average in July, while the number of homes listed for sale continues to trend below recent years. The Real Estate Board of Greater Vancouver (REBGV) reports that residential property sales in Metro Vancouver* reached 3,978 on the Multiple Listing Service® (MLS®) in July 2015. This represents a 30 per cent increase compared to the 3,061 sales recorded in July 2014, and a decrease of 9.1 per cent compared to the 4,375 sales in June 2015. Last month’s sales were 33.5 per cent above the 10-year sales average for the month. “Today’s activity continues to benefit sellers as home buyers compete for the homes available for sale,” Darcy McLeod, REBGV president said. New listings for detached, attached and apartment properties in Metro Vancouver totalled 5,112 in July. This represents a 3.8 per cent increase compared to the 4,925 new listings reported in July 2014. The total number of properties currently listed for sale on the region’s MLS® is 11,505, a 26.3 per cent decline compared to July 2014 and a 5.5 per cent decline compared to June 2015. "Much of today’s activity can be traced to strong consumer confidence, low interest rates, and a reduced supply of homes for sale.” McLeod said. “We have about 5,000 to 6,000 fewer homes for sale today than we've seen at this time of year over the last five to six years," The MLS® Home Price Index composite benchmark price for all residential properties in Metro Vancouver is currently $700,500. This represents an 11.2 per cent increase compared to July 2014. With the sales-to-active-listings ratio at 34.6 per cent, the region remains in seller’s market territory. “Although there aren’t as many homes for sale today compared to recent years, home buyers continue to have a range of housing options, at different price points, to choose from across
- 2. Metro Vancouver,” McLeod said. “The diversity of housing options is part of what’s driving today’s demand.” Sales of detached properties in July 2015 reached 1,559, an increase of 17.9 per cent from the 1,322 detached sales recorded in July 2014, and a 24.8 per cent increase from the 1,249 units sold in July 2013. The benchmark price for a detached property in Metro Vancouver increased 16.2 per cent from July 2014 to $1,141,800. Sales of apartment properties reached 1,729 in July 2015, an increase of 42.7 per cent compared to the 1,212 sales in July 2014, and an increase of 42.9 per cent compared to the 1,210 sales in July 2013. The benchmark price of an apartment property increased 5.9 per cent from July 2014 to $400,900. Attached property sales in July 2015 totalled 690, an increase of 30.9 per cent compared to the 527 sales in July 2014, and a 41.7 per cent increase from the 487 attached properties sold in July 2013. The benchmark price of an attached unit increased 7.8 per cent between July 2014 and 2015 to $511,500. *Editor’s Note: Areas covered by Real Estate Board of Greater Vancouver include: Whistler, Sunshine Coast, Squamish, West Vancouver, North Vancouver, Vancouver, Burnaby, New Westminster, Richmond, Port Moody, Port Coquitlam, Coquitlam, New Westminster, Pitt Meadows, Maple Ridge, and South Delta. -30- The real estate industry is a key economic driver in British Columbia. In 2014, 33,116 homes changed ownership in the Board’s area, generating $2.136 billion in economic spin-off activity and an estimated 16,227 jobs. The total dollar value of residential sales transacted through the MLS® system in Metro Vancouver totalled $27.3 billion in 2014. The Real Estate Board of Greater Vancouver is an association representing nearly 12,000 REALTORS® and their companies. The Board provides a variety of member services, including the Multiple Listing Service®. For more information on real estate, statistics, and buying or selling a home, contact a local REALTOR® or visit www.rebgv.org. For more information please contact: Craig Munn Manager, Communication Real Estate Board of Greater Vancouver 604.730.3146 cmunn@rebgv.org
- 3. Property Type Area Benchmark Price Price Index 1 Month Change % 3 Month Change % 6 Month Change % 1 Year Change % 3 Year Change % 5 Year Change % 10 Year Change % Residential / Composite Lower Mainland $617,900 174.2 1.2% 3.9% 8.5% 9.9% 12.0% 19.4% 64.8% Greater Vancouver $700,500 183.3 0.9% 4.1% 9.2% 11.2% 13.9% 22.8% 72.8% Bowen Island $614,400 133.2 -0.1% 3.2% 5.8% 3.3% 2.2% -0.6% 22.5% Burnaby East $661,500 182.6 0.7% 4.1% 12.4% 10.7% 16.1% 23.0% 72.1% Burnaby North $595,300 178.9 1.2% 4.3% 10.3% 10.4% 14.9% 21.9% 69.3% Burnaby South $650,600 183.9 1.1% 3.8% 7.8% 10.1% 12.6% 23.1% 73.8% Coquitlam $588,500 174.1 1.0% 4.1% 8.7% 12.3% 16.0% 23.0% 66.1% Ladner $633,000 176.1 3.0% 6.5% 12.9% 16.1% 15.1% 21.2% 69.5% Maple Ridge $419,400 141.7 1.1% 3.4% 5.4% 7.2% 7.3% 5.6% 36.9% New Westminster $408,500 174.0 1.0% 3.8% 7.3% 7.8% 9.5% 16.2% 62.9% North Vancouver $751,700 169.6 -0.4% 1.9% 7.8% 10.9% 14.6% 20.5% 60.8% Pitt Meadows $422,200 154.5 -0.5% 2.2% 4.7% 6.9% 13.4% 10.5% 48.8% Port Coquitlam $452,600 160.4 1.3% 4.5% 9.3% 11.2% 12.8% 14.7% 52.9% Port Moody $598,200 165.4 2.0% 4.7% 9.2% 11.6% 17.1% 19.1% 56.8% Richmond $657,800 190.6 1.1% 4.8% 9.7% 10.7% 12.2% 20.5% 81.0% Squamish $448,300 146.1 0.0% 2.7% 8.2% 10.0% 13.3% 10.0% 38.9% Sunshine Coast $378,500 132.6 2.1% 5.0% 7.2% 6.3% 3.7% -0.2% 22.1% Tsawwassen $723,700 181.3 2.7% 7.6% 15.8% 18.0% 16.5% 24.2% 71.5% Vancouver East $732,300 214.5 1.2% 5.3% 10.1% 13.3% 18.4% 33.8% 101.2% Vancouver West $949,000 200.0 0.9% 3.4% 9.2% 11.5% 16.1% 29.1% 84.5% West Vancouver $1,955,900 209.9 1.9% 5.7% 13.3% 14.4% 21.5% 47.6% 97.1% Whistler $519,500 120.7 -0.3% 3.3% 8.2% 10.8% 7.3% 2.6% 16.3% Single Family Detached Lower Mainland $906,800 192.6 1.7% 5.4% 11.6% 13.8% 17.4% 31.3% 83.6% Greater Vancouver $1,141,800 210.6 1.6% 5.8% 13.0% 16.2% 19.9% 37.6% 100.6% Bowen Island $614,400 133.2 -0.1% 3.2% 5.8% 3.3% 2.2% -0.6% 22.5% Burnaby East $913,200 204.2 1.1% 6.6% 18.7% 15.4% 20.7% 37.9% 91.0% Burnaby North $1,170,200 226.3 1.9% 7.2% 16.5% 19.0% 26.3% 46.0% 115.3% Burnaby South $1,198,900 229.5 1.7% 4.8% 14.2% 17.2% 19.8% 46.7% 118.6% Coquitlam $874,700 193.8 1.6% 5.9% 12.4% 16.5% 21.5% 35.5% 86.0% Ladner $753,400 181.8 3.7% 6.3% 14.3% 19.1% 18.1% 25.5% 75.0% Maple Ridge $510,400 145.4 1.0% 4.5% 6.2% 7.9% 10.4% 10.2% 41.4% New Westminster $796,100 197.5 0.9% 6.1% 17.6% 15.2% 17.7% 31.9% 85.8% North Vancouver $1,175,300 187.1 -0.1% 3.3% 12.2% 16.1% 21.9% 32.7% 77.3% Pitt Meadows $565,400 159.4 0.9% 4.7% 7.5% 9.6% 13.7% 13.5% 54.5% Port Coquitlam $673,700 179.7 1.8% 6.9% 14.5% 17.3% 19.7% 27.7% 73.1% Port Moody $1,025,600 189.4 2.0% 6.5% 11.2% 14.2% 19.9% 33.3% 82.3% Richmond $1,165,200 233.7 1.8% 5.8% 13.0% 17.3% 18.4% 36.5% 122.4% Squamish $599,000 159.2 1.3% 5.1% 10.2% 9.6% 17.0% 22.7% 46.9% Sunshine Coast $376,200 131.8 2.0% 5.0% 7.2% 6.3% 3.5% -0.8% 21.4% Tsawwassen $892,200 192.1 2.9% 7.9% 17.3% 20.4% 20.8% 32.1% 79.5% Vancouver East $1,116,100 246.7 2.0% 6.7% 14.5% 19.9% 29.4% 56.0% 135.0% Vancouver West $2,653,200 272.4 2.1% 6.5% 12.8% 16.6% 22.2% 51.2% 160.7% West Vancouver $2,359,300 224.3 1.7% 5.5% 14.5% 15.4% 23.5% 56.5% 110.0% Whistler $1,025,100 141.9 1.6% 2.8% 8.7% 7.4% 16.6% 13.0% 33.7% HOW TO READ THE TABLE: • Benchmark Price: Estimated sale price of a benchmark property. Benchmarks represent a typical property within each market. • Price Index: Index numbers estimate the percentage change in price on typical and constant quality properties over time. All figures are based on past sales. • x Month/Year Change %: Percentage change of index over a period of x month(s)/year(s) * In January 2005, the indexes are set to 100. Townhome properties are similar to Attached properties, a category that was used in the previous MLSLink HPI, but do not included duplexes. The above info is deemed reliable, but is not guaranteed. All dollar amounts in CDN. July 2015* * MLS®, Multiple Listing Service®, and all related graphics are trademarks of The Canadian Real Estate Association 1 of 14
- 4. Property Type Area Benchmark Price Price Index 1 Month Change % 3 Month Change % 6 Month Change % 1 Year Change % 3 Year Change % 5 Year Change % 10 Year Change % July 2015* Townhouse Lower Mainland $421,600 152.6 0.8% 2.8% 5.6% 5.7% 5.5% 7.4% 46.2% Greater Vancouver $511,500 165.3 0.9% 3.7% 6.6% 7.8% 9.1% 12.8% 57.3% Burnaby East $454,500 163.0 -0.1% 2.8% 6.5% 6.1% 7.7% 12.3% 56.9% Burnaby North $440,600 164.3 0.9% 4.5% 8.6% 6.7% 10.2% 9.3% 53.6% Burnaby South $439,200 157.6 0.5% 3.2% 4.9% 2.9% 5.3% 7.2% 51.4% Coquitlam $418,300 153.7 1.0% 2.8% 6.1% 8.9% 9.3% 10.3% 45.5% Ladner $505,500 167.5 2.5% 6.3% 9.0% 9.8% 14.3% 17.7% 58.6% Maple Ridge $292,100 141.9 3.4% 2.6% 4.0% 9.6% 5.1% 1.6% 34.9% New Westminster $447,200 168.0 1.2% 5.3% 7.8% 7.9% 12.6% 18.1% 60.0% North Vancouver $649,700 155.5 -0.1% 3.9% 7.1% 7.9% 8.7% 10.8% 48.4% Pitt Meadows $361,700 156.5 -0.4% 2.7% 4.3% 11.0% 12.5% 11.1% 50.3% Port Coquitlam $401,600 152.3 1.1% 2.5% 6.6% 6.7% 7.3% 6.8% 43.4% Port Moody $453,900 153.4 1.5% 4.5% 6.5% 9.6% 10.1% 9.1% 43.5% Richmond $551,500 178.3 0.8% 4.1% 6.1% 7.0% 8.9% 15.2% 71.4% Squamish $382,200 138.7 -0.7% 2.5% 10.6% 7.3% 16.8% 6.9% 38.0% Tsawwassen $499,600 165.1 2.4% 5.8% 11.3% 13.1% 9.9% 14.5% 56.3% Vancouver East $570,900 188.2 1.6% 3.3% 4.7% 8.5% 8.2% 19.0% 72.2% Vancouver West $809,000 183.0 0.4% 3.3% 6.6% 6.6% 13.8% 22.4% 74.8% Whistler $526,500 140.8 -0.7% 4.1% 11.0% 8.6% 10.4% 17.6% 40.0% Apartment Lower Mainland $360,800 157.5 0.3% 1.7% 4.4% 5.1% 5.4% 7.5% 46.5% Greater Vancouver $400,900 161.2 0.2% 1.7% 4.7% 5.9% 7.4% 9.7% 49.7% Burnaby East $432,000 164.0 1.4% -3.0% 4.7% 4.5% 18.1% 6.4% 50.9% Burnaby North $359,200 151.8 0.6% 0.8% 4.3% 2.8% 6.3% 7.6% 43.5% Burnaby South $410,700 164.9 0.4% 2.6% 3.5% 6.3% 8.5% 12.7% 54.4% Coquitlam $272,500 150.0 -0.1% 1.2% 2.9% 6.6% 7.8% 7.0% 42.3% Ladner $346,200 164.1 1.2% 7.5% 11.9% 11.3% 5.1% 9.4% 60.6% Maple Ridge $169,100 122.1 -1.8% -1.6% 2.4% -0.8% -5.3% -10.4% 17.0% New Westminster $291,100 165.8 1.1% 2.5% 3.1% 4.7% 5.7% 9.9% 54.7% North Vancouver $368,600 150.0 -0.5% -0.9% 1.5% 4.3% 5.6% 7.1% 41.9% Pitt Meadows $249,600 147.5 -2.3% -1.3% 1.7% 1.2% 15.7% 7.4% 41.3% Port Coquitlam $237,500 140.8 0.5% 2.4% 3.1% 5.6% 6.9% 2.9% 33.5% Port Moody $364,500 151.9 2.7% 2.4% 8.1% 8.5% 16.2% 12.1% 43.8% Richmond $361,200 152.5 -0.4% 2.3% 5.1% 1.9% 2.8% 2.2% 43.6% Squamish $272,200 131.1 -2.2% -0.2% 3.1% 27.3% 4.8% -7.7% 26.8% Tsawwassen $358,100 151.0 1.7% 7.7% 12.3% 10.9% 3.9% 1.9% 47.7% Vancouver East $330,300 182.2 0.0% 3.6% 4.4% 5.0% 6.2% 10.4% 68.1% Vancouver West $529,900 171.5 0.4% 1.1% 6.6% 8.4% 11.3% 16.7% 55.5% West Vancouver $665,000 145.3 2.9% 6.4% 3.6% 5.8% 8.3% 5.5% 38.1% Whistler $267,200 87.6 -1.1% 3.8% 5.5% 27.7% 9.9% -19.4% -16.8% HOW TO READ THE TABLE: • Benchmark Price: Estimated sale price of a benchmark property. Benchmarks represent a typical property within each market. • Price Index: Index numbers estimate the percentage change in price on typical and constant quality properties over time. All figures are based on past sales. • x Month/Year Change %: Percentage change of index over a period of x month(s)/year(s) In January 2005, the indexes are set to 100. * Townhome properties are similar to attached properties, a category that was used in the previous MLSLink HPI, but do not included duplexes. Lower Mainland includes areas serviced by both Real Estate Board of Greater Vancouver & Fraser Valley Real Estate Board. The above info is deemed reliable, but is not guaranteed. All dollar amounts in CDN. * MLS®, Multiple Listing Service®, and all related graphics are trademarks of The Canadian Real Estate Association 2 of 14
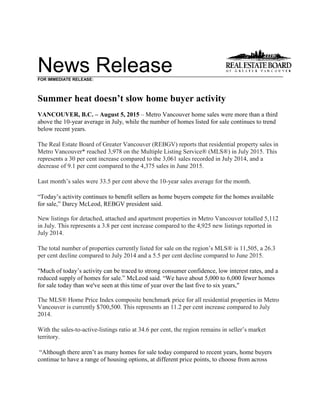
- 5. C:DATAMonthEndHpiexporthi_resgv-hpi2.tifGreaterVancouver 5YearTrend 60 80 100 120 140 160 180 200 220 Jul 2010 Sep 2010 Nov 2010 Jan 2011 Mar 2011 May 2011 Jul 2011 Sep 2011 Nov 2011 Jan 2012 Mar 2012 May 2012 Jul 2012 Sep 2012 Nov 2012 Jan 2013 Mar 2013 May 2013 Jul 2013 Sep 2013 Nov 2013 Jan 2014 Mar 2014 May 2014 Jul 2014 Sep 2014 Nov 2014 Jan 2015 Mar 2015 May 2015 Jul 2015 Price Index ResidentialDetachedTownhouseApartment Jan2005HPI=100
- 8. Listing & Sales Activity Summary Listings Sales 1 2 3 Col. 2 & 3 5 6 7 Col. 6 & 7 9 10 Col. 9 & 10 Jul Jun Jul Percentage Jul Jun Jul Percentage May 2014 - May 2015 - Percentage 2014 2015 2015 Variance 2014 2015 2015 Variance Jul 2014 Jul 2015 Variance BURNABY % % % DETACHED 210 230 177 -23.0 113 177 153 -13.6 350 483 38.0 ATTACHED 110 141 92 -34.8 79 96 116 20.8 247 321 30.0 APARTMENTS 252 364 380 4.4 154 244 238 -2.5 507 666 31.4 COQUITLAM DETACHED 167 230 190 -17.4 121 199 198 -0.5 406 564 38.9 ATTACHED 55 84 59 -29.8 45 56 57 1.8 157 176 12.1 APARTMENTS 112 195 155 -20.5 84 130 103 -20.8 226 331 46.5 DELTA DETACHED 79 75 70 -6.7 63 75 68 -9.3 204 211 3.4 ATTACHED 10 11 10 -9.1 5 9 8 -11.1 27 27 0.0 APARTMENTS 31 30 28 -6.7 18 26 20 -23.1 54 77 42.6 MAPLE RIDGE/PITT MEADOWS DETACHED 217 209 174 -16.7 158 187 159 -15.0 442 536 21.3 ATTACHED 53 75 99 32.0 45 71 74 4.2 140 213 52.1 APARTMENTS 36 95 49 -48.4 27 45 43 -4.4 97 120 23.7 NORTH VANCOUVER DETACHED 129 194 108 -44.3 112 156 116 -25.6 392 421 7.4 ATTACHED 48 56 36 -35.7 37 61 39 -36.1 127 156 22.8 APARTMENTS 165 141 157 11.3 75 120 128 6.7 259 371 43.2 NEW WESTMINSTER DETACHED 46 59 45 -23.7 32 46 38 -17.4 108 120 11.1 ATTACHED 18 17 23 35.3 4 13 13 0.0 25 43 72.0 APARTMENTS 144 151 131 -13.2 76 109 95 -12.8 220 313 42.3 PORT MOODY/BELCARRA DETACHED 39 39 43 10.3 28 33 27 -18.2 93 99 6.5 ATTACHED 20 19 14 -26.3 21 25 14 -44.0 74 54 -27.0 APARTMENTS 34 44 43 -2.3 26 37 39 5.4 86 106 23.3 PORT COQUITLAM DETACHED 56 77 71 -7.8 45 78 64 -17.9 141 206 46.1 ATTACHED 56 55 52 -5.5 22 34 42 23.5 94 110 17.0 APARTMENTS 67 99 73 -26.3 36 55 56 1.8 103 168 63.1 RICHMOND DETACHED 315 349 297 -14.9 159 238 218 -8.4 485 680 40.2 ATTACHED 171 166 129 -22.3 97 117 132 12.8 306 390 27.5 APARTMENTS 261 306 329 7.5 150 190 188 -1.1 439 552 25.7 SUNSHINE COAST DETACHED 111 120 98 -18.3 55 106 81 -23.6 186 246 32.3 ATTACHED 19 3 20 566.7 0 8 8 0.0 10 28 180.0 APARTMENTS 7 10 4 -60.0 3 9 9 0.0 20 23 15.0 SQUAMISH DETACHED 38 32 40 25.0 30 42 30 -28.6 88 106 20.5 ATTACHED 22 20 23 15.0 19 27 18 -33.3 53 76 43.4 APARTMENTS 8 15 21 40.0 11 18 15 -16.7 26 47 80.8 VANCOUVER EAST DETACHED 253 256 239 -6.6 170 221 149 -32.6 519 576 11.0 ATTACHED 56 81 58 -28.4 50 45 63 40.0 147 151 2.7 APARTMENTS 189 234 192 -17.9 137 199 175 -12.1 430 568 32.1 VANCOUVER WEST DETACHED 268 287 280 -2.4 143 236 155 -34.3 521 602 15.5 ATTACHED 116 106 87 -17.9 68 88 76 -13.6 202 258 27.7 APARTMENTS 613 734 687 -6.4 383 557 574 3.1 1231 1633 32.7 WHISTLER/PEMBERTON DETACHED 25 51 40 -21.6 20 17 16 -5.9 42 53 26.2 ATTACHED 48 42 40 -4.8 30 18 21 16.7 79 63 -20.3 APARTMENTS 32 37 36 -2.7 15 19 29 52.6 54 68 25.9 WEST VANCOUVER/HOWE SOUND DETACHED 156 216 152 -29.6 69 102 80 -21.6 245 280 14.3 ATTACHED 12 12 9 -25.0 5 13 9 -30.8 22 38 72.7 APARTMENTS 34 26 37 42.3 17 16 17 6.3 54 60 11.1 GRAND TOTALS DETACHED 2109 2424 2024 -16.5 1318 1913 1552 -18.9 4222 5183 22.8 ATTACHED 814 888 751 -15.4 527 681 690 1.3 1710 2104 23.0 APARTMENTS 1985 2481 2322 -6.4 1212 1774 1729 -2.5 3806 5103 34.1