SlideShare a Scribd company logo
1 of 9
Download to read offline
News ReleaseFOR IMMEDIATE RELEASE:
Metro Vancouver home buyers compete for fewer home listings
VANCOUVER, B.C. – October 2, 2015 – Conditions continue to favour home sellers across
*Metro Vancouver’s housing market.
The Real Estate Board of Greater Vancouver (REBGV) reports that residential property sales in
Metro Vancouver reached 3,345 on the Multiple Listing Service® (MLS®) in September 2015.
This represents a 14.5 per cent increase compared to the 2,922 sales recorded in September 2014,
and a 0.5 per cent decrease compared to the 3,362 sales in August 2015.
Last month’s sales were 32.9 per cent above the 10-year sales average for the month.
“Residential home sales have been trending at 25 to 30 per cent above the ten-year sales average
for most of the year. The number of homes listed for sale hasn’t been keeping up with the
demand,” Darcy McLeod, REBGV president said. “It’s this dynamic that’s placing upward
pressure on home prices, particularly in the detached home market.”
New listings for detached, attached and apartment properties in Metro Vancouver totalled 4,846
in September. This represents a 7.9 per cent decline compared to the 5,259 new listings reported
in September 2014.
The total number of properties listed for sale on the real estate board’s MLS® is 10,805, a 27 per
cent decline compared to September 2014 and a 0.8 per cent decline compared to August 2015.
“At no point this year has the number of homes listed for sale exceeded 14,000, which is the first
time this has occurred in the region since 2007,” McLeod said.
The MLS® Home Price Index composite benchmark price for all residential properties in Metro
Vancouver is currently $722,300. This represents a 13.7 per cent increase compared to
September 2014.
The sales-to-active-listings ratio in September was 31 per cent. Generally, analysts say that
downward pressure on home prices occurs when the ratio declines below the 12 per cent mark,
while home prices often experience upward pressure when it reaches 20 per cent, or higher, in a
particular community for a sustained period of time.
Sales of detached properties in September 2015 reached 1,272, an increase of 0.2 per cent from
the 1,270 detached sales recorded in September 2014, and a 24.3 per cent increase from the
1,023 units sold in September 2014. The benchmark price for a detached property in Metro
Vancouver increased 18.9 per cent from September 2014 to $1,179,700.
Sales of apartment properties reached 1,529 in September 2015, an increase of 28.7 per cent
compared to the 1,188 sales in September 2014, and an increase of 50.2 per cent compared to the
1,018 sales in September 2013. The benchmark price of an apartment property increased nine per
cent from September 2014 to $415,100.
Attached property sales in September 2015 totalled 544, an increase of 17.2 per cent compared to
the 464 sales in September 2014, and a 23.1 per cent increase from the 442 attached properties
sold in September 2013. The benchmark price of an attached unit increased 8.1 per cent between
September 2014 and 2015 to $518,600.
*Editor’s Note: Areas covered by Real Estate Board of Greater Vancouver include: Whistler, Sunshine Coast,
Squamish, West Vancouver, North Vancouver, Vancouver, Burnaby, New Westminster, Richmond, Port Moody,
Port Coquitlam, Coquitlam, New Westminster, Pitt Meadows, Maple Ridge, and South Delta.
-30-
The real estate industry is a key economic driver in British Columbia. In 2014, 33,116 homes changed ownership in
the Board’s area, generating $2.136 billion in economic spin-off activity and an estimated 16,227 jobs. The total
dollar value of residential sales transacted through the MLS® system in Metro Vancouver totalled $27.3 billion in
2014. The Real Estate Board of Greater Vancouver is an association representing nearly 12,000 REALTORS® and
their companies. The Board provides a variety of member services, including the Multiple Listing Service®. For
more information on real estate, statistics, and buying or selling a home, contact a local REALTOR® or visit
www.rebgv.org.
For more information please contact:
Craig Munn
Manager, Communication
Real Estate Board of Greater Vancouver
604.730.3146
cmunn@rebgv.org
Property Type Area
Benchmark
Price
Price
Index
1 Month
Change %
3 Month
Change %
6 Month
Change %
1 Year
Change %
3 Year
Change %
5 Year
Change %
10 Year
Change %
Residential / Composite Lower Mainland $636,000 179.3 1.8% 4.1% 8.7% 12.4% 16.7% 24.2% 64.8%
Greater Vancouver $722,300 189.0 1.9% 4.1% 9.3% 13.7% 19.4% 27.7% 72.9%
Bowen Island $642,500 139.3 2.0% 4.5% 8.6% 9.2% 8.5% 3.5% 23.2%
Burnaby East $677,100 186.9 0.8% 3.0% 10.0% 14.2% 20.0% 28.7% 70.7%
Burnaby North $614,600 184.7 2.2% 4.5% 9.5% 14.4% 21.4% 28.0% 69.6%
Burnaby South $670,700 189.6 2.5% 4.2% 8.7% 12.8% 16.9% 29.0% 74.4%
Coquitlam $609,100 180.2 2.3% 4.6% 10.2% 14.3% 20.1% 29.0% 68.7%
Ladner $651,400 181.2 1.6% 6.0% 13.3% 17.7% 21.1% 26.8% 69.8%
Maple Ridge $427,900 144.6 1.0% 3.2% 6.2% 8.5% 9.1% 10.2% 36.9%
New Westminster $421,000 179.3 1.9% 4.1% 8.7% 10.6% 14.0% 20.7% 63.1%
North Vancouver $768,100 173.3 1.7% 1.8% 5.7% 12.2% 16.7% 24.7% 60.0%
Pitt Meadows $423,800 155.1 -1.1% -0.1% 4.2% 7.9% 12.6% 13.8% 46.7%
Port Coquitlam $462,800 164.0 1.5% 3.6% 9.9% 11.8% 15.9% 17.6% 52.7%
Port Moody $611,600 169.1 1.6% 4.3% 8.0% 12.6% 19.7% 24.4% 56.1%
Richmond $679,900 197.0 2.3% 4.5% 10.0% 14.3% 19.2% 24.5% 82.4%
Squamish $458,400 149.4 1.9% 2.3% 5.1% 8.9% 12.6% 14.5% 40.0%
Sunshine Coast $385,000 134.9 1.4% 3.8% 8.4% 8.5% 5.1% 2.8% 16.9%
Tsawwassen $745,700 186.8 1.0% 5.8% 14.2% 20.1% 23.1% 30.8% 71.8%
Vancouver East $756,200 221.5 2.2% 4.5% 11.4% 15.6% 24.2% 39.1% 99.9%
Vancouver West $984,100 207.4 1.9% 4.6% 9.2% 14.5% 24.2% 34.0% 85.2%
West Vancouver $2,031,400 218.0 2.1% 5.8% 11.9% 19.5% 29.5% 58.7% 98.0%
Whistler $529,800 123.1 2.5% 1.7% 5.8% 6.7% 10.9% 10.3% 17.3%
Single Family Detached Lower Mainland $935,500 198.7 1.7% 4.9% 10.9% 16.6% 22.5% 36.8% 84.5%
Greater Vancouver $1,179,700 217.6 1.7% 5.0% 12.0% 18.9% 25.8% 43.7% 101.7%
Bowen Island $642,500 139.3 2.0% 4.5% 8.6% 9.2% 8.5% 3.5% 23.2%
Burnaby East $942,200 210.7 0.1% 4.4% 13.9% 20.5% 25.4% 44.7% 93.5%
Burnaby North $1,211,100 234.2 1.6% 5.4% 14.1% 24.0% 33.2% 52.0% 115.7%
Burnaby South $1,221,900 233.9 1.3% 3.7% 11.5% 18.6% 21.5% 54.8% 118.4%
Coquitlam $902,700 200.0 1.6% 4.8% 11.8% 18.2% 26.5% 41.2% 88.3%
Ladner $787,800 190.1 3.0% 8.4% 16.7% 21.6% 26.6% 32.9% 77.7%
Maple Ridge $524,800 149.5 1.2% 3.9% 7.9% 9.7% 12.2% 15.8% 42.5%
New Westminster $825,900 204.9 0.9% 4.6% 14.4% 19.6% 22.9% 38.9% 89.0%
North Vancouver $1,212,400 193.0 2.0% 3.0% 9.1% 17.8% 25.9% 38.7% 80.5%
Pitt Meadows $579,300 163.3 1.1% 3.4% 8.9% 11.5% 16.0% 20.0% 56.1%
Port Coquitlam $695,100 185.4 2.1% 5.0% 14.2% 18.2% 24.8% 31.7% 74.2%
Port Moody $1,054,300 194.7 2.6% 4.8% 12.3% 16.9% 23.4% 39.2% 82.6%
Richmond $1,209,600 242.6 2.0% 5.7% 12.4% 20.5% 25.1% 42.2% 123.6%
Squamish $617,000 164.0 1.6% 4.4% 6.1% 13.4% 19.1% 29.8% 48.6%
Sunshine Coast $383,100 134.2 1.4% 3.9% 8.4% 8.4% 4.8% 2.4% 16.3%
Tsawwassen $929,300 200.1 1.7% 7.2% 16.7% 23.3% 28.4% 39.3% 82.1%
Vancouver East $1,160,900 256.6 2.2% 6.1% 14.3% 22.5% 36.7% 64.2% 137.2%
Vancouver West $2,743,800 281.7 1.8% 5.5% 12.1% 19.2% 31.2% 56.1% 161.1%
West Vancouver $2,447,700 232.7 2.2% 5.5% 12.1% 21.0% 32.4% 67.3% 111.5%
Whistler $1,043,200 144.4 -0.4% 3.4% 3.7% 10.8% 17.2% 17.5% 35.3%
HOW TO READ THE TABLE:
• Benchmark Price: Estimated sale price of a benchmark property. Benchmarks represent a typical property within each market.
• Price Index: Index numbers estimate the percentage change in price on typical and constant quality properties over time. All figures are based on past sales.
• x Month/Year Change %: Percentage change of index over a period of x month(s)/year(s) *
In January 2005, the indexes are set to 100.
Townhome properties are similar to Attached properties, a category that was used in the previous MLSLink HPI, but do not included duplexes.
The above info is deemed reliable, but is not guaranteed. All dollar amounts in CDN.
September 2015*
* MLS®, Multiple Listing Service®, and all related graphics are trademarks of The Canadian Real Estate Association 1 of 14
Property Type Area
Benchmark
Price
Price
Index
1 Month
Change %
3 Month
Change %
6 Month
Change %
1 Year
Change %
3 Year
Change %
5 Year
Change %
10 Year
Change %
September 2015*
Townhouse Lower Mainland $427,100 154.6 1.0% 2.1% 5.4% 6.2% 8.6% 10.0% 44.6%
Greater Vancouver $518,600 167.6 1.4% 2.3% 7.0% 8.1% 12.9% 15.6% 56.1%
Burnaby East $445,800 159.9 0.2% -2.0% 2.2% 4.2% 6.2% 12.2% 48.5%
Burnaby North $441,400 164.6 1.4% 1.1% 7.6% 6.7% 12.1% 11.7% 50.7%
Burnaby South $448,400 160.9 1.7% 2.6% 9.3% 6.0% 7.3% 13.0% 51.1%
Coquitlam $432,800 159.0 3.0% 4.5% 6.9% 10.3% 13.0% 15.6% 48.2%
Ladner $501,300 166.1 -0.8% 1.7% 7.3% 9.1% 11.6% 16.5% 56.0%
Maple Ridge $296,400 144.0 2.3% 5.0% 5.5% 9.2% 8.8% 6.0% 34.5%
New Westminster $437,900 164.5 -0.1% -0.9% 3.7% 6.2% 10.9% 15.4% 52.9%
North Vancouver $659,700 157.9 0.6% 1.5% 6.1% 8.0% 14.5% 13.7% 45.9%
Pitt Meadows $360,800 156.1 -1.9% -0.6% 7.3% 9.5% 10.1% 13.5% 46.3%
Port Coquitlam $405,600 153.8 0.5% 2.1% 6.5% 6.4% 10.3% 9.0% 42.9%
Port Moody $463,100 156.5 1.3% 3.5% 6.7% 10.1% 12.4% 14.1% 42.9%
Richmond $567,000 183.3 2.1% 3.7% 7.8% 10.0% 14.2% 18.9% 72.8%
Squamish $389,600 141.4 3.1% 1.2% 7.4% 4.1% 10.1% 10.2% 39.2%
Tsawwassen $491,400 162.4 -0.4% 0.7% 5.8% 10.9% 9.2% 13.2% 52.5%
Vancouver East $579,100 190.9 2.2% 3.0% 8.7% 6.3% 14.7% 22.0% 71.1%
Vancouver West $813,900 184.1 0.3% 1.0% 5.5% 7.8% 21.0% 22.5% 70.0%
Whistler $531,800 142.2 2.7% 0.3% 6.6% 5.3% 10.3% 22.8% 39.8%
Apartment Lower Mainland $373,100 162.9 2.5% 3.7% 6.1% 8.2% 10.5% 12.3% 46.6%
Greater Vancouver $415,100 166.9 2.4% 3.7% 6.4% 9.0% 13.1% 14.3% 49.8%
Burnaby East $454,200 172.4 2.4% 6.6% 8.7% 9.2% 28.7% 16.6% 50.7%
Burnaby North $374,100 158.1 3.3% 4.8% 5.2% 7.8% 13.7% 15.1% 44.9%
Burnaby South $429,600 172.5 4.0% 5.0% 6.5% 10.1% 15.5% 17.8% 56.3%
Coquitlam $283,600 156.1 3.2% 4.0% 8.3% 8.9% 10.2% 13.4% 44.9%
Ladner $347,300 164.6 -1.5% 1.5% 7.1% 12.2% 11.1% 15.3% 55.3%
Maple Ridge $165,300 119.4 -2.4% -4.0% -3.8% -0.6% -8.6% -11.2% 11.8%
New Westminster $301,000 171.4 2.8% 4.5% 6.9% 7.3% 10.6% 14.4% 55.0%
North Vancouver $373,300 151.9 2.2% 0.7% 0.9% 6.1% 4.4% 9.8% 38.5%
Pitt Meadows $244,700 144.6 -3.1% -4.2% -3.5% 1.8% 11.5% 7.1% 35.4%
Port Coquitlam $242,600 143.8 1.6% 2.6% 6.1% 6.9% 7.8% 5.3% 32.3%
Port Moody $370,100 154.2 0.7% 4.3% 3.1% 8.1% 17.6% 16.5% 41.5%
Richmond $372,100 157.1 3.0% 2.6% 6.1% 6.3% 10.7% 4.6% 44.3%
Squamish $279,900 134.8 3.5% 0.6% 5.0% 10.0% 5.2% -4.3% 28.4%
Tsawwassen $356,200 150.2 -2.0% 1.1% 6.4% 11.4% 8.4% 6.8% 41.7%
Vancouver East $338,400 186.7 2.1% 2.5% 7.0% 7.7% 10.7% 13.4% 62.9%
Vancouver West $555,500 179.8 2.5% 5.2% 8.0% 12.3% 19.3% 22.8% 57.9%
West Vancouver $694,800 151.8 0.9% 7.5% 9.1% 7.9% 11.2% 16.5% 37.3%
Whistler $278,200 91.2 5.2% 2.9% 8.4% 9.7% 18.8% -5.4% -14.5%
HOW TO READ THE TABLE:
• Benchmark Price: Estimated sale price of a benchmark property. Benchmarks represent a typical property within each market.
• Price Index: Index numbers estimate the percentage change in price on typical and constant quality properties over time. All figures are based on past sales.
• x Month/Year Change %: Percentage change of index over a period of x month(s)/year(s)
In January 2005, the indexes are set to 100. *
Townhome properties are similar to attached properties, a category that was used in the previous MLSLink HPI, but do not included duplexes.
Lower Mainland includes areas serviced by both Real Estate Board of Greater Vancouver & Fraser Valley Real Estate Board.
The above info is deemed reliable, but is not guaranteed. All dollar amounts in CDN.
* MLS®, Multiple Listing Service®, and all related graphics are trademarks of The Canadian Real Estate Association 2 of 14
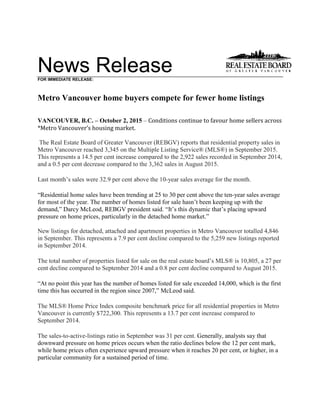
C:DATAMonthEndHpiexporthi_resgv-hpi2.tifGreaterVancouver
5YearTrend
60
80
100
120
140
160
180
200
220
240
Sep 2010
Nov 2010
Jan 2011
Mar 2011
May 2011
Jul 2011
Sep 2011
Nov 2011
Jan 2012
Mar 2012
May 2012
Jul 2012
Sep 2012
Nov 2012
Jan 2013
Mar 2013
May 2013
Jul 2013
Sep 2013
Nov 2013
Jan 2014
Mar 2014
May 2014
Jul 2014
Sep 2014
Nov 2014
Jan 2015
Mar 2015
May 2015
Jul 2015
Sep 2015
Price
Index
ResidentialDetachedTownhouseApartment
Jan2005HPI=100
9222015MLS®
SALESFacts
Burnaby
Coquitlam
Delta-South
Islands-Gulf
MapleRidge/PittMeadows
NewWestminster
NorthVancouver
PortCoquitlam
PortMoody/Belcarra
Richmond
Squamish
SunshineCoast
VancouverEast
VancouverWest
WestVancouver/HoweSound
Whistler/Pemberton
Detached86126585154301074219176337714412567231,272
Attached7748606919373111841544851836544
Apartment2211142103980111373719419915743325321,529
Detached$1,270,000$950,765$915,000n/a$587,000$799,000$1,356,250$705,300n/a$1,368,000$755,000$432,500$1,288,000$2,868,250$2,600,000$975,000
Attached$565,000$593,000n/an/a$314,950n/a$685,000$434,900n/a$596,000n/an/a$794,000$1,110,000n/a$566,000n/a
Apartment$395,000$335,950$409,000n/a$215,000$285,000$389,000$249,900$375,000$389,000n/an/a$410,000$527,000$859,000$324,500
Detached12410443415132955329181246213814883191,290
Attached75581506311284216941643776439578
Apartment2159223025859641301789612752613281,494
Detached$1,261,090$920,000$885,000n/a$594,250$837,500$1,356,000$665,000$1,050,000$1,310,000$715,000$407,568$1,293,500$2,870,000$2,500,000n/a
Attached$520,000$547,450n/an/a$317,500n/a$749,250$459,500n/a$593,500n/an/a$740,000$940,000n/a$525,000n/a
Apartment$407,000$331,250$395,000n/a$220,000$323,000$432,950$267,400$408,500$352,000n/an/a$400,000$551,500n/a$233,750
Detached10312657512330923243152256514517180211,270
Attached57381003082323141142123555925464
Apartment1567416035678132311191129141721351,188
Detached$965,000$811,500$676,757n/a$486,275$679,500$1,100,000$575,000$795,000$1,070,000$554,800$386,250$1,001,500$2,320,000$2,142,500$980,000
Attached$480,000$497,300n/an/a$283,000n/a$632,000$408,500n/a$555,000$360,000n/a$601,800$920,000n/a$614,000n/a
Apartment$387,250$320,500n/an/a$215,000$310,390$385,000$230,000$378,000$365,900n/an/a$350,000$505,000$680,000$290,000
Detached1,2501,268545411,3902981,1714662521,8012675651,5281,57080515013,367
Attached81146189054712741929715098917760438695872305,577
Apartment1,78189019602948029794042551,546128651,4424,21116023213,385
Detached$1,233,500$883,250$850,188$380,000$547,500$810,000$1,287,125$660,000$970,000$1,210,000$656,500$400,000$1,200,000$2,770,000$2,372,500$1,133,750
Attached$535,000$511,750$505,125n/a$317,000$463,280$680,000$418,800$437,500$568,250$419,900$275,000$725,000$930,000$1,138,000$575,000n/a
Apartment$390,000$324,950$360,000n/a$210,386$304,000$402,000$245,000$385,000$355,000$259,500$256,298$378,950$524,950$789,500$275,000
Detached8991,047478381,0392721,0063782291,2912134411,3691,41264112410,877
Attached5913926203627429125818283412633383504602154,367
Apartment1,36559813702756096802692251,11979521,0753,36213919910,183
Detached$998,000$772,000$696,500$377,000$491,000$701,050$1,075,000$570,000$865,500$1,024,000$538,500$375,000$960,000$2,336,000$2,100,000$1,085,000
Attached$515,000$479,000$438,500n/a$302,000$429,000$662,000$390,000$435,000$537,100$360,000$239,950$655,000$873,000$1,154,000$587,500n/a
Apartment$372,500$294,944$332,500n/a$216,275$308,000$380,000$241,000$358,000$351,500$215,000$250,000$348,000$490,000$719,500$254,800
Note:MedianSellingPricesarenotreportedforareaswithlessthan20salesorfortheGulfIslands
Median
Selling
Price
Number
of
Sales
Median
Selling
Price
August
2015
September
2014
Jan.-
Sep.2015
Jan.-
Sep.2014
Median
Selling
Price
Number
of
Sales
Median
Selling
Price
Number
of
Sales
September
2015
Number
of
Sales
Median
Selling
Price
Number
of
Sales
September
2015
Year-to-date
Year-to-date
9222015MLS®
LISTINGSFacts
Burnaby
Coquitlam
Delta-South
Islands-Gulf
MapleRidge/PittMeadows
NewWestminster
NorthVancouver
PortCoquitlam
PortMoody/Belcarra
Richmond
Squamish
SunshineCoast
VancouverEast
VancouverWest
WestVancouver/HoweSound
Whistler/Pemberton
Detached1901886571752819257432642671216309202292,062
Attached9767818917384621153191055113925768
Apartment238126340481271604141265142620063526352,016
Detached45%67%89%71%88%107%56%74%44%67%127%108%67%40%33%79%
Attached79%72%75%0%78%112%97%67%52%55%79%40%87%45%89%144%n/a
Apartment93%90%62%n/a81%63%69%90%90%73%136%35%79%68%96%91%
Detached171135543174439747372632989241217122221,744
Attached89788054163038121152275986435653
Apartment242130280441241244429291161120053731331,884
Detached73%77%80%133%87%74%98%113%78%69%83%70%57%68%68%86%
Attached84%74%188%n/a117%69%93%111%133%82%73%57%63%88%100%111%n/a
Apartment89%71%82%n/a57%69%77%93%103%61%56%55%64%98%42%85%
Detached2091537282065518143442423384214307170152,036
Attached122731006012673627163166841211727841
Apartment31514325047161185804131013225373830392,382
Detached49%82%79%63%60%55%51%74%98%63%76%77%68%56%47%140%
Attached47%52%100%n/a50%67%34%64%52%70%131%33%42%45%53%93%n/a
Apartment50%52%64%n/a74%42%44%40%76%38%85%100%36%57%70%90%
Detached1,8481,665643891,7733681,5745683852,6263299422,2232,6871,67827319,671
Attached1,07660610127311784893951801,2812221025681,0251132937,362
Apartment2,7481,39626305421,3461,5056613632,801158982,0236,14629133620,677
Detached68%76%85%46%78%81%74%82%65%69%81%60%69%58%48%55%
Attached75%76%88%0%75%71%86%75%83%77%80%59%77%68%77%78%n/a
Apartment65%64%75%n/a54%60%65%61%70%55%81%66%71%69%55%69%
Detached1,8081,6227351291,8314221,5724993732,5043381,0342,1212,8091,46825719,522
Attached1,0025819226051314923902361,372174876239881213047,200
Apartment2,4871,20422505251,3021,5476253582,6061231151,9936,21129933319,953
Detached50%65%65%29%57%64%64%76%61%52%63%43%65%50%44%48%
Attached59%67%67%0%60%56%59%66%77%61%72%38%61%51%50%71%n/a
Apartment55%50%61%n/a52%47%44%43%63%43%64%45%54%54%46%60%
*Year-to-datelistingsrepresentacumulativetotaloflistingsratherthantotalactivelistings.
Number
of
Listings
September
2015
Number
of
Listings
%Salesto
Listings
Number
of
Listings
%Salesto
Listings
Number
of
Listings
%Salesto
Listings
August
2015
September
2014
Jan.-
Sep.2015
Jan.-
Sep.2014
%Salesto
Listings
Number
of
Listings
%Salesto
Listings
September
2015
Year-to-date*
Year-to-date*
Listing & Sales Activity Summary
Listings Sales
1 2 3 Col. 2 & 3 5 6 7 Col. 6 & 7 9 10 Col. 9 & 10
Sep Aug Sep Percentage Sep Aug Sep Percentage Jul 2014 - Jul 2015 - Percentage
2014 2015 2015 Variance 2014 2015 2015 Variance Sep 2014 Sep 2015 Variance
BURNABY % % %
DETACHED 209 171 190 11.1 103 124 86 -30.6 326 363 11.3
ATTACHED 122 89 97 9.0 57 75 77 2.7 200 268 34.0
APARTMENTS 315 242 238 -1.7 156 215 221 2.8 477 674 41.3
COQUITLAM
DETACHED 153 135 188 39.3 126 104 126 21.2 358 428 19.6
ATTACHED 73 78 67 -14.1 38 58 48 -17.2 126 163 29.4
APARTMENTS 143 130 126 -3.1 74 92 114 23.9 231 309 33.8
DELTA
DETACHED 72 54 65 20.4 57 43 58 34.9 177 169 -4.5
ATTACHED 10 8 8 0.0 10 15 6 -60.0 21 29 38.1
APARTMENTS 25 28 34 21.4 16 23 21 -8.7 51 64 25.5
MAPLE RIDGE/PITT MEADOWS
DETACHED 206 174 175 0.6 123 151 154 2.0 384 464 20.8
ATTACHED 60 54 89 64.8 30 63 69 9.5 117 206 76.1
APARTMENTS 47 44 48 9.1 35 25 39 56.0 84 107 27.4
NORTH VANCOUVER
DETACHED 181 97 192 97.9 92 95 107 12.6 303 318 5.0
ATTACHED 67 30 38 26.7 23 28 37 32.1 81 104 28.4
APARTMENTS 185 124 160 29.0 81 96 111 15.6 233 335 43.8
NEW WESTMINSTER
DETACHED 55 43 28 -34.9 30 32 30 -6.3 91 100 9.9
ATTACHED 12 16 17 6.3 8 11 19 72.7 17 43 152.9
APARTMENTS 161 124 127 2.4 67 85 80 -5.9 212 260 22.6
PORT MOODY/BELCARRA
DETACHED 44 37 43 16.2 43 29 19 -34.5 93 75 -19.4
ATTACHED 27 12 21 75.0 14 16 11 -31.3 50 41 -18.0
APARTMENTS 41 29 41 41.4 31 30 37 23.3 75 106 41.3
PORT COQUITLAM
DETACHED 43 47 57 21.3 32 53 42 -20.8 121 159 31.4
ATTACHED 36 38 46 21.1 23 42 31 -26.2 77 115 49.4
APARTMENTS 80 44 41 -6.8 32 41 37 -9.8 97 134 38.1
RICHMOND
DETACHED 242 263 264 0.4 152 181 176 -2.8 443 575 29.8
ATTACHED 163 115 153 33.0 114 94 84 -10.6 321 310 -3.4
APARTMENTS 310 291 265 -8.9 119 178 194 9.0 390 560 43.6
SUNSHINE COAST
DETACHED 84 89 71 -20.2 65 62 77 24.2 174 220 26.4
ATTACHED 6 7 10 42.9 2 4 4 0.0 9 16 77.8
APARTMENTS 2 11 26 136.4 2 6 9 50.0 14 24 71.4
SQUAMISH
DETACHED 33 29 26 -10.3 25 24 33 37.5 77 87 13.0
ATTACHED 16 22 19 -13.6 21 16 15 -6.3 56 49 -12.5
APARTMENTS 13 16 14 -12.5 11 9 19 111.1 32 43 34.4
VANCOUVER EAST
DETACHED 214 241 216 -10.4 145 138 144 4.3 469 431 -8.1
ATTACHED 84 59 55 -6.8 35 37 48 29.7 117 148 26.5
APARTMENTS 253 200 200 0.0 91 127 157 23.6 336 459 36.6
VANCOUVER WEST
DETACHED 307 217 309 42.4 171 148 125 -15.5 440 428 -2.7
ATTACHED 121 86 113 31.4 55 76 51 -32.9 181 203 12.2
APARTMENTS 738 537 635 18.2 417 526 433 -17.7 1169 1533 31.1
WHISTLER/PEMBERTON
DETACHED 15 22 29 31.8 21 19 23 21.1 56 58 3.6
ATTACHED 27 35 25 -28.6 25 39 36 -7.7 86 96 11.6
APARTMENTS 39 33 35 6.1 35 28 32 14.3 74 89 20.3
WEST VANCOUVER/HOWE SOUND
DETACHED 170 122 202 65.6 80 83 67 -19.3 221 230 4.1
ATTACHED 17 4 9 125.0 9 4 8 100.0 19 21 10.5
APARTMENTS 30 31 26 -16.1 21 13 25 92.3 51 55 7.8
GRAND TOTALS
DETACHED 2028 1741 2055 18.0 1265 1286 1267 -1.5 3733 4105 10.0
ATTACHED 841 653 767 17.5 464 578 544 -5.9 1478 1812 22.6
APARTMENTS 2382 1884 2016 7.0 1188 1494 1529 2.3 3526 4752 34.8
ResidentialAverageSalePrices-January1977toSeptember2015
0
200
400
600
800
1000
1200
1400
1600
197719781979198019811982198319841985198619871988198919901991199219931994199519961997199819992000200120022003200420052006200720082009201020112012201320142015
DETACHEDCONDOMINIUMATTACHEDAPARTMENTS
INTHOUSANDS($)
NOTE:From1977-1984condominiumaverageswerenotseparatedintoattached&apartment.
$640,395
$479,168
$1,408,722

More Related Content

What's hot

April 2017 Real Estate Board of Greater Vancouver Statistics Package with Charts
April 2017 Real Estate Board of Greater Vancouver Statistics Package with ChartsApril 2017 Real Estate Board of Greater Vancouver Statistics Package with Charts
April 2017 Real Estate Board of Greater Vancouver Statistics Package with Charts
Mike Stewart
 

What's hot (20)

REBGV September 2016 Stats Package Mike Stewart Vancouver Realtor
REBGV September 2016 Stats Package Mike Stewart Vancouver RealtorREBGV September 2016 Stats Package Mike Stewart Vancouver Realtor
REBGV September 2016 Stats Package Mike Stewart Vancouver Realtor
 
October 2016 REBGV Statistics Package Vancouver BC Mike Stewart Realtor
October 2016 REBGV Statistics Package Vancouver BC Mike Stewart RealtorOctober 2016 REBGV Statistics Package Vancouver BC Mike Stewart Realtor
October 2016 REBGV Statistics Package Vancouver BC Mike Stewart Realtor
 
January 2017 Rebgv Statistics Package Mike Stewart Vancouver Realtor
January 2017 Rebgv Statistics Package Mike Stewart Vancouver RealtorJanuary 2017 Rebgv Statistics Package Mike Stewart Vancouver Realtor
January 2017 Rebgv Statistics Package Mike Stewart Vancouver Realtor
 
December 2016 rebgv statistics package mike stewart vancouver realtor
December 2016 rebgv statistics package mike stewart vancouver realtorDecember 2016 rebgv statistics package mike stewart vancouver realtor
December 2016 rebgv statistics package mike stewart vancouver realtor
 
March 2017 Rebgv Stats Package Mike Stewart
March 2017 Rebgv Stats Package Mike StewartMarch 2017 Rebgv Stats Package Mike Stewart
March 2017 Rebgv Stats Package Mike Stewart
 
February 2017 REBGV Statistics Package Mike Stewart Realtor
February 2017 REBGV Statistics Package Mike Stewart RealtorFebruary 2017 REBGV Statistics Package Mike Stewart Realtor
February 2017 REBGV Statistics Package Mike Stewart Realtor
 
May 2017 REBGV Stats
May 2017 REBGV Stats May 2017 REBGV Stats
May 2017 REBGV Stats
 
Real Estate Board of Greater Vancouver Statistics Package October 2021
Real Estate Board of Greater Vancouver Statistics Package October 2021Real Estate Board of Greater Vancouver Statistics Package October 2021
Real Estate Board of Greater Vancouver Statistics Package October 2021
 
Metro Vancouver Statistics Report October 2021
Metro Vancouver Statistics Report October 2021Metro Vancouver Statistics Report October 2021
Metro Vancouver Statistics Report October 2021
 
REBGV Statistic Package December 2020
REBGV Statistic Package December 2020REBGV Statistic Package December 2020
REBGV Statistic Package December 2020
 
April 2017 Real Estate Board of Greater Vancouver Statistics Package with Charts
April 2017 Real Estate Board of Greater Vancouver Statistics Package with ChartsApril 2017 Real Estate Board of Greater Vancouver Statistics Package with Charts
April 2017 Real Estate Board of Greater Vancouver Statistics Package with Charts
 
Rebgv stats-pkg-june-2019
Rebgv stats-pkg-june-2019Rebgv stats-pkg-june-2019
Rebgv stats-pkg-june-2019
 
Real Estate Board of Greater Vancouver Statistics Package July 2021
Real Estate Board of Greater Vancouver Statistics Package July 2021Real Estate Board of Greater Vancouver Statistics Package July 2021
Real Estate Board of Greater Vancouver Statistics Package July 2021
 
August 2017 REBGV Stats Mike Stewart Realtor
August 2017 REBGV Stats Mike Stewart RealtorAugust 2017 REBGV Stats Mike Stewart Realtor
August 2017 REBGV Stats Mike Stewart Realtor
 
Rebgv stats-pkg-november-2019-f
Rebgv stats-pkg-november-2019-fRebgv stats-pkg-november-2019-f
Rebgv stats-pkg-november-2019-f
 
REBGV Statistics Package June 2020
REBGV Statistics Package June 2020REBGV Statistics Package June 2020
REBGV Statistics Package June 2020
 
REBGV Statistics Package October 2020
REBGV Statistics Package October 2020REBGV Statistics Package October 2020
REBGV Statistics Package October 2020
 
Rebgv stats-pkg-july-2019
Rebgv stats-pkg-july-2019Rebgv stats-pkg-july-2019
Rebgv stats-pkg-july-2019
 
Rebgv stats-pkg-december-2019
Rebgv stats-pkg-december-2019Rebgv stats-pkg-december-2019
Rebgv stats-pkg-december-2019
 
REBGV STATS PACKAGE JULY 2017
REBGV STATS PACKAGE JULY 2017REBGV STATS PACKAGE JULY 2017
REBGV STATS PACKAGE JULY 2017
 

Similar to September 2015 rebgv statistics package mike stewart

Similar to September 2015 rebgv statistics package mike stewart (20)

REBGV Statistics package July 2020
REBGV Statistics package July 2020REBGV Statistics package July 2020
REBGV Statistics package July 2020
 
Rebgv stats-pkg-august-2019
Rebgv stats-pkg-august-2019Rebgv stats-pkg-august-2019
Rebgv stats-pkg-august-2019
 
Rebgv stats-pkg-february-2020
Rebgv stats-pkg-february-2020Rebgv stats-pkg-february-2020
Rebgv stats-pkg-february-2020
 
May 2021 Real Estate Board of Greater Vancouver Statistics Package
May 2021 Real Estate Board of Greater Vancouver Statistics PackageMay 2021 Real Estate Board of Greater Vancouver Statistics Package
May 2021 Real Estate Board of Greater Vancouver Statistics Package
 
Rebgv stats-pkg-may-2021
Rebgv stats-pkg-may-2021Rebgv stats-pkg-may-2021
Rebgv stats-pkg-may-2021
 
Real Estate Board of Greater Vancouver - Stats Package May 2021
Real Estate Board of Greater Vancouver - Stats Package May 2021Real Estate Board of Greater Vancouver - Stats Package May 2021
Real Estate Board of Greater Vancouver - Stats Package May 2021
 
REBGV Statistics Package May 2022
REBGV Statistics Package May 2022REBGV Statistics Package May 2022
REBGV Statistics Package May 2022
 
Rebgv Stats Package September 2020
Rebgv Stats Package September 2020Rebgv Stats Package September 2020
Rebgv Stats Package September 2020
 
REBGV Statistics Package May 2020
REBGV Statistics Package May 2020REBGV Statistics Package May 2020
REBGV Statistics Package May 2020
 
Real Estate Board of Greater Vancouver Statistics Package January 2021
Real Estate Board of Greater Vancouver Statistics Package January 2021 Real Estate Board of Greater Vancouver Statistics Package January 2021
Real Estate Board of Greater Vancouver Statistics Package January 2021
 
REBGV-Stats-Pkg-July-2022
REBGV-Stats-Pkg-July-2022REBGV-Stats-Pkg-July-2022
REBGV-Stats-Pkg-July-2022
 
Rebgv stats-pkg-june-2018
Rebgv stats-pkg-june-2018Rebgv stats-pkg-june-2018
Rebgv stats-pkg-june-2018
 
Rebgv stats-pkg-august-2018
Rebgv stats-pkg-august-2018Rebgv stats-pkg-august-2018
Rebgv stats-pkg-august-2018
 
REBGV-Stats-Pkg-April-2022.pdf
REBGV-Stats-Pkg-April-2022.pdfREBGV-Stats-Pkg-April-2022.pdf
REBGV-Stats-Pkg-April-2022.pdf
 
Rebgv stats-pkg-october-2020
Rebgv stats-pkg-october-2020Rebgv stats-pkg-october-2020
Rebgv stats-pkg-october-2020
 
May-2019 Stats Package for Greater Vancouver
May-2019 Stats Package for Greater VancouverMay-2019 Stats Package for Greater Vancouver
May-2019 Stats Package for Greater Vancouver
 
Rebgv stats-pkg-may-2019
Rebgv stats-pkg-may-2019Rebgv stats-pkg-may-2019
Rebgv stats-pkg-may-2019
 
REBGV Statistics Package November 2022
REBGV Statistics Package November 2022REBGV Statistics Package November 2022
REBGV Statistics Package November 2022
 
REBGV Statistics Package December 2022
REBGV Statistics Package December 2022REBGV Statistics Package December 2022
REBGV Statistics Package December 2022
 
201807 rebgv-stats-package-for-media
201807 rebgv-stats-package-for-media201807 rebgv-stats-package-for-media
201807 rebgv-stats-package-for-media
 

More from Mike Stewart

More from Mike Stewart (11)

1_FINTRAC_clientinfo_2021.pdf
1_FINTRAC_clientinfo_2021.pdf1_FINTRAC_clientinfo_2021.pdf
1_FINTRAC_clientinfo_2021.pdf
 
Mike Stewart PREC Listing Contract
Mike Stewart PREC Listing ContractMike Stewart PREC Listing Contract
Mike Stewart PREC Listing Contract
 
November 2017 rebgv stats mike stewart real estate agent
November 2017 rebgv stats mike stewart real estate agentNovember 2017 rebgv stats mike stewart real estate agent
November 2017 rebgv stats mike stewart real estate agent
 
October 2017 REBGV Stats Mike Stewart Vancouver Realtor
October 2017 REBGV Stats Mike Stewart Vancouver RealtorOctober 2017 REBGV Stats Mike Stewart Vancouver Realtor
October 2017 REBGV Stats Mike Stewart Vancouver Realtor
 
September 2017 rebgv statistics package mike stewart realtor
September 2017 rebgv statistics package mike stewart realtorSeptember 2017 rebgv statistics package mike stewart realtor
September 2017 rebgv statistics package mike stewart realtor
 
July 2017 Real Estate Board of Greater Vancouver Stats Package Mike Stewart r...
July 2017 Real Estate Board of Greater Vancouver Stats Package Mike Stewart r...July 2017 Real Estate Board of Greater Vancouver Stats Package Mike Stewart r...
July 2017 Real Estate Board of Greater Vancouver Stats Package Mike Stewart r...
 
June 2017 REBGV Statistics Package
June 2017 REBGV Statistics PackageJune 2017 REBGV Statistics Package
June 2017 REBGV Statistics Package
 
15% tax on international buyers in vancouver
15% tax on international buyers in vancouver15% tax on international buyers in vancouver
15% tax on international buyers in vancouver
 
REBGV Stats for December 2011 Courtesy Mike Stewart Vancouver Realtor
REBGV Stats for December 2011 Courtesy Mike Stewart Vancouver RealtorREBGV Stats for December 2011 Courtesy Mike Stewart Vancouver Realtor
REBGV Stats for December 2011 Courtesy Mike Stewart Vancouver Realtor
 
October 2011 REBGV Stats Mike Stewart
October 2011 REBGV Stats Mike StewartOctober 2011 REBGV Stats Mike Stewart
October 2011 REBGV Stats Mike Stewart
 
REBGV Stats for Sept 2011 Mike Stewart
REBGV Stats for Sept 2011 Mike StewartREBGV Stats for Sept 2011 Mike Stewart
REBGV Stats for Sept 2011 Mike Stewart
 

Recently uploaded

9990771857 Call Girls in Dwarka Sector 2 Delhi (Call Girls) Delhi
9990771857 Call Girls in Dwarka Sector 2 Delhi (Call Girls) Delhi9990771857 Call Girls in Dwarka Sector 2 Delhi (Call Girls) Delhi
9990771857 Call Girls in Dwarka Sector 2 Delhi (Call Girls) Delhi
delhimodel235
 
Bptp The Amaario Launch Luxury Project Sector 37D Gurgaon Dwarka Expressway...
Bptp The Amaario Launch  Luxury Project  Sector 37D Gurgaon Dwarka Expressway...Bptp The Amaario Launch  Luxury Project  Sector 37D Gurgaon Dwarka Expressway...
Bptp The Amaario Launch Luxury Project Sector 37D Gurgaon Dwarka Expressway...
ApartmentWala1
 
9990771857 Call Girls in Dwarka Sector 6 Delhi (Call Girls) Delhi
9990771857 Call Girls in Dwarka Sector 6 Delhi (Call Girls) Delhi9990771857 Call Girls in Dwarka Sector 6 Delhi (Call Girls) Delhi
9990771857 Call Girls in Dwarka Sector 6 Delhi (Call Girls) Delhi
delhimodel235
 
BPTP THE AMAARIO For The Royals Of Tomorrow in Sector 37D Gurgaon Dwarka Expr...
BPTP THE AMAARIO For The Royals Of Tomorrow in Sector 37D Gurgaon Dwarka Expr...BPTP THE AMAARIO For The Royals Of Tomorrow in Sector 37D Gurgaon Dwarka Expr...
BPTP THE AMAARIO For The Royals Of Tomorrow in Sector 37D Gurgaon Dwarka Expr...
ApartmentWala1
 
Call Girls in Anand Vihar Delhi +91 8447779280}Call Girls In Delhi Best in D...
Call Girls in Anand Vihar Delhi +91 8447779280}Call Girls In Delhi Best  in D...Call Girls in Anand Vihar Delhi +91 8447779280}Call Girls In Delhi Best  in D...
Call Girls in Anand Vihar Delhi +91 8447779280}Call Girls In Delhi Best in D...
asmaqueen5
 
Cheap Rate ✨➥9711108085▻✨Call Girls In Malviya Nagar(Delhi)
Cheap Rate ✨➥9711108085▻✨Call Girls In Malviya Nagar(Delhi)Cheap Rate ✨➥9711108085▻✨Call Girls In Malviya Nagar(Delhi)
Cheap Rate ✨➥9711108085▻✨Call Girls In Malviya Nagar(Delhi)
delhi24hrs1
 
9990771857 Call Girls Dwarka Sector 9 Delhi (Call Girls ) Delhi
9990771857 Call Girls Dwarka Sector 9 Delhi (Call Girls ) Delhi9990771857 Call Girls Dwarka Sector 9 Delhi (Call Girls ) Delhi
9990771857 Call Girls Dwarka Sector 9 Delhi (Call Girls ) Delhi
delhimodel235
 
9990771857 Call Girls in Dwarka Sector 08 Delhi (Call Girls) Delhi
9990771857 Call Girls in Dwarka Sector 08 Delhi (Call Girls) Delhi9990771857 Call Girls in Dwarka Sector 08 Delhi (Call Girls) Delhi
9990771857 Call Girls in Dwarka Sector 08 Delhi (Call Girls) Delhi
delhimodel235
 
MEQ Mainstreet Equity Corp Q2 2024 Investor Presentation
MEQ Mainstreet Equity Corp Q2 2024 Investor PresentationMEQ Mainstreet Equity Corp Q2 2024 Investor Presentation
MEQ Mainstreet Equity Corp Q2 2024 Investor Presentation
MEQ - Mainstreet Equity Corp.
 

Recently uploaded (20)

9990771857 Call Girls in Dwarka Sector 2 Delhi (Call Girls) Delhi
9990771857 Call Girls in Dwarka Sector 2 Delhi (Call Girls) Delhi9990771857 Call Girls in Dwarka Sector 2 Delhi (Call Girls) Delhi
9990771857 Call Girls in Dwarka Sector 2 Delhi (Call Girls) Delhi
 
Mahindra Happinest Tathawade Pune Brochure.pdf
Mahindra Happinest Tathawade Pune Brochure.pdfMahindra Happinest Tathawade Pune Brochure.pdf
Mahindra Happinest Tathawade Pune Brochure.pdf
 
Kolte Patil Kharadi Pune E Brochure.pdf
Kolte Patil Kharadi Pune E  Brochure.pdfKolte Patil Kharadi Pune E  Brochure.pdf
Kolte Patil Kharadi Pune E Brochure.pdf
 
M3M The Line Brochure - Premium Investment Opportunity for Commercial Ventures
M3M The Line Brochure - Premium Investment Opportunity for Commercial VenturesM3M The Line Brochure - Premium Investment Opportunity for Commercial Ventures
M3M The Line Brochure - Premium Investment Opportunity for Commercial Ventures
 
Bptp The Amaario Launch Luxury Project Sector 37D Gurgaon Dwarka Expressway...
Bptp The Amaario Launch  Luxury Project  Sector 37D Gurgaon Dwarka Expressway...Bptp The Amaario Launch  Luxury Project  Sector 37D Gurgaon Dwarka Expressway...
Bptp The Amaario Launch Luxury Project Sector 37D Gurgaon Dwarka Expressway...
 
BDSM⚡Call Girls in Sector 57 Noida Escorts >༒8448380779 Escort Service
BDSM⚡Call Girls in Sector 57 Noida Escorts >༒8448380779 Escort ServiceBDSM⚡Call Girls in Sector 57 Noida Escorts >༒8448380779 Escort Service
BDSM⚡Call Girls in Sector 57 Noida Escorts >༒8448380779 Escort Service
 
Vanam At Purva Soukhyam Guduvanchery.pdf.pdf
Vanam At Purva Soukhyam Guduvanchery.pdf.pdfVanam At Purva Soukhyam Guduvanchery.pdf.pdf
Vanam At Purva Soukhyam Guduvanchery.pdf.pdf
 
9990771857 Call Girls in Dwarka Sector 6 Delhi (Call Girls) Delhi
9990771857 Call Girls in Dwarka Sector 6 Delhi (Call Girls) Delhi9990771857 Call Girls in Dwarka Sector 6 Delhi (Call Girls) Delhi
9990771857 Call Girls in Dwarka Sector 6 Delhi (Call Girls) Delhi
 
Yedi Mavi TOBB Zeytinburnu - Listing Turkey
Yedi Mavi TOBB Zeytinburnu - Listing TurkeyYedi Mavi TOBB Zeytinburnu - Listing Turkey
Yedi Mavi TOBB Zeytinburnu - Listing Turkey
 
2k Shots ≽ 9205541914 ≼ Call Girls In Sainik Farm (Delhi)
2k Shots ≽ 9205541914 ≼ Call Girls In Sainik Farm (Delhi)2k Shots ≽ 9205541914 ≼ Call Girls In Sainik Farm (Delhi)
2k Shots ≽ 9205541914 ≼ Call Girls In Sainik Farm (Delhi)
 
BPTP THE AMAARIO For The Royals Of Tomorrow in Sector 37D Gurgaon Dwarka Expr...
BPTP THE AMAARIO For The Royals Of Tomorrow in Sector 37D Gurgaon Dwarka Expr...BPTP THE AMAARIO For The Royals Of Tomorrow in Sector 37D Gurgaon Dwarka Expr...
BPTP THE AMAARIO For The Royals Of Tomorrow in Sector 37D Gurgaon Dwarka Expr...
 
Call Girls in Anand Vihar Delhi +91 8447779280}Call Girls In Delhi Best in D...
Call Girls in Anand Vihar Delhi +91 8447779280}Call Girls In Delhi Best  in D...Call Girls in Anand Vihar Delhi +91 8447779280}Call Girls In Delhi Best  in D...
Call Girls in Anand Vihar Delhi +91 8447779280}Call Girls In Delhi Best in D...
 
Cheap Rate ✨➥9711108085▻✨Call Girls In Malviya Nagar(Delhi)
Cheap Rate ✨➥9711108085▻✨Call Girls In Malviya Nagar(Delhi)Cheap Rate ✨➥9711108085▻✨Call Girls In Malviya Nagar(Delhi)
Cheap Rate ✨➥9711108085▻✨Call Girls In Malviya Nagar(Delhi)
 
M3M 129 E Brochure Noida Expressway, Sector 129, Noida
M3M 129 E Brochure Noida Expressway, Sector 129, NoidaM3M 129 E Brochure Noida Expressway, Sector 129, Noida
M3M 129 E Brochure Noida Expressway, Sector 129, Noida
 
9990771857 Call Girls Dwarka Sector 9 Delhi (Call Girls ) Delhi
9990771857 Call Girls Dwarka Sector 9 Delhi (Call Girls ) Delhi9990771857 Call Girls Dwarka Sector 9 Delhi (Call Girls ) Delhi
9990771857 Call Girls Dwarka Sector 9 Delhi (Call Girls ) Delhi
 
Kohinoor Hinjewadi Phase 2 Pune E-Brochure.pdf
Kohinoor Hinjewadi Phase 2 Pune  E-Brochure.pdfKohinoor Hinjewadi Phase 2 Pune  E-Brochure.pdf
Kohinoor Hinjewadi Phase 2 Pune E-Brochure.pdf
 
9990771857 Call Girls in Dwarka Sector 08 Delhi (Call Girls) Delhi
9990771857 Call Girls in Dwarka Sector 08 Delhi (Call Girls) Delhi9990771857 Call Girls in Dwarka Sector 08 Delhi (Call Girls) Delhi
9990771857 Call Girls in Dwarka Sector 08 Delhi (Call Girls) Delhi
 
2k Shot Call girls Karol Bagh Delhi 9205541914
2k Shot Call girls Karol Bagh Delhi 92055419142k Shot Call girls Karol Bagh Delhi 9205541914
2k Shot Call girls Karol Bagh Delhi 9205541914
 
MEQ Mainstreet Equity Corp Q2 2024 Investor Presentation
MEQ Mainstreet Equity Corp Q2 2024 Investor PresentationMEQ Mainstreet Equity Corp Q2 2024 Investor Presentation
MEQ Mainstreet Equity Corp Q2 2024 Investor Presentation
 
Majestique Viman Nagar Pune Brochure.pdf
Majestique Viman Nagar Pune Brochure.pdfMajestique Viman Nagar Pune Brochure.pdf
Majestique Viman Nagar Pune Brochure.pdf
 

September 2015 rebgv statistics package mike stewart