This document provides an overview of an interactive data visualization course being taught in spring 2015. It introduces the instructor, discusses expectations for the class, assignments, and some examples of data visualization. Key points:
- The class is an interactive data visualization course taught on Tuesdays from 12:30-3:15PM in building NEWHOUSE 3, room 253.
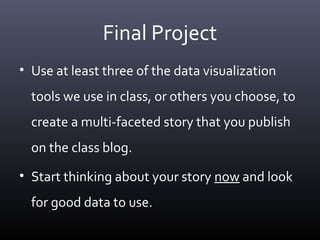
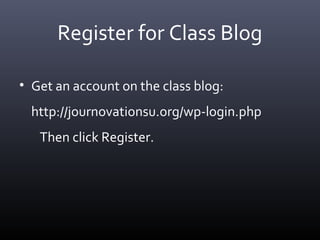
- Students will learn to create multi-faceted stories and visualizations using tools like Excel, Lynda.com, and publishing to a class blog.
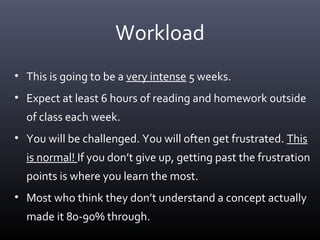
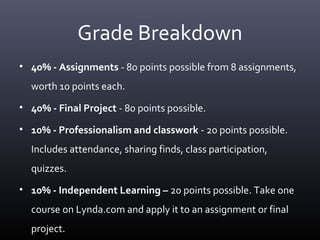
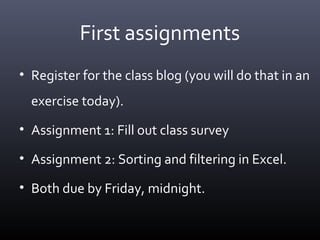
- Assignments include weekly visualizations, a final project, and an online course through Lynda.com. Students are expected to spend 6 hours per week outside of class on reading and