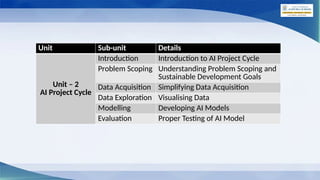
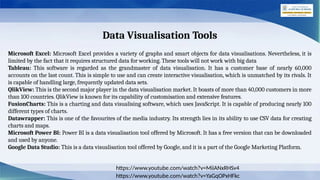
The document outlines the AI project cycle for Class IX, detailing stages such as problem scoping, data acquisition, data exploration, modeling, and evaluation. It emphasizes the importance of structured problem identification, the types and classifications of data, and the significance of big data in machine learning. Additionally, it discusses visualization tools and modeling techniques used in AI projects.


![Problem Statement Template
Our [stakeholder(s)]
________________________
Who
Has/have a problem that
[issue, problem, need]
________________________
What
When/while
[context, situation]
________________________
Where
An ideal solution would
[benefit of solution for them]
________________________
Why
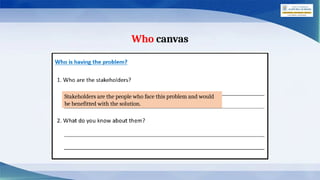
After filling the 4Ws Problem canvas, you now need to summarize all the cards into
one template. The Problem Statement Template helps us to summarize all the key
points into one single Template so that in future, whenever there is need to look back
at the basis of the problem, we can take a look at the Problem Statement Template and
understand the key elements of it.](https://image.slidesharecdn.com/aiprojectcycle-ix-250130114640-638d5e65/85/AI-Project-Cycle-Summary-Class-ninth-please-13-320.jpg)


![How Big Brands are Taking Your Traffic in Alberta [Data Inside].pptx](https://cdn.slidesharecdn.com/ss_thumbnails/howbigbrandsaretakingyourtrafficinalbertadatainside-260123180142-42d276f3-thumbnail.jpg?width=640&height=640&fit=bounds)

