Zee Entertainment: Paradigm shift in business model from cyclicality to annuity - Prabhudas Lilladher
•
1 like•372 views


Recommended
Recommended
More Related Content
What's hot
What's hot (20)
Similar to Zee Entertainment: Paradigm shift in business model from cyclicality to annuity - Prabhudas Lilladher
Similar to Zee Entertainment: Paradigm shift in business model from cyclicality to annuity - Prabhudas Lilladher (20)
More from IndiaNotes.com
More from IndiaNotes.com (20)
Zee Entertainment: Paradigm shift in business model from cyclicality to annuity - Prabhudas Lilladher
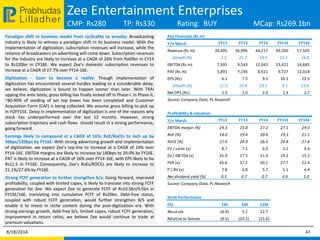
- 1. Lilladher Prabhudas Zee Entertainment Enterprises CMP: Rs280 TP: Rs330 Rating: BUY MCap: Rs269.1bn Paradigm shift in business model from cyclicality to annuity: Broadcasting industry is likely to witness a paradigm shift in its business model. With the implementation of digitization, subscription revenues will increase, while the reliance of broadcasters on advertising will come down. Subscription revenues for the industry are likely to increase at a CAGR of 26% from Rs69bn in CY13 to Rs220bn in CY18E. We expect Zee’s domestic subscription revenues to increase at a CAGR of 17.7% over FY14-16E. Digitization - Soon to become a reality: Though implementation of digitization has encountered several hurdles leading to a considerable delay, we believe, digitization is bound to happen sooner than later. With TRAI upping the ante lately, gross billing has finally kicked off in Phase-I. In Phase-II, ~80-90% of seeding of set top boxes has been completed and Customer Acquisition Form (CAF) is being collected. We assume gross billing to pick up in H2FY15E. Delay in implementation of digitization is one of the reasons why stock has underperformed over the last 12 months. However, strong subscription trajectory and cash flows should result in a strong performance, going forward. Earnings likely to compound at a CAGR of 16%; RoE/RoCEs to inch up by 50bps/120bps by FY16E: With strong advertising growth and implementation of digitization, we expect Zee’s top-line to increase at a CAGR of 14% over FY14-16E. EBITDA margins are likely to increase by 180bps to 29.0% by FY16E. PAT is likely to increase at a CAGR of 16% over FY14-16E, with EPS likely to be Rs12.5 in FY16E. Consequently, Zee’s RoEs/ROCEs are likely to increase to 21.1%/27.6% by FY16E. Strong FCFF generation to further strengthen b/s: Going forward, improved profitability, coupled with limited capex, is likely to translate into strong FCFF generation for Zee. We expect Zee to generate FCFF of Rs10.5bn/9.5bn in FY15E/16E, translating into cumulative FCFF of Rs20bn. Debt-free status, coupled with robust FCFF generation, would further strengthen B/S and enable it to invest in niche content during the post-digitization era. With strong earnings growth, debt-free b/s, limited capex, robust FCFF generation, improvement in return ratios, we believe Zee would continue to trade at premium valuations. 8/18/2014 47 Key Financials (Rs m) Y/e March FY12 FY13 FY14 FY15E FY16E Revenue (Rs m) 30,405 36,996 44,217 49,560 57,505 Growth (%) 1.1 21.7 19.5 12.1 16.0 EBITDA (Rs m) 7,395 9,543 12,043 13,421 16,685 PAT (Rs m) 5,891 7,196 8,921 9,727 12,018 EPS (Rs) 6.1 7.5 9.3 10.1 12.5 Growth (%) (2.7) 22.8 23.1 9.1 23.6 Net DPS (Rs) 1.5 2.0 2.0 2.4 2.7 Source: Company Data, PL Research Profitability & valuation Y/e March FY12 FY13 FY14 FY15E FY16E EBITDA margin (%) 24.3 25.8 27.2 27.1 29.0 RoE (%) 18.0 19.6 20.6 19.3 21.1 RoCE (%) 21.6 24.9 26.4 24.8 27.6 EV / sales (x) 8.7 7.1 6.0 5.2 4.4 EV / EBITDA (x) 35.9 27.5 21.9 19.2 15.2 PER (x) 45.6 37.2 30.2 27.7 22.4 P / BV (x) 7.8 6.8 5.7 5.1 4.4 Net dividend yield (%) 0.5 0.7 0.7 0.9 1.0 Source: Company Data, PL Research Stock Performance (%) 1M 6M 12M Absolute (4.9) 5.1 12.7 Relative to Sensex (9.5) (24.5) (23.6)
- 2. Lilladher Prabhudas Financials Zee Entertainment Enterprises 8/18/2014 48 Income Statement (Rs m) Y/e March FY12 FY13 FY14 FY15E FY16E Net Revenue 30,405 36,996 44,217 49,560 57,505 Direct Expenses 14,311 17,401 20,688 23,303 26,501 % of Net Sales 47.1 47.0 46.8 47.0 46.1 Employee Cost 2,925 3,491 3,905 4,361 5,060 % of Net Sales 9.6 9.4 8.8 8.8 8.8 SG&A Expenses - - - - - % of Net Sales 0.0 0.0 0.0 0.0 0.0 Other Expenses 5,774 6,561 7,581 8,475 9,258 % of Net Sales 19.0 17.7 17.1 17.1 16.1 EBITDA 7,395 9,543 12,043 13,421 16,685 Margin (%) 24.3 25.8 27.2 27.1 29.0 Depreciation 323 399 501 760 731 PBIT 7,072 9,144 11,541 12,661 15,955 Interest Expenses 50 86 158 50 50 PBT 8,406 10,519 13,190 14,411 17,805 Total tax 2,500 3,337 4,291 4,683 5,786 Effective Tax rate (%) 29.7 31.7 32.5 32.5 32.5 PAT 5,891 7,196 8,921 9,727 12,018 Extraordinary Gain/(Loss) - - - - - Adjusted PAT 5,891 7,196 8,921 9,727 12,018 Source: Company Data, PL Research Balance Sheet (Rs m) Y/e March FY12 FY13 FY14 FY15E FY16E Share Capital 959 954 21,130 21,130 21,130 Reserves & Surplus 33,396 38,162 26,247 32,068 39,844 Shareholder's Fund 34,355 39,116 47,377 53,198 60,974 Preference Share Capital - - - - - Total Debt 12 17 17 17 17 Other Liabilities(net) (32) 33 719 658 658 Deferred Tax Liability - - - - - Total Liabilities 34,335 39,166 48,113 53,873 61,649 Gross Block 11,205 12,306 14,564 15,258 16,005 Less: Depreciation 2,006 2,400 2,901 3,662 4,393 Net Block 9,199 9,906 11,663 11,596 11,613 Capital Work in Progress 201 69 69 69 69 Cash & Cash Equivalent 11,597 13,562 14,295 20,911 26,107 Total Current Assets 25,105 32,051 39,638 46,560 54,968 Total Current Liabilities 8,820 11,393 12,204 13,599 15,248 Net Current Assets 16,285 20,658 27,435 32,961 39,720 Other Assets 337 288 298 298 298 Total Assets 34,335 39,166 48,115 53,875 61,650 Source: Company Data, PL Research
- 3. Lilladher Prabhudas Disclaimer 8/18/2014 70 BUY : Over 15% Outperformance to Sensex over 12-months Accumulate : Outperformance to Sensex over 12-months Reduce : Underperformance to Sensex over 12-months Sell : Over 15% underperformance to Sensex over 12-months Trading Buy : Over 10% absolute upside in 1-month Trading Sell : Over 10% absolute decline in 1-month Not Rated (NR) : No specific call on the stock Under Review (UR) : Rating likely to change shortly This document has been prepared by the Research Division of Prabhudas Lilladher Pvt. Ltd. Mumbai, India (PL) and is meant for use by the recipient only as information and is not for circulation. This document is not to be reported or copied or made available to others without prior permission of PL. It should not be considered or taken as an offer to sell or a solicitation to buy or sell any security. The information contained in this report has been obtained from sources that are considered to be reliable. However, PL has not independently verified the accuracy or completeness of the same. Neither PL nor any of its affiliates, its directors or its employees accept any responsibility of whatsoever nature for the information, statements and opinion given, made available or expressed herein or for any omission therein. Recipients of this report should be aware that past performance is not necessarily a guide to future performance and value of investments can go down as well. The suitability or otherwise of any investments will depend upon the recipient's particular circumstances and, in case of doubt, advice should be sought from an independent expert/advisor. Either PL or its affiliates or its directors or its employees or its representatives or its clients or their relatives may have position(s), make market, act as principal or engage in transactions of securities of companies referred to in this report and they may have used the research material prior to publication. We may from time to time solicit or perform investment banking or other services for any company mentioned in this document. Prabhudas Lilladher Pvt. Ltd. 3rd Floor, Sadhana House, 570, P. B. Marg, Worli, Mumbai 400 018, India. Tel: (91 22) 6632 2222 Fax: (91 22) 6632 2209 PL’s Recommendation Nomenclature Rating Distribution of Research Coverage 32.7% 50.0% 17.3% 0.0% 0% 10% 20% 30% 40% 50% 60% BUY Accumulate Reduce Sell %ofTotalCoverage