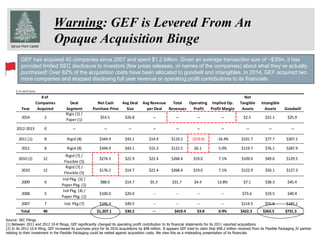
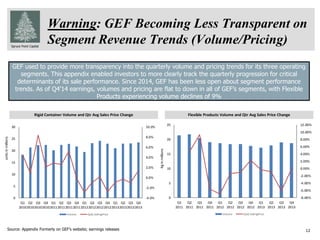
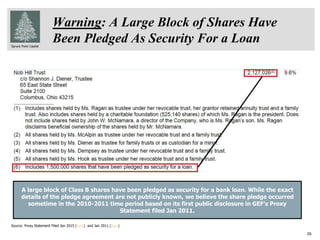
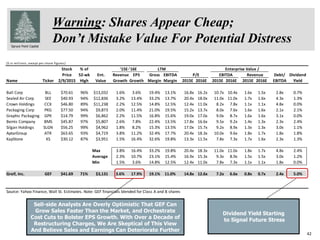
- Greif, Inc. (GEF) has engaged in a large acquisition spree over the past decade, spending over $1.2 billion to acquire 40 companies. However, GEF has provided limited disclosure to investors about these acquisitions.
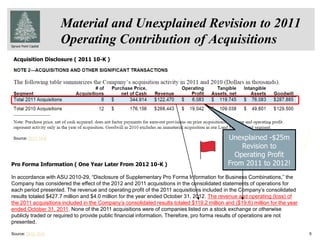
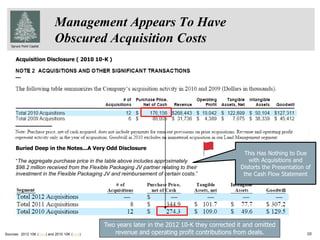
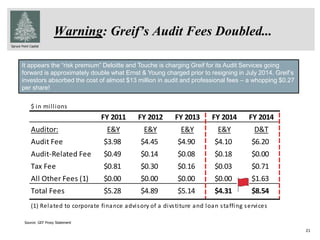
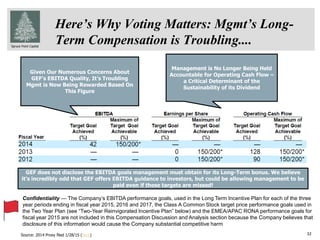
- GEF appears to have obfuscated and revised the financial performance and costs of its acquisitions. In one example, it increased the reported purchase price of 2010 acquisitions by $98 million through a misleading presentation.
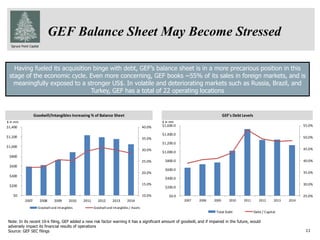
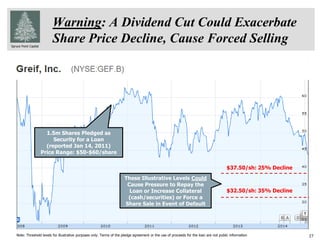
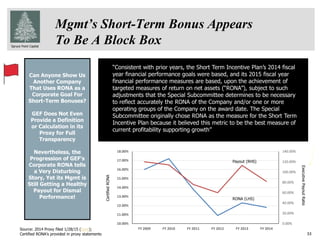
- With high acquisition debt on its balance sheet, GEF may be vulnerable in a weaker economic environment. It derives around 55% of sales from foreign markets, exposing it to currency risks from a stronger US dollar.