Ranbaxy Laboratories quarter update: Results below estimates
•
1 like•201 views

Ranbaxy's 5QFY14 results were below estimates. Revenue was flat YoY at INR24.7b, while EBITDA declined 7% YoY to INR1.5b, with EBITDA margin at 6.1%. Reported loss stood at INR738m

Recommended
Recommended
More Related Content
What's hot
What's hot (19)
Similar to Ranbaxy Laboratories quarter update: Results below estimates
Similar to Ranbaxy Laboratories quarter update: Results below estimates (20)
More from IndiaNotes.com
More from IndiaNotes.com (20)
Recently uploaded
Recently uploaded (20)
Ranbaxy Laboratories quarter update: Results below estimates
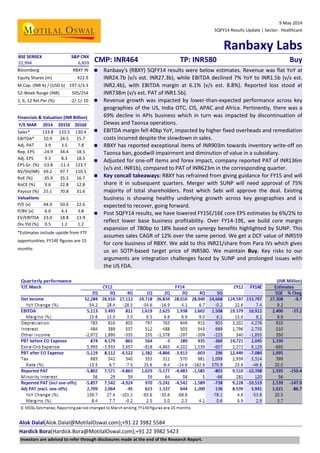
- 1. 9 May 2014 5QFY14 Results Update | Sector: Healthcare Ranbaxy Labs Alok Dalal(Alok.Dalal@MotilalOswal.com);+91 22 3982 5584 Hardick Bora(Hardick.Bora@MotilalOswal.com);+91 22 3982 5423 BSE SENSEX S&P CNX CMP: INR464 TP: INR580 Buy22,994 6,859 Bloomberg RBXY IN Equity Shares (m) 422.9 M.Cap. (INR b) / (USD b) 197.1/3.3 52-Week Range (INR) 505/254 1, 6, 12 Rel.Per (%) -2/-1/-10 Financials & Valuation (INR Billion) Y/E MAR 2014 2015E 2016E Sales* 133.8 133.5 130.4 EBITDA* 10.9 24.5 15.7 Adj. PAT 3.9 3.5 7.8 Rep. EPS -24.9 34.4 18.5 Adj. EPS 9.3 8.3 18.5 EPS Gr. (%) -53.8 -11.3 123.7 BV/Sh(INR) 69.2 97.7 110.5 RoE (%) -35.9 35.2 16.7 RoCE (%) 9.6 22.8 12.8 Payout (%) 25.1 70.8 31.6 Valuations P/E (x) 44.9 50.6 22.6 P/BV (x) 6.0 4.3 3.8 EV/EBITDA 23.0 18.8 13.9 Div.Yld (%) 0.5 1.2 1.2 *Estimates include upside from FTF opportunities; FY14E figures are 15 months Ranbaxy's (RBXY) 5QFY14 results were below estimates. Revenue was flat YoY at INR24.7b (v/s est. INR27.3b), while EBITDA declined 7% YoY to INR1.5b (v/s est. INR2.4b), with EBITDA margin at 6.1% (v/s est. 8.8%). Reported loss stood at INR738m (v/s est. PAT of INR1.5b). Revenue growth was impacted by lower-than-expected performance across key geographies of the US, India OTC, CIS, APAC and Africa. Pertinently, there was a 69% decline in APIs business which in turn was impacted by discontinuation of Dewas and Taonsa operations. EBITDA margin fell 40bp YoY, impacted by higher fixed overheads and remediation costs incurred despite the slowdown in sales. RBXY has reported exceptional items of INR903m towards inventory write-off on Taonsa ban, goodwill impairment and diminution of value in a subsidiary. Adjusted for one-off items and forex impact, company reported PAT of INR136m (v/s est. INR1b), compared to PAT of INR623m in the corresponding quarter. Key concall takeaways: RBXY has refrained from giving guidance for FY15 and will share it in subsequent quarters. Merger with SUNP will need approval of 75% majority of total shareholders. Post which Sebi will approve the deal. Existing business is showing healthy underlying growth across key geographies and is expected to recover, going forward. Post 5QFY14 results, we have lowered FY15E/16E core EPS estimates by 6%/2% to reflect lower base business profitability. Over FY14-19E, we build core margin expansion of 780bp to 18% based on synergy benefits highlighted by SUNP. This assumes sales CAGR of 12% over the same period. We get a DCF value of INR559 for core business of RBXY. We add to this INR21/share from Para IVs which gives us an SOTP-based target price of INR580. We maintain Buy. Key risks to our arguments are integration challenges faced by SUNP and prolonged issues with the US FDA. Investors are advised to refer through disclosures made at the end of the Research Report.
- 2. 9 May 2014 2 Ranbaxy Labs Key takeaways from the call Guidance: The management has refrained from giving any guidance for FY15E and will share in subsequent quarter. On merger with SUNP: Management indicated that they will need approval of 75% majority of total shareholders. Post which, SEBI will approve the deal. Existing business excluding Taonsa and Dewas APIs is showing healthy underlying growth across key geographies and is expected to recover going forward. Performance in Africa, Middle-east and certain APAC markets was impacted due to lower tender business, which is expected to revive in coming quarters. India OTC segment reported a YoY dip for the first time in more than 12 quarters. The management believes that its key brands Volini and Revital has huge scope and expects revival in growth in the coming quarters. Absorica: Ranbaxy has gained 22% market share in Isotretinoin market. They do not expect the volume of the market to grow, but are confident of gaining market share from competitors. Employee expenses: Despite a sequential dip, are expected to increase going forward. ANDA filings: The company has filed 10 ANDAs during the year in the solid oral dosage space. However, the number of products pending approval was not shared: Exclusivities: The management continues to maintain that they will retain the exclusivities on all the key FTF opportunities of gDiovan, gNexium and gValcyte. Tax expenses for the quarter were higher due to higher tax outgo in some of its profitable foreign subsidiaries. Net debt stands at USD832m, while outstanding hedges stand at USD568m (down from USD665m last quarter). On an average, USD33m worth of hedges are expiring every year.
- 3. 9 May 2014 3 Ranbaxy Labs Story in Charts Quarterly sales trend Source: Company Quarterly EBITDA trend Source: Company US sales: Bases sales impacted by regulatory issues Source: Company India business has been impacted by DPCO-2013 Source: Company Revenue mix (INR m) Geography 5QFY14 1QFY14 % YoY India 5,536 5,427 2.0 Europe, CIS and Africa 8,166 8,605 -5.1 Asia Pacific & Middle East 1,116 1,156 -3.5 Latin America 552 503 9.7 USA 7,697 5,956 29.2 Canada 737 936 -21.3 Total Dosage 23,804 22,583 5.4 API 557 1,815 -69.3 Total Sales 24,361 24,398 -0.2 Source: Company Key comments Overall sales were impacted by discontinuation of API business at Taonsa and Dewas. Revenue growth was impacted by lower than expected performance across key geographies of US, India OTC, CIS, APAC and Africa. OTC business posted a YoY decline first time in more than 12 quarters. EBITDA margins were impacted to higher fixed overheads and remediation costs 23,391 23,652 24,894 24,176 26,834 28,016 28,940 24,668 2Q 3Q 4Q 1Q 2Q 3Q 4Q 5Q CY12 FY14 Core Sales (INR m) 2,688 2,908 412 1,537 2,625 1,938 2,602 1,508 11 12 2 6 10 7 9 6 2Q 3Q 4Q 1Q 2Q 3Q 4Q 5Q CY12 FY14 Core EBITDA (INR m) Core EBITDA margin(%) 85 90 90 95 133 121 142 124 169 65 46 15 5 5 5 2Q 3Q 4Q 1Q 2Q 3Q 4Q 5Q CY12 FY14 US generics (USDm) FTF sales (USDm) 4559 4780 4405 4477 4392 4621 4554 4753 982 1049 1013 950 1034 1127 1240 783 2Q 3Q 4Q 1Q 2Q 3Q 4Q 5Q CY12 FY14 India formulations (INR m) India OTC (INR m)
- 4. 9 May 2014 4 Ranbaxy Labs Story in Charts Steady core sales driven by growth across geographies Source: Company, MOSL US base business to revive aided by new launches Source: Company, MOSL India business to grow steadily; in line with market Source: Company, MOSL Profitability to improve with increasing scale Source: Company, MOSL RBXY’s SGA expenses highest among peers Source: Company, MOSL Core earnings to grow on a small base Source: Company, MOSL 68386 75824 80897 93612 132082 114808 130394 CY09 CY10 CY11 CY12 FY14 FY15E FY16E Core sales (INR m) 230 246 306 350 614 527 661163 307 406 594 30 307 CY09 CY10 CY11 CY12 FY14 FY15E FY16E Base business (USD m)* One-offs (USD m)* 14171 15108 16044 17928 22797 20152 22167 2129 2485 3110 3733 5134 5021 6025 CY09 CY10 CY11 CY12 FY14 FY15E FY16E India formulations (INR m) India OTC (INR m) 7,124 7,969 6,452 9,751 10,210 11,608 15,709 9.4 10.8 7.9 10.3 7.7 10.1 12.0 CY09 CY10 CY11 CY12 FY14 FY15E FY16E Core EBITDA(INR m)* Core EBITDAmargin (%)* 20.0 25.0 30.0 35.0 40.0 CY06 CY07 CY08 CY09 CY10 CY11 CY12 FY14E FY15E FY16E Ranbaxy Sun Pharma Lupin Glenmark Pharma Torrent Pharma 3.8 11.2 19.3 20.2 9.3 8.3 18.5 CY09 CY10 CY11 CY12 FY14 FY15E FY16E Core EPS (INR)
- 5. 9 May 2014 5 Ranbaxy Labs Valuation and view Over FY14-FY19, we build in core margin expansion of 780bp to 18% based on synergy benefits highlighted by SUNP. This assumes sales CAGR of 12% over the same period. We get a DCF value of INR559 for core business of RBXY. We add to this INR 21/share as value from Para IV opportunities which gives us a SoTP based TP of INR580. We maintain Buy. Key risks to our arguments are integration challenges faced by SUNP and prolonged issues with US FDA. RBXY: Financial Snapshot & valuation methodology Particulars Ranbaxy FY15E FY16E FY17E FY18E FY19E Core sales 115,113 130,394 146,042 163,567 183,195 YoY growth (%) -13.2 13.3 12.0 12.0 12.0 Core EBITDA 11,608 15,709 20,446 26,171 32,975 Margin (%) 10.1 12.0 14.0 16.0 18.0 Core PAT 3,496 7,820 11,441 15,622 20,688 YoY growth (%) -11.3 123.7 46.3 36.5 32.4 Target multiple for teminal value 20 Terminal value 413,765 Discount factor for 3 years @15% 0.5718 DCF value of base business 236,572 Per share value of base business 559 DCF value of FTFs 21 Total intrinsic value for RBXY 580 Source: Company, MOSL
- 6. 9 May 2014 6 Ranbaxy Labs Ranbaxy Labs: an investment profile Company description Ranbaxy is a leading global generic company with global revenues of over US$2b. The company has established a direct presence across the world in key markets like US, UK, Germany, France and Brazil. Around 40% of its revenues come from the developed markets of the US and Europe while emerging markets contributes about 55% of revenues. The company's fully integrated operations give it a cost advantage, which along with its aggressive foray into lucrative markets places it several notches above its peers in India. Key investment arguments One of the largest generic pipeline, coupled with a wide product basket and presence across different geographies, to ensure sustained growth, despite growing competition. Strong distribution presence in key global markets and fully-integrated operations make it well placed to ride the generics wave. Monetization of FTF opportunities should augur well. Key investment risks Stiff competition from other Indian players and aggressive counter strategies by innovator companies will continue in the foreseeable future. Delay in improving the profitability of the base business and forfeiture of 3 FTF resulting in large loss of profits. Recent developments Taonsa API unit banned by the US FDA Valuation and view Ranbaxy is valued at 50.6x FY15E and 22.6x FY16E core EPS. Our DCF value of all potential Para-IV upsides is INR21/share. Maintain Buy with TP of INR580. Sector view Differentiated portfolio in regulated markets and emerging markets would remain the key sale and profit drivers in the medium term. Japan is expected to emerge as the next growth driver. We are overweight on companies that offer a pragmatic mix of normal, low-competition and patent challenge opportunities in the US and presence in key emerging markets. Comparative valuations Ranbaxy DRL Cipla P/E (x) FY15E 50.6 18.8 18.8 FY16E 22.6 16.8 15.8 P/BV (x) FY14E 4.3 4.0 2.6 FY15E 3.8 3.3 2.3 EV/Sales (x) FY14E 1.8 3.0 2.8 FY15E 1.8 2.6 2.4 EV/EBITDA (x) FY14E 18.8 12.2 12.3 FY15E 13.9 10.6 10.6 EPS: MOSL forecast v/s consensus (INR) MOSL Consensus Variation Forecast Forecast (%) FY14 34.4 26.3 30.7 FY15 18.5 17.6 5.1 Target price and recommendation Current Target Upside Reco. Price (INR) Price (INR) (%) 464 580 25 Buy Shareholding pattern (%) Mar-14 Dec-13 Mar-13 Promoter 63.4 63.4 63.5 Domestic Inst 8.3 8.8 10.0 Foreign 14.1 13.2 13.3 Others 14.2 14.6 13.2 Stock performance (1-year)
- 7. 9 May 2014 7 Ranbaxy Labs Financials and valuation
- 8. 9 May 2014 8 Ranbaxy LabsDisclosures This report is for personal information of the authorized recipient and does not construe to be any investment, legal or taxation advice to you. This research report does not constitute an offer, invitation or inducement to invest in securities or other investments and Motilal Oswal Securities Limited (hereinafter referred as MOSt) is not soliciting any action based upon it. This report is not for public distribution and has been furnished to you solely for your information and should not be reproduced or redistributed to any other person in any form. Unauthorized disclosure, use, dissemination or copying (either whole or partial) of this information, is prohibited. The person accessing this information specifically agrees to exempt MOSt or any of its affiliates or employees from, any and all responsibility/liability arising from such misuse and agrees not to hold MOSt or any of its affiliates or employees responsible for any such misuse and further agrees to hold MOSt or any of its affiliates or employees free and harmless from all losses, costs, damages, expenses that may be suffered by the person accessing this information due to any errors and delays. The information contained herein is based on publicly available data or other sources believed to be reliable. While we would endeavour to update the information herein on reasonable basis, MOSt and/or its affiliates are under no obligation to update the information. Also there may be regulatory, compliance, or other reasons that may prevent MOSt and/or its affiliates from doing so. MOSt or any of its affiliates or employees shall not be in any way responsible and liable for any loss or damage that may arise to any person from any inadvertent error in the information contained in this report. MOSt or any of its affiliates or employees do not provide, at any time, any express or implied warranty of any kind, regarding any matter pertaining to this report, including without limitation the implied warranties of merchantability, fitness for a particular purpose, and non-infringement. The recipients of this report should rely on their own investigations. This report is intended for distribution to institutional investors. Recipients who are not institutional investors should seek advice of their independent financial advisor prior to taking any investment decision based on this report or for any necessary explanation of its contents. MOSt and/or its affiliates and/or employees may have interests/positions, financial or otherwise in the securities mentioned in this report. To enhance transparency, MOSt has incorporated a Disclosure of Interest Statement in this document. This should, however, not be treated as endorsement of the views expressed in the report. Disclosure of Interest Statement RANBAXY LABORATORIES LTD 1. Analyst ownership of the stock No 2. Group/Directors ownership of the stock No 3. Broking relationship with company covered No 4. Investment Banking relationship with company covered No Analyst Certification The views expressed in this research report accurately reflect the personal views of the analyst(s) about the subject securities or issues, and no part of the compensation of the research analyst(s) was, is, or will be directly or indirectly related to the specific recommendations and views expressed by research analyst(s) in this report. The research analysts, strategists, or research associates principally responsible for preparation of MOSt research receive compensation based upon various factors, including quality of research, investor client feedback, stock picking, competitive factors and firm revenues. Regional Disclosures (outside India) This report is not directed or intended for distribution to or use by any person or entity resident in a state, country or any jurisdiction, where such distribution, publication, availability or use would be contrary to law, regulation or which would subject MOSt & its group companies to registration or licensing requirements within such jurisdictions. For U.K. This report is intended for distribution only to persons having professional experience in matters relating to investments as described in Article 19 of the Financial Services and Markets Act 2000 (Financial Promotion) Order 2005 (referred to as "investment professionals"). This document must not be acted on or relied on by persons who are not investment professionals. Any investment or investment activity to which this document relates is only available to investment professionals and will be engaged in only with such persons. For U.S. Motilal Oswal Securities Limited (MOSL) is not a registered broker - dealer under the U.S. Securities Exchange Act of 1934, as amended (the"1934 act") and under applicable state laws in the United States. In addition MOSL is not a registered investment adviser under the U.S. Investment Advisers Act of 1940, as amended (the "Advisers Act" and together with the 1934 Act, the "Acts), and under applicable state laws in the United States. Accordingly, in the absence of specific exemption under the Acts, any brokerage and investment services provided by MOSL, including the products and services described herein are not available to or intended for U.S. persons. This report is intended for distribution only to "Major Institutional Investors" as defined by Rule 15a-6(b)(4) of the Exchange Act and interpretations thereof by SEC (henceforth referred to as "major institutional investors"). This document must not be acted on or relied on by persons who are not major institutional investors. Any investment or investment activity to which this document relates is only available to major institutional investors and will be engaged in only with major institutional investors. In reliance on the exemption from registration provided by Rule 15a-6 of the U.S. Securities Exchange Act of 1934, as amended (the "Exchange Act") and interpretations thereof by the U.S. Securities and Exchange Commission ("SEC") in order to conduct business with Institutional Investors based in the U.S., MOSL has entered into a chaperoning agreement with a U.S. registered broker-dealer, Motilal Oswal Securities International Private Limited. ("MOSIPL"). Any business interaction pursuant to this report will have to be executed within the provisions of this chaperoning agreement. The Research Analysts contributing to the report may not be registered /qualified as research analyst with FINRA. Such research analyst may not be associated persons of the U.S. registered broker- dealer, MOSIPL, and therefore, may not be subject to NASD rule 2711 and NYSE Rule 472 restrictions on communication with a subject company, public appearances and trading securities held by a research analyst account. For Singapore Motilal Oswal Capital Markets Singapore Pte Limited is acting as an exempt financial advisor under section 23(1)(f) of the Financial Advisers Act(FAA) read with regulation 17(1)(d) of the Financial Advisors Regulations and is a subsidiary of Motilal Oswal Securities Limited in India. This research is distributed in Singapore by Motilal Oswal Capital Markets Singapore Pte Limited and it is only directed in Singapore to accredited investors, as defined in the Financial Advisers Regulations and the Securities and Futures Act (Chapter 289), as amended from time to time. In respect of any matter arising from or in connection with the research you could contact the following representatives of Motilal Oswal Capital Markets Singapore Pte Limited: Anosh Koppikar Kadambari Balachandran Email:anosh.Koppikar@motilaloswal.com Email : kadambari.balachandran@motilaloswal.com Contact(+65)68189232 Contact: (+65) 68189233 / 65249115 Office Address:21 (Suite 31),16 Collyer Quay,Singapore 04931 Motilal Oswal Securities Ltd Motilal Oswal Tower, Level 9, Sayani Road, Prabhadevi, Mumbai 400 025 Phone: +91 22 3982 5500 E-mail: reports@motilaloswal.com