DHFC sales & profit accelerate in third quarter FY15, buy
•
1 like•283 views

For the quarter ended Q3 FY15, Net sales of the company rose to 17.31% y-o-y at Rs15262.70 million against Rs13010.10 million in the corresponding quarter of the previous year. Net profit Jumps to 15.36% y-o-y of Rs1596.58 million in Q3 FY15 against Rs. 1383.95 million in the corresponding quarter of the previous year.

Recommended
Recommended
More Related Content
What's hot
What's hot (20)
Viewers also liked
Viewers also liked (20)
Similar to DHFC sales & profit accelerate in third quarter FY15, buy
Similar to DHFC sales & profit accelerate in third quarter FY15, buy (20)
More from IndiaNotes.com
More from IndiaNotes.com (20)
Recently uploaded
Recently uploaded (20)
DHFC sales & profit accelerate in third quarter FY15, buy
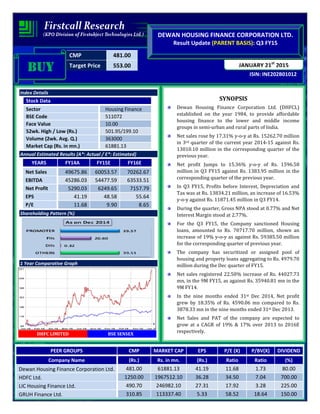
- 1. CMP 481.00 Target Price 553.00 ISIN: INE202B01012 JANUARY 21st 2015 DEWAN HOUSING FINANCE CORPORATION LTD. Result Update (PARENT BASIS): Q3 FY15 BUYBUYBUYBUY Index Details Stock Data Sector Housing Finance BSE Code 511072 Face Value 10.00 52wk. High / Low (Rs.) 501.95/199.10 Volume (2wk. Avg. Q.) 363000 Market Cap (Rs. in mn.) 61881.13 Annual Estimated Results (A*: Actual / E*: Estimated) YEARS FY14A FY15E FY16E Net Sales 49675.86 60053.57 70262.67 EBITDA 45286.03 54477.59 63533.51 Net Profit 5290.03 6249.65 7157.79 EPS 41.19 48.58 55.64 P/E 11.68 9.90 8.65 Shareholding Pattern (%) 1 Year Comparative Graph DHFC LIMITED BSE SENSEX SYNOPSIS Dewan Housing Finance Corporation Ltd. (DHFCL) established on the year 1984, to provide affordable housing finance to the lower and middle income groups in semi-urban and rural parts of India. Net sales rose by 17.31% y-o-y at Rs. 15262.70 million in 3rd quarter of the current year 2014-15 against Rs. 13010.10 million in the corresponding quarter of the previous year. Net profit Jumps to 15.36% y-o-y of Rs. 1596.58 million in Q3 FY15 against Rs. 1383.95 million in the corresponding quarter of the previous year. In Q3 FY15, Profits before Interest, Depreciation and Tax was at Rs. 13834.21 million, an increase of 16.53% y-o-y against Rs. 11871.45 million in Q3 FY14. During the quarter, Gross NPA stood at 0.77% and Net Interest Margin stood at 2.77%. For the Q3 FY15, the Company sanctioned Housing loans, amounted to Rs. 70717.70 million, shown an increase of 19% y-o-y as against Rs. 59385.50 million for the corresponding quarter of previous year. The company has securitized or assigned pool of housing and property loans aggregating to Rs. 4979.70 million during the Dec quarter of FY15. Net sales registered 22.50% increase of Rs. 44027.73 mn, in the 9M FY15, as against Rs. 35940.81 mn in the 9M FY14. In the nine months ended 31st Dec 2014, Net profit grew by 18.35% of Rs. 4590.06 mn compared to Rs. 3878.33 mn in the nine months ended 31st Dec 2013. Net Sales and PAT of the company are expected to grow at a CAGR of 19% & 17% over 2013 to 2016E respectively. PEER GROUPS CMP MARKET CAP EPS P/E (X) P/BV(X) DIVIDEND Company Name (Rs.) Rs. in mn. (Rs.) Ratio Ratio (%) Dewan Housing Finance Corporation Ltd. 481.00 61881.13 41.19 11.68 1.73 80.00 HDFC Ltd. 1250.00 1967512.10 36.28 34.50 7.04 700.00 LIC Housing Finance Ltd. 490.70 246982.10 27.31 17.92 3.28 225.00 GRUH Finance Ltd. 310.85 113337.40 5.33 58.52 18.64 150.00
- 2. Analysis & Recommendation- ‘BUY’ For the quarter ended Q3 FY15, Net sales of the company rose to 17.31% y-o-y at Rs. 15262.70 million against Rs. 13010.10 million in the corresponding quarter of the previous year. Net profit Jumps to 15.36% y-o-y of Rs. 1596.58 million in Q3 FY15 against Rs. 1383.95 million in the corresponding quarter of the previous year. In Q3 FY15, Profits before Interest, Depreciation and Tax was at Rs. 13834.21 million, an increase of 16.53% y-o-y against Rs. 11871.45 million in Q3 FY14. Profit before Tax (PBT) also rose by 22.65% in 3rd quarter of FY15 of Rs. 2415.19 million compared to Rs. 1969.16 million in same period previous year. Disbursements and Sanctions during the quarter amounted to Rs. 49232.10 million and Rs. 70717.70 million respectively as against Rs. 40302.30 million and Rs. 59385.50 million respectively in the corresponding quarter of previous year. During the Dec quarter of FY15, the company has securitized or assigned pool of housing and property loans aggregating to Rs. 4979.70 million. During the 9MFY15, DHFL has expanded its network strength taking its points of presence to over 570 locations. The improving economic scenario and the Indian Government's emphasis on affordable housing have created an encouraging demand for home loans. DHFL’s concerted focus on reaching out to customers in the low and middle income segment in tier 3, 4 and 5 locations has helped in maintaining a healthy loan portfolio and steady net profit growth during the third quarter of the 2014-15 financial year. We expect the company to post a CAGR of 19% & 17% in its top-line and bottom-line respectively. Hence, we recommend ‘BUY’ for ‘DEWAN HOUSING FINANCE CORPORATION LTD’ with a target price of Rs. 553.00 on the stock. QUARTERLY HIGHLIGHTS (PARENT BASIS) Results updates- Q3 FY15, DHFL, India’s second largest private sector housing finance company in India with a network across 570 locations and two international representative offices in Dubai, UAE and London, UK. The company has reported its financial results for the quarter ended 31st Dec, 2014. The company has achieved a turnover of Rs. 15262.70 million for the 3rd quarter of the financial year 2014-15 as against Rs. 13010.10 million in the corresponding quarter of the previous year. Operating profit or EBITDA increased form Rs. 13834.21 million to Rs. 11871.45 million in Q3 FY15. Net profit of Rs. 1596.58 million, an increase of 15.36% in Q3 FY15 against Rs. 1383.95 million in the corresponding quarter of the previous year. The company has reported an EPS of Rs. 12.41 for the 3rd quarter as against an EPS of Rs. 10.78 in the corresponding quarter of the previous year. Rs. In million DEC-14 DEC-13 % Change Net Sales 15262.70 13010.10 17.31 PAT 1596.58 1383.95 15.36 EPS 12.41 10.78 15.07 EBITDA 13834.21 11871.45 16.53
- 3. Break up of Expenditure: During the quarter, total expenditure (excluding interest & finance Expenses) rose by 30 per cent mainly on account of other expenses by 27%, Depreciation by 236% and employee Benefits Expenses by 22% are the primarily attributable to growth of expenditure when compared to corresponding quarter of previous year. Total expenditure in Q3 FY15 stood to Rs. 1514.36 million as against Rs. 1166.97 million in Q3 FY14. In Q3 FY15, Employee Benefit expenses incurred Rs. 490.39 million against Rs. 400.60 million in the corresponding period of the previous year. During the same quarter, Other Expenditure faced at Rs. 940.79 million against Rs. 741.65 million. Whereas depreciation in Q3 FY15 stood at Rs. 83.18 million against Rs. 24.72 million in Q3 FY15. Latest Updates • Total Income has increased from Rs. 13013.70 million for the quarter ended Dec 31, 2013 to Rs. 15265.39 million for the quarter ended Dec 31, 2014. • During the quarter ended 31st Dec 2014, the company sanctioned Housing loans, amounted to Rs. 70717.70 million as against Rs. 59385.50 million during the corresponding quarter of previous year. Shown an increase of 19% y-o-y. • Disbursements during the Dec quarter amounted to Rs. 49232.10 million, showing the increase of 22% as against Rs. 40302.30 million in the corresponding quarter of previous year. • DHFL, Prudential Financial, Inc. to expand partnership; form asset management joint venture for Indian customers. • During the Dec quarter of FY15, the company has securitized or assigned pool of housing and property loans aggregating to Rs. 4979.70 million.
- 4. • Loan Book Outstanding grew 26% to Rs 4777.60 million during the quarter ended Dec 31, 2014 as against Rs 3784.90 million in the corresponding quarter of the previous year. • Gross NPA stood at 0.77% and Net Interest Margin stood at 2.77% for the quarter ended Dec 31, 2014. COMPANY PROFILE Dewan Housing Finance Corporation Ltd. (DHFL) established on 11th of April in the year 1984 with registered office in Mumbai provides access to affordable housing finance to the lower and middle income groups in semi- urban and rural parts of India with a unique mission, which is benchmarked as a model of financial inclusion in the Indian financial services sector. The Company is CARE AAA rated and reckoned as one of India’s leading housing finance companies in India with network presence across over 570 locations. The company was set up with a vision to transform the lives of millions of Indians living just beyond the consideration zone of the Mortgage industry, by giving them access to home loans. Even after ~ 30 years it remains a financial institution with the systems, processes and dedication to serve this socio-economic group. After the acquisition and merger of First Blue Home Finance, DHFL caters to the middle and upper-middle income group. The company disbursed funds from its own equity contribution and had a return on equity of less than 8% at a time when the interest rates were about 18%. Over two decades later, DHFL is still profitably doing what its founder intended it to do. DHFL also has tie ups with leading public and private sector banks namely Punjab & Sind Bank, United Bank of India, Central Bank of India and YES bank to provide home loans to customers through a home loan syndication agreement. DHFL has also set up representative offices in London and Dubai to serve the ever increasing NRI population in these regions. It has also tied up with UAE Exchange to offer home loan products through the various UAE Exchange centers in GEC countries. Products and Services: Dewan Housing Finance Corporation Ltd has providing the following products. • Home Loans • Fixed Deposits • NRI Services • Property Services
- 5. Home Loans Home Purchase Loans Home Construction Loans Home Improvement Loans Home Extension Loans Home Loans for Self Employed Plot Loans Plot + Construction Composite Loan Home Loan Transfer Loan against Property Non Residential Property Loans Fixed Deposits Aashray Deposit 400 Days Aashray Deposit 365 Days Swayamsidha Deposit Aashray Deposit Plus
- 6. FINANCIAL HIGHLIGHT (PARENT BASIS) (A*- Actual, E* -Estimations & Rs. In Millions) Balance Sheet as at March 31, 2013 -2016E FY-13A FY-14A FY-15E FY-16E I EQUITY AND LIABILITIES A) Shareholder's Funds a) Share Capital 1282.20 1284.20 1286.51 1286.51 b) Reserves and Surplus 31088.70 34465.40 38601.25 42461.37 Sub -Total- Shareholder fund 32370.90 35749.60 39887.76 43747.88 B) Non Current Liabilities a) Long- Term Borrowings 265647.10 322954.80 368168.47 423393.74 b) Differed Tax Liability 0.00 11.50 14.95 18.39 c) Other Long Term Liabilities 27.70 15.10 16.31 17.94 d) Long Term Provisions 2636.00 3313.50 4042.47 4689.27 Sub-Total Non Current Liabilities 268310.80 326294.90 372242.20 428119.34 C) Current Liabilities a) Short Term Borrowings 8759.80 15947.20 31097.04 37160.96 b) Trade Payables 5.80 2.60 3.85 5.39 c) Other Current Liabilities 48120.80 59846.70 73611.44 84653.16 d)Short Term Provisions 462.30 751.30 871.51 1045.81 Sub-Total - Current Liabilities 57348.70 76547.80 105583.84 122865.32 TOTAL EQUITY AND LIABILITIES ( A + B + C) 358030.40 438592.30 517713.80 594732.53 II ASSETS D) Non- Current Assets Fixed Assets i. Tangible Assets 1718.00 1846.50 1984.99 2104.09 ii. Intangible Assets 74.20 69.30 61.68 55.51 iii. Capital Work in Progress 2587.10 7961.50 9076.11 10256.00 a) Total Fixed Assets 4379.30 9877.30 11122.77 12415.60 b) Non-Current Investment 1905.20 3067.00 3987.10 4904.13 c) Deferred Tax Assets 20.10 0.00 0.00 0.00 d) Long Term Housing & property Loans 323694.90 387469.00 451401.39 514875.98 e)Other Long Term Loans & Advances 330.00 160.80 183.31 207.14 f) Other Non-current Assets 2719.20 1945.10 1789.49 1861.07 Sub -Total- Non- Current Assets 333048.70 402519.20 468484.06 534263.92 E) Current Assets a) Current Investment 845.00 2692.00 3284.24 3875.40 b) Trade Receivables 589.70 774.50 3020.55 3866.30 c) Cash & Cash Equivalents 5125.60 9831.80 14157.79 17697.24 d) Short Term Portion of Housing & Property Loans 15322.30 18497.30 23039.92 27647.90 e) Other Short- Term Loans and Advances 2872.60 4028.10 5437.94 7069.32 f) Other Current Assets 226.50 249.40 289.30 312.45 Sub -Total Current Assets 24981.70 36073.10 49229.74 60468.61 TOTAL ASSETS (D+E) 358030.40 438592.30 517713.80 594732.53
- 7. Annual Profit & Loss Statement for the period of 2013 to 2016E Value(Rs. mn) FY13A FY14A FY15E FY16E Description 12m 12m 12m 12m Net Sales 41226.38 49675.86 60053.57 70262.67 Other Income 177.22 20.98 14.60 16.06 Total Income 41403.60 49696.84 60068.16 70278.73 Expenditure -4018.53 -4410.81 -5590.57 -6745.22 Operating Profit 37385.07 45286.03 54477.59 63533.51 Interest -31193.65 -37825.77 -44744.85 -52351.48 Gross profit 6191.42 7460.26 9732.74 11182.04 Depreciation -84.58 -109.13 -299.41 -353.30 Profit Before Tax 6106.84 7351.13 9433.33 10828.74 Tax -1588.30 -2061.10 -3183.68 -3670.94 Net Profit 4518.54 5290.03 6249.65 7157.79 Equity capital 1282.19 1284.20 1286.51 1286.51 Reserves 31088.74 34465.40 38601.25 42461.37 Face value 10.00 10.00 10.00 10.00 EPS 35.24 41.19 48.58 55.64 Quarterly Profit & Loss Statement for the period of 30th June, 2014 to 31st Mar, 2015E Value(Rs.in.mn) 30-Jun-14 30-Sep-14 31-Dec-14 31-Mar-15E Description 3m 3m 3m 3m Net sales 14263.08 14501.95 15262.70 16025.84 Other income 3.46 3.93 2.69 4.52 Total Income 14266.54 14505.88 15265.39 16030.35 Expenditure -1302.13 -1334.81 -1431.18 -1522.45 Operating profit 12964.41 13171.07 13834.21 14507.90 Interest -10705.86 -10800.52 -11335.84 -11902.63 Gross profit 2258.55 2370.55 2498.37 2605.27 Depreciation -33.91 -90.82 -83.18 -91.50 Profit Before Tax 2224.64 2279.73 2415.19 2513.77 Tax -753.10 -757.79 -818.61 -854.18 Net Profit 1471.54 1521.94 1596.58 1659.59 Equity capital 1286.07 1286.51 1286.51 1286.51 Face value 10.00 10.00 10.00 10.00 EPS 11.44 11.83 12.41 12.90
- 8. Ratio Analysis Particulars FY13A FY14E FY15E FY16E EPS (Rs.) 35.24 41.19 48.58 55.64 EBITDA Margin (%) 90.68 91.16 90.71 90.42 PBT Margin (%) 14.81 14.80 15.71 15.41 PAT Margin (%) 10.96 10.65 10.41 10.19 P/E Ratio (x) 13.65 11.68 9.90 8.65 ROE (%) 13.96 14.80 15.67 16.36 ROCE (%) 12.21 12.12 12.47 12.67 Debt Equity Ratio 8.48 9.48 10.01 10.53 EV/EBITDA (x) 8.83 8.57 8.14 7.88 Book Value (Rs.) 252.47 278.38 310.05 340.05 P/BV 1.91 1.73 1.55 1.41 Charts
- 9. OUTLOOK AND CONCLUSION At the current market price of Rs. 481.00, the stock P/E ratio is at 9.90 x FY15E and 8.65 x FY16E respectively. Earning per share (EPS) of the company for the earnings for FY15E and FY16E is seen at Rs.48.58 and Rs. 55.64 respectively. Net Sales and PAT of the company are expected to grow at a CAGR of 19% & 17% over 2013 to 2016E respectively. On the basis of EV/EBITDA, the stock trades at 8.14 x for FY15E and 7.88 x for FY16E. Price to Book Value of the stock is expected to be at 1.55 x and 1.41 x respectively for FY15E and FY16E. We recommend ‘BUY’ in this particular scrip with a target price of Rs.553.00 for Medium to Long term investment. INDUSTRY OVERVIEW Economic Overview The financial year 2013-14 has been decisive in more ways than one. It was a year that saw financial indicators swinging between extremes. However, they left behind some interesting lessons to be learnt and an optimistic outlook as well, for the world to again look at India with renewed interest. As per advance estimates released by the Central Government, India’s GDP growth in the year was expected to be 4.9% (4.5% in the previous year), the second successive year of a below 5% growth. Stalled infrastructure projects and subdued corporate investments contributed to the slowdown on the one hand, while consumer sentiment was affected by higher inflation and Rupee depreciation on the other. The Reserve Bank of India reduced policy rates by 100 bps in 2012-13 and 25 bps in May 2013. Before its June 2013 policy review, following risks of external sector instability, the US Fed hinted at a gradual withdrawal of quantitative easing. This put emerging market assets under pressure, with countries running high current account deficits. Between May 2013 and August 2013, the Indian Rupee depreciated by 16.3% on the back of a USD 12.6 billion capital out flow from India’s domestic equity and bond markets. The RBI undertook several policy measures to restore stability. In consultation with the Government, gold imports were restricted to reduce the pressure on CAD. With a 1.2 billion strong population, the world’s fourth largest economy appears to enjoy a robust outlook. Six and a half decades post-independence, the country has achieved a landmark agricultural revolution that has enabled the nation to reduce its dependence on grain imports. This has helped India transform into a global agricultural powerhouse, and now a net food exporter. Life expectancy has more than doubled, literacy rates have quadrupled, health conditions have improved and a sizeable middle class has emerged. India is now home
- 10. to globally recognised companies in pharmaceuticals, steel, information and space technologies, and has a growing global voice in keeping with its size and potential. Job creation will catalyse India’s annual growth rate, which has been below the 5% mark for the past five quarters. Housing Industry Overview The growth of the Indian economy combined with the resultant rise in the per capita income has stepped up the pace of urbanisation. This, along with the increasing availability of finance, has resulted in a growth in demand for housing in the past few years. As per CRISIL estimates, the housing stock in India stood at ~148 million during FY 2014, as compared to around 103 million a decade back. Further improvements in the macroeconomic scenario, coupled with demographic changes in population such as changing agemix, increasing nuclearisation of families, among others are expected to give an added impetus to the growth of the housing industry in India. The country’s housing finance companies maintained their asset quality as reflected in a GNPA of 0.84% as at December 31, 2013. Correspondingly, profitability remained largely stable for housing finance companies on account of an improvement in operating efficiencies and low credit costs. India’s housing mortgage market is extensively under-penetrated. India’s mortgage-to-GDP ratio is low as compared to other developing countries at 9%, having improved by 300-400 bps over the last six years. In the long-term, increasing income levels, improving affordability, rising urbanisation including emergence of Tier-II and Tier-III cities and the evolution of the nuclear family concept, ease of financing, tax incentives and widening reach of financiers will have an impact on the industry. Increase in volumes and rise in property prices will also play a significant role in determining growth in disbursements. Opportunities and optimism Rural demand: Rural India accounts for 70% of the country’s population, 56% of the country’s total income and 33% of India’s savings. Since 2000, per capita GDP has grown faster in India’s rural areas than in its urban centres – a 6.2% CAGR versus 4.7%. Rural incomes are growing, and consumers are vying for discretionary goods and lifestyle products. Between 2009 and 2012, spending in rural India reached USD 69 billion, significantly higher than the USD 55 billion spent by the country’s urban population. Housing shortage: India’s urban housing shortage touched 18.78 million units while rural shortage stood at 43.67 million units, with 90% of the shortage seen in the low income groups. Urban growth across the world is projected to double from 3.3 billion in 2007 to 6.4 billion in 2050, with more pronounced increase in the developing countries. Government initiatives: According to recent reforms, FDI up to 100% has been permitted under the automatic route in townships, housing, built-up infrastructure and construction development projects. The Government of India sanctioned projects worth Rs.417230.00 million for building 15,69,000 houses / dwelling units for economically weaker / lower income sections under the Housing Ministry’s flagship scheme Jawaharlal Nehru National Urban Renewal Mission (JNNURM) programme.
- 11. Rising proportion of the working age population: The country’s population was expected to have increased to 1230 million by March 2014 from 1217 million in March 2013. India’s median age of 24 years makes the nation one of the youngest countries globally with a productive workforce. Nearly two-thirds of India’s population is in the working age group (15-64 years). Rising incomes: India’s per capita income is projected to increase by 10.4% to Rs. 749200.00 million in 2013-14 as the country emerges as a USD 1.7 trillion economy. However, the increase in per capita income would be by only 2.8% in 2013-14 on the basis of 2004-05 prices. Urbanisation: India has the highest urban population rate change amongst BRIC nations. Urban dwellers accounted for 31.6% of India’s population in 2012. By 2015, India’s urban population is expected to grow by 2.5%, above the 1.3% growth expected in the total population. At this rate, it is estimated that around 843 million people will live in Indian cities by 2050, offering large-scale opportunities for the housing and infrastructure development sector. Rising consumer class: By 2020, India is projected to become the world’s third largest middle class consumer market behind China and the US. By 2030, India is likely to surpass both countries with an aggregated consumer spend of nearly USD 13 trillion. Rising middle class incomes are driving aspirational consumer behaviour as people seek quality products, better healthcare and more sophisticated services. Nuclear families: Some 56% of urban Indian households now comprise four or less members, a marked change from 10 years ago, when the median household size in urban India was between four and five members. Nuclear families are becoming the overwhelming norm in India, with 70% of households comprising just one married couple, triggering a need for new homes. Disclaimer: This document is prepared by our research analysts and it does not constitute an offer or solicitation for the purchase or sale of any financial instrument or as an official confirmation of any transaction. The information contained herein is from publicly available data or other sources believed to be reliable but we do not represent that it is accurate or complete and it should not be relied on as such. Firstcall Research or any of its affiliates shall not be in any way responsible for any loss or damage that may arise to any person from any inadvertent error in the information contained in this report. Firstcall Research and/ or its affiliates and/or employees will not be liable for the recipients’ investment decision based on this document.
- 12. Firstcall India Equity Research: Email – info@firstobjectindia.com C.V.S.L.Kameswari Pharma & Diversified U. Janaki Rao Capital Goods B. Anil Kumar Auto, IT & FMCG M. Vinayak Rao Diversified G. Amarender Diversified Firstcall Research Provides Industry Research on all the Sectors and Equity Research on Major Companies forming part of Listed and Unlisted Segments For Further Details Contact: Tel.: 022-2527 2510/2527 6077 / 25276089 Telefax: 022-25276089 040-20000235 /20000233 E-mail: info@firstobjectindia.com www.firstcallresearch.com